HAL Id: tel-00984292
https://tel.archives-ouvertes.fr/tel-00984292
Submitted on 28 Apr 2014
HAL is a multi-disciplinary open access archive for the deposit and dissemination of sci-entific research documents, whether they are pub-lished or not. The documents may come from teaching and research institutions in France or abroad, or from public or private research centers.
L’archive ouverte pluridisciplinaire HAL, est destinée au dépôt et à la diffusion de documents scientifiques de niveau recherche, publiés ou non, émanant des établissements d’enseignement et de recherche français ou étrangers, des laboratoires publics ou privés.
Regulation and trade in development : explaining
productivity at the firm level
Sean Michael Dougherty
To cite this version:
Sean Michael Dougherty. Regulation and trade in development : explaining productivity at the firm level. Economics and Finance. Université Panthéon-Sorbonne - Paris I, 2013. English. �NNT : 2013PA010012�. �tel-00984292�
Universit´
e Paris I - Panth´
eon Sorbonne
U.F.R. de sciences ´
economiques
Ann´ee 2013 Num´ero attribu´e par la biblioth`eque
|2|0|1|3|P|A|0|1|0|0|0|x|
TH`
ESE
Pour l’obtention du grade de Docteur de l’Universit´e de Paris I Discipline : Sciences Economiques
Pr´esent´ee et soutenue publiquement par
Sean Michael
DOUGHERTY
le 11 avril 2013
————–
Regulation and Trade in Development
Explaining Productivity at the Firm Level
————–
Directeur de th`ese : Lionel Fontagn´
e
JURY :
Ron Davies Professeur `a University College Dublin (rapporteur)
Federico Trionfetti Professeur `a l’Universit´e d’Aix-Marseille (GREQAM) (rapporteur)
Antoine Berthou Economiste `a la Banque de France et chercheur associ´e au CEPII
Matthieu Crozet Professeur `a l’Ecole d’Economie de Paris, Universit´e Paris 1
Lionel Fontagn´e Professeur `a l’Ecole d’Economie de Paris, Universit´e Paris 1
L’universit´e Paris I Panth´eon-Sorbonne n’entend donner aucune approba-tion ni improbaapproba-tion aux opinions ´emises dans cette th`ese. Ces opinions doivent ˆetre consid´er´ees comme propres `a leur auteur.
Acknowledgements
I would like to start with some words of thanks. First and foremost, to extend my great appreciation to Lionel Fontagn´e for inviting me to undertake this vast project of a “fresh” dissertation at the Paris School of Economics, knowing that I would likely be working full time (and often much more than that) at the OECD. His frank feedback and strong nudges—sometimes with active resistance on my part—kept me going and ensured that I did what was necessary to finish the project. Finding the time to work on these “academic” research papers was no easy task, and although my management supported the project, they did not think it was appropriate to donate any additional office time to work on it! Thus, it is quite a feat that I now arrive at the finish line, having only (successfully) taken one brief break and a faux-sabbatical somewhere in the middle to focus on parts of the project.
Beyond my thesis director’s invaluable guidance, the committee’s written and oral feedback in the pre-defense has been extremely helpful in sharpening the arguments of the papers, and I would like to especially thank the external referees Ron Davies and Federico Trionfetti for reading the papers carefully and posing precise, thought-provoking written questions. All of the Jury’s feedback has been valuable, and the time that they have devoted to reading and preparing oral questions is most appreciated.
I would also like to extend gratitude to the people that induced me to start this endeavor: especially my former graduate advisor at the University of Pennsylvania, Alan Heston, who encouraged me to re-consider this dissertation project after a long hiatus from graduate school, and without whose enduring support I would not be where I am now; in addition, to Fr´ed´eric Langer, who brought me to the OECD to work as a diplomat-economist, and then urged me to pursue a research track; and to my senior OECD colleague Joaquim Oliveira Martins, who first suggested the idea of doing a mid-career dissertation at the Sorbonne’s economics department, and introduced me to Lionel Fontagn´e.
vi Acknowledgements
My managers and colleagues at the OECD were essential to have on board with this project, most especially Sven Bl¨ondal, who was particularly supportive early on when I decided to begin. I am also indebted to my other managers—Andrew Dean, Romain Duval, Jørgen Elmeskov, Robert Ford, Vincent Koen, Patrick Lenain, and Jean-Luc Schneider—who were all tolerant of my schedule and supportive of the various papers along the way.
For the first chapter, I would like to thank my co-author Sarra Ben Yahmed, who was extremely patient with the long process which resulted in the paper on which it is based. This included various data problems early on, which were not easily overcome. Her perseverance and good cheer were invaluable.
For the second and third chapters, I obtained support for a one month visit to MIT’s Center for International Studies and a half-year sabbatical at the National Institute of Public Finance and Policy (NIPFP), to whom I am grateful. These breaks from frequent OECD missions and the Secretariat’s “Work Programme” enabled me to focus more intensively on the middle two papers, and also brought me in in close touch with my co-authors of the papers behind these chapters. Kala Krishna, whom I met at the NBER, helped to get the paper behind the third chapter started with Ver´onica Frisancho Robles, and their contributions to it were essential. Ila Patnaik, who invited me to visit the NIPFP, and Rudrani Bhattacharya, ensured that the paper behind the third chapter got underway and saw to its advancement. For the fourth chapter, I am indebted to Patrick Lenain for supporting it as a technical background paper to our latest Economic Survey of Mexico, allowing
this last chapter to be completed in record time. The INEGI of Mexico also
provided custom extracts from their confidential microdata, and Natalia Volkow was instrumental in making this happen.
These chapters have been presented at various seminars (mostly at the OECD and Paris School of Economics) and conferences (at the Banque de France, Columbia and Tsinghua Universities), and while it is not possible to thank everyone who asked an insightful question, I would like to especially thank Philippe Aghion, Matthias B¨urker, Giuseppe Nicoletti, Gianmarco Ottaviano, Mauro Pisu, Jean-Luc Schneider, and a number of anonymous journal referees, who were all particularly generous with their time and gave extensive comments on one or more chapters. Elda Andr´e was also very helpful with administrative aspects of my thesis project.
Lastly, I would like to thank my family and close friends, especially my parents, who never gave up hope, and Renata, who gave me lots of encouragement on the final lap to the finish line.
Table of Contents
Acknowledgements v
Table of Contents ix
I Import competition, domestic regulation and firm-level
productiv-ity growth in the OECD 1
1 Introduction . . . 1
2 Data and measurement . . . 6
2.1 Firm-level data: Amadeus . . . 6
2.2 Sampling frame . . . 7
2.3 Estimation of Total Factor Productivity . . . 8
2.4 Trade openness . . . 11
2.5 Regulation and market structure measures . . . 12
3 Empirical analysis of firm-level productivity . . . 15
3.1 The effect of competition . . . 15
3.2 Empirical specification: difference-in-differences . . . 16
3.3 The importance of the firm’s distance to the frontier . . . 18
3.4 The issue of reverse causality . . . 18
3.5 Interpretation of results . . . 19
3.6 Effects on productivity . . . 25
4 Conclusion . . . 27
5 Annex . . . 29
II Labor market regulation and plant-level productivity in India 31 1 Introduction . . . 31 2 Previous Literature . . . 35 3 Data . . . 40 3.1 Basic Patterns . . . 46 4 Empirical Strategy . . . 50 4.1 TFP Measures . . . 51 4.2 Econometric Model . . . 53 vii
viii Table of Contents
5 Results . . . 55
5.1 Volatility . . . 63
6 Robustness Checks . . . 64
7 Conclusions and Extensions . . . 67
8 Annex . . . 72
III Outward foreign direct investment and productivity in Indian manufacturing firms 77 1 Introduction . . . 77
2 The data set . . . 79
2.1 Growth of Indian MNCs . . . 79
3 Methodology . . . 82
3.1 Productivity measurement: Levinsohn-Petrin methodology . . 82
3.2 Panel regression . . . 84
3.3 Matching . . . 86
3.3.1 Treating the data . . . 86
3.3.2 Match balance . . . 87
3.3.3 Constructing the counterfactual . . . 87
4 Results . . . 89
4.1 Productivity measures . . . 89
4.2 Panel regression . . . 90
4.2.1 Productivity differences in level . . . 90
4.2.2 Productivity differences in growth rates . . . 90
4.3 Average productivity growth . . . 93
5 Conclusion . . . 95
6 Annex . . . 96
IV Contract enforcement, market access and firm size in Mexico 97 1 Introduction . . . 97
2 Firm size and legal systems . . . 98
3 Data . . . 100
3.1 Bin-level economic census data . . . 100
3.2 Measures of judicial quality . . . 102
3.3 Instruments . . . 105
3.4 Geographic controls . . . 106
4 Estimation strategy and results . . . 107
4.1 Basic estimates . . . 108
4.2 Robustness tests . . . 110
Table of Contents ix 4.4 Efficiency effects . . . 116 5 Conclusion . . . 118 6 Annex . . . 119 Data Appendix 121 1 Chapter I . . . 121 2 Chapter II . . . 122 3 Chapter III . . . 122 4 Chapter IV . . . 123 Bibliography 124 List of tables 136 List of figures 137
Chapter I
Import competition, domestic
regulation and firm-level
productivity growth in the OECD
1
1
Introduction
Globalization has dramatically reduced explicit barriers to international trade in OECD as well as non-OECD countries over recent decades. These tariff-type barriers have fallen far enough in manufacturing that they likely no longer represent a major obstacle to goods exporting and importing (Bou¨et et al., 2008). Institutional limits on protection that prevent countries from raising tariffs even in times of economic crisis have so far proven effective in preventing a bout of defensive, or retaliatory, anti-trade measures, even in the context of the panic-inducing Great Recession that we have just experienced (OECD, 2011).
Nevertheless, behind-the-border regulation still remains quite stringent in many economies (W¨olfl et al., 2009b; Conway et al., 2010). Stringent regulation of product markets obstructs firm entry, operation and exit, thereby limiting competition, which 1
This chapter is a revised version of FREIT working paper No. 307 (2011), “Trade, Regulation and Firm-Level Productivity in the OECD,” ‘ and OECD Economics Department working paper No. 980 (2012), “Import Competition, Domestic Regulation and Firm-Level Productivity Growth in the OECD,” jointly written with Sarra Ben Yahmed (Universit´e de la M´editerran´ee–GREQAM and Institut d’´etudes politiques de Paris).
2 Import competition, domestic regulation and firm-level productivity growth
can reduce firms’ ability and incentives to improve their productivity. However, the mechanisms that cause weak competition to hamper productivity are not fully
understood. In their recent review of endogenous growth theory, Aghion and
Howitt (2009) argue that there is a U-shaped relationship between the degree of competition and productivity, where firms closer to the global technological frontier face stronger incentives to innovate in order to overcome the potential threat of new entrants. Near the frontier, stringent regulation reduces neck-to-neck competition and innovation, harming firm productivity. In contrast, farther from the frontier, Schumpeter (Mark II)-type effects dominate and firms face discouragement, making innovation and productivity growth less likely, regardless of regulation.
New trade theory also incorporates heterogeneity in firm technological efficiency, though with a different perspective, as most theoretical papers take firms’ pro-ductivity levels as given and investigate how sectoral propro-ductivity changes in the aftermath of trade liberalization. Various models featuring heterogeneous firms, notably Melitz’s (2003), posit that trade liberalization yields entry and exit dynamics that reallocate market shares from low-productivity firms to higher productivity firms that compete in international markets. Bernard et al. (2007) show how this process can help strengthen comparative advantage through creative destruction, though in neither case do the dynamics come about through intra-firm productivity
dynamics. Melitz and Ottaviano (2008) highlight the pro-competitive effect of
trade taking into account market size. They show that sectoral productivity can be enhanced through increasing toughness of import competition, implying the potential for dynamic gains from policy reform.
This paper builds on the intuition of new trade models on the pro-competitive effect of trade along with the prediction of endogenous growth models where the effect of competition and regulation on firm productivity depends on firms’ efficiency levels. It takes a difference-in-differences approach that uses the insights from the new trade literature to identify the empirical effects of import competition and anti-competitive domestic regulation on productivity at the firm level, also incorporating
Import competition, domestic regulation and firm-level productivity growth 3
distance-to-technological frontier effects. In so doing, it develops new evidence in support of both sets of theories, suggesting that (i) trade models could be enriched by incorporating a distance-to-frontier and intra-firm productivity dimension, and (ii) distance-to-frontier ideas could be further enriched by examining their interactions with trade, helping to better explain the underlying mechanisms.
Beyond these general insights, several important findings stand out:
❼ Stronger competition, in the form of higher import penetration, is associated with higher firm-level productivity growth close to the technological (measured in terms of productivity levels) frontier, an effect that remains robust even when estimated in lags, though it varies when the smallest firms are over-sampled in the dataset. The main result is consistent with the predictions of the Aghion endogenous growth model as well as the Melitz and Ottaviano framework, though the latter would not have predicted a differential firm-level effect vis-`a-vis the technology frontier.
❼ Close to the technology frontier, anti-competitive product market regulation substantially reduces the scope for TFP improvements spurred by import competition; far from the frontier, the interaction between regulation and foreign competition is not statistically significant. The effect of product market regulation depends on the sectoral trade orientation; more precisely, we find that product market regulation damages the scope for productivity growth at least in part by reducing the competition-enhancing effect of import competition on top firms.
❼ The productivity-enhancing effect of import competition and the mitigating effect of product market regulation are robust to the inclusion of a Herfindahl index that captures the market shares concentration across firms, controls for the stringency of upstream regulation, as well as country-time fixed effects and industry fixed effects that capture respectively country specific policies
4 Import competition, domestic regulation and firm-level productivity growth
or macroeconomic shocks and time-invariant industry-specific characteristics such as the intensity of ICT use.
In order to examine these questions, a large-scale firm database (Amadeus) is examined that covers half of the OECD member countries, which is then re-weighted to be representative of the actual size distribution of firms in the whole population, and matched with regulation and trade datasets. This firm data is sufficient to allow for the measurement of robust productivity measures that take account of potential simultaneity biases. Unique OECD indexes of product market regulation are used to measure de jure regulatory settings, at the country level and across time. International trade data are matched with production data, to generate measures of import penetration at the detailed industry level.
Previous evidence on the effect of domestic regulation on productivity has examined various channels, though these studies have generally not examined their interaction with trade. A number of empirical studies, particularly those of the OECD (2003, 2006, 2011), have found distortionary effects of indicators of product and labor market regulation on overall productivity outcomes. For instance, Arnold et al. (2010) look at the effect of product market regulation on firm-level productivity – through the ICT channel – and find supportive evidence of distance-to-frontier effects. At the industry level, Bourl`es et al. look at the effect of upstream product market regulation on sector-level productivity, and they also find distance-to-frontier effects. Conway et al. found similar sectoral effects for broader market regulation, while Nicoletti and Scarpetta (2003) found related, yet inverted, effects with respect to the distance-to-frontier.
More aggregate empirical work has used less detailed indicators of institutional and policy settings to examine the role of institutions in mediating the role of trade in affecting overall growth and productivity outcomes. Cross-country studies include Dollar and Kraay (2003), Rodrick et al. (2004), Alcal´a and Ciccone (2004), and Freund and Bolaky (2008), who have tried to disentangle the respective roles of institutions and trade for growth at the country level. On balance, the
Import competition, domestic regulation and firm-level productivity growth 5
evidence appears to suggest that institutions have a more fundamental role, as they complement trade liberalization, and strengthen the long term effects of trade on growth, by enhancing the role of comparative advantage. However, the types of policies and reforms that may drive productivity in this context are still not clear from this literature.2
Research at the level of the firm seems more promising to reveal the underlying mechanics of how policies may work through trade to affect productivity and growth outcomes. Firm-level analysis has revealed a substantial role for product market regulation in affecting the margins of firm exit and entry as well as reallocation of productivity across firms (e.g., Bartelsman et al. (2009)). However, this work does not explicitly consider how international trade may drive and/or reinforce these margins.
There have been a series of country-specific firm-level studies that have identified substantial roles for international trade regulation specifically in affecting firm entry/exit and reallocative margins, for Chile (Pavcnik, 2002; Bas and Ledezma, 2010), Columbia (Fernandez, 2007), France (Bas and Strauss-Kahn, 2011), India (Topalova, 2004; Goldberg et al., 2010), Indonesia (Amiti and Konings, 2007) and the UK (Aghion et al., 2009). Several of these studies show that reductions in import barriers can help to boost within-firm productivity (Amiti and Konings, 2007; Bas and Ledezma, 2010; Goldberg et al., 2010). However, these single-country studies do not address behind-the-border regulation, which varies principally across countries.3
We contribute to the literature by attempting to answer the questions raised above by estimating productivity growth equations at the firm level where exposure to international markets and to domestic regulation both interact. We find that 2
One promising approach from a related literature uses incomplete contract theory to examine the effect of overall institutional quality on the organization of trade. Studies following this approach include Acemoglu et al. (2007), who find an important role of contracting institutions leading to strengthened comparative advantage.
3
Although not focused on productivity, Crozet et al. (2012) take an innovative approach to addressing the effect of different countries’ domestic regulations on services trade, using bilateral export data from French firms. The study finds strong detrimental effects of purely domestic regulations on both the extensive and intensive export margins of the firms – with domestic regulations being even more damaging for trade than explicit international trade barriers.
6 Import competition, domestic regulation and firm-level productivity growth
their effect can be non-linear and depends on the characteristics of heterogeneous firms – especially their distance to the global technological frontier.
The paper proceeds as follows. The second section describes the data and
sampling frame, the construction of productivity, import penetration and domestic
regulation measures. The third section motivates the empirical approach, and
examines the effects of import penetration and domestic regulation on firm-level productivity growth. The fourth section concludes.
2
Data and measurement
In order to investigate the questions raised above, firm-level data are used to compute productivity measures, sectoral trade data are used to measure foreign competition, and restrictive regulation is measured using the OECD’s economy-wide indexes of product market regulation.
2.1
Firm-level data: Amadeus
Firm level data are used based on company reports included in the Amadeus database compiled by the Bureau van Dijk. This database covers European OECD countries over the time period 1995–2005. The countries with sufficient numbers of firms for our use are Belgium, the Czech Republic, Denmark, Finland, France, Germany, Italy, the Netherlands, Norway, Poland, Portugal, Spain, Sweden and the United Kingdom. The data for Greece are not used since they lack wage and materials data. While all the countries included are OECD members, the former transition economies of Central and Eastern Europe are likely to have a wider dispersion of productivity across firms than the other countries as a result of their one-time structural transitions.
Data are cleaned for potential outliers that we identify by several criteria. First, firms with negative values for any variable entering the production function – operating revenue or value added, wages, capital stock, material inputs – or with
Import competition, domestic regulation and firm-level productivity growth 7
depreciation higher than net capital stock are eliminated from the sample. Firms that report extreme year-to-year variation in ratios between production function variables and extreme reversals in one of these variables are not retained, either. Finally, outliers have been removed by eliminating the top and bottom one percent of the productivity distribution and subsequently re-estimating productivity without these extreme observations. The productivity estimation is described in more detail below.
Sectoral coverage includes all tradable goods and services, including mining, all of manufacturing (ISIC 15 to 37), electricity, utilities (ISIC 40, 51, 52), transport and communications (ISIC 60 to 64), business activities as R&D, advertising (ISIC 71 to 74) and recreational and cultural activities (ISIC 92). Consolidated accounts in the Amadeus dataset are dropped, which avoids problems of double-counting.
2.2
Sampling frame
The Amadeus data are broadly representative of the business sectors of OECD countries, since they include virtually all public companies, and as such are a fair representation of larger companies. However, smaller firms are underrepresented, since they typically do not report balance sheet information publicly. In addition, not all firms in the Amadeus data report information on all production function variables. The remaining sample used in this study includes only firms for which TFP estimates could be obtained.
In order to ensure that the sample of firms is as representative as possible of the population distribution of firms across size classes, sectors and countries, a re-sampling procedure was applied (see Schwellnus and Arnold, 2008). First, population weights for every size-sector-country strata were calculated from the OECD Structural Demographic Business Statistics (SDBS) database for the year 2000. Second, random draws with replacement from each size-sector-country strata in the TFP sample were taken until the weight of each strata corresponds to its
8 Import competition, domestic regulation and firm-level productivity growth
population weight.4
This method resulted in a sample that is representative of the population distribution along the dimensions of employment size, sector and country. The sample size is then set to 139,065 firms (drawn from a set of 79,513 real firms) which results in 831,187 firm-year observations. While this method yields a more representative sample in the year 2000, it may also increase measurement error since ‘successful’ smaller firms are over-sampled. As a result, the resampled dataset may be less representative as the time period shifts away from the year 2000 since normally such firms have high rates of entry and exit. Thus, both the non-resampled and the resampled data are considered in the basic specifications in order to ensure robustness.
2.3
Estimation of Total Factor Productivity
Our productivity variable, total factor productivity (TFP), measures the firm-level efficiency in the use of all inputs. We calculate TFP as the residual from the estimation of a logarithmic Cobb-Douglas production function of the form:
ln yisct = αscln lisct+ βscln kisct+ ǫisct (I.1)
where the subscripts stand for the firm i from country c operating in sector s at time t. The dependent variable of the production function is the firm’s value-added (y). The production factors are labor (l) and capital (k). When value-added was not available, it was imputed as the residual between operating revenue and material inputs. Labor inputs are measured using the total wage bill, while net capital stocks were used to measure capital input. Nominal values are deflated using sector-specific price indexes, with the exception of capital stocks that have been deflated using deflators for gross fixed capital formation. The production function is estimated at 4
The re-sampling procedure is restricted to firms with at least 20 employees since the coverage below this threshold is unsatisfactory. The firm size classes used for resampling (from SDBS) are: 20-49; 50-99; 100-499; 500 or more employees.
Import competition, domestic regulation and firm-level productivity growth 9
the sector-country level sc, in order to avoid strong assumptions on the homogeneity of production technologies across sectors and OECD countries. The residuals ǫisct
represent plant-specific efficiency in the year t.
The ideal measure of TFP would be in volume terms, “physical TFP”. However, given the available data, we use a “revenue-based TFP”. The pluses and minuses of using various measures are discussed in Foster et al. (2008). In most business micro data sets like Amadeus, establishment-level prices are unobserved. Thus, establishment output is measured as revenue divided by a common industry-level deflator. This method embodies within-industry price differences in output and productivity measures. Difficulties arise when prices reflect idiosyncratic demand shifts, demographic characteristics or market power variation rather than differences in quality or production efficiency.5
For instance, a firm sheltered from competition because of some regulatory barriers may set high prices and according to a “revenue-based TFP” it may look more efficient than a firm in a more deregulated environment even if their efficiency levels are similar. Since we cannot implement the Foster et al. treatment, firm fixed effects are considered as controls for time-invariant characteristics that may determine firm-level prices.6
We now turn to the endogeneity issue. Estimation of Equation (I.1) by OLS can lead to biased estimates as inputs in the production function are likely to be related to the residuals. Let us decompose the residuals as follows:
ǫisct = ωisct+ uisct (I.2)
Equation (I.2) decomposes firm efficiency into a part that is predictable by the 5
Note that an important advantage of using a revenue-based TFP measures is that if we observe positive effects of competition-related measures on TFP growth, the result is not subject to concerns about markups being conflated, since markups would reduce TFP growth, thus implicitly the efficiency effects must be dominating.
6
Estimates of the main analytical results using firm-level fixed effects are shown in the Annex, Table I.11. These estimates use the balanced panel dataset, where there are sufficient repeated observations to carry them out, and show that the baseline results are robust to firm fixed effects. This estimate also addresses concerns about the use of a Cobb-Douglas production function, if the underlying production function departs from constant returns to scale. In addition, (insignificant) firm size dummies were used in alternative specifications, and these did not affect the results.
10 Import competition, domestic regulation and firm-level productivity growth
firm ωisct, though not observable in the data, and a part due to a productivity shock
that can be forecast neither by the firm nor by the econometrician.
Firms choose their input on the basis of their knowledge of their environment and own efficiency ωisct. Hence, if firms that anticipate high efficiency level hire more
workers and invest more, OLS estimates will be biased upward. The endogeneity of input choices is well known in the literature. Consistent productivity estimates are obtained using the semi-parametric estimation techniques of Olley and Pakes (1996) or Levinsohn and Petrin (2003). These methods correct for simultaneity biases. To carry out such estimations, we need data on investment for the former and intermediate inputs for the latter in order to proxy firm’s private knowledge of its efficiency.
Our preferred TFP estimates are those from the Levinsohn and Petrin (LP) method, which uses information on materials to correct for simultaneity biases. We do not use the Olley and Pakes technique, as their method requires primary information on investment to proxy for unobserved productivity shocks, while prior information on investment is not provided in Amadeus. Although we could create an investment measure using the perpetual inventory equation, we do not follow this path because of a high probability of measurement errors in capital depreciation.
Hence, we compute firm-level TFP by using intermediate inputs m to capture variation in firms’ prediction of their efficiency ω:
ωisct = f (misct, kisct)
Introducing this function into Equation equation:prodfn, we now have:
ln Yisct = αscln lisct+ βscln kisct+ f (misct, kisct) + uisct (I.3)
The variation in inputs is now not related with the error term uisct so that we
have consistent estimates of the parameters. We compute each firm’s TFP as the residual from an estimate of Equation (I.3). At this stage, firms’ TFP values are
Import competition, domestic regulation and firm-level productivity growth 11
not yet comparable across sectors and countries.
Following Pavcnik (2002) and Fernandez (2007), we construct a TFP index to deal with the comparability issue. The TFP index is based on the LP estimates and is constructed in two steps. First, for each 4-digit sector s and country c, we construct a reference hypothetical plant that has mean output and input levels calculated over the whole period. We compute the TFP of this reference plant as:
b
Arefsc = Ysc− bαscLsc− bβscKsc (I.4)
where bαsc and bβsc are the estimates obtained from the regression estimate of
Equation (I.3).
Second, we obtain plant i’s productivity index at time t by subtracting the reference plant productivity Aref from plant i’s productivity as estimated in
Equation (I.4):
Aisct = Yisct− bαscLisct− bβscKisct− bArefsc (I.5)
This index number methodology follows Aw et al. (2001) and Caves and Tretheway (1980). The relative TFP measure obtained ensures comparability across industries and countries.
We then compute firms’ TFP growth rates as the log difference: ∆Aisct =
lnAisct−lnAisct−1. Summary statistics for firm’s TFP growth are shown in Table I.1.
It displays the standard variation, the mean, median, the 10th and 90th percentiles of firm’s TFP growth for each country. It shows that there is a wide variation in ∆Aisct both within and across countries.
2.4
Trade openness
To capture the pro-competitive impact of trade we construct a proxy for foreign competition which is import penetration. Trade data come from the Comtrade database. By combining it with detailed production data from OECD Structural Demographic Business Statistics (SDBS) database, we compute different openness
12 Import competition, domestic regulation and firm-level productivity growth
Table I.1: Summary statistics – Firm TFP growth
Country Standard deviation 10th percentile mean median 90th percentile
All 2.87 -1.24 -.01 .01 1.28 BEL 4.09 -1.76 0 0 1.79 CZE 1.78 -.84 .09 .01 1.03 DEU 10.83 -1.7 .41 0 2.5 DNK 6.72 -.72 .14 .01 1.17 ESP 2.01 -1.01 .01 0 1.04 FIN 2.1 -1.3 .04 .01 1.46 FRA 1.2 -.63 .06 .03 .76 GBR 4.17 -1.64 -.05 -.02 1.53 ITA 2.3 -1.55 .01 .01 1.56 NLD 3.51 -1.83 .14 0 2.54 NOR 2.01 -1.12 .06 .04 1.35 POL 4.32 -1.75 .47 .05 3.13 PRT 2.15 -1.02 .07 .01 1.36 SWE 6.43 -4.16 -.45 -.03 3.4
Source: Authors’ calculations based on Amadeus database. Not resampled dataset.
measures at the 4-digit sectoral level. Import penetration is constructed in the following way for each sector, country and year:
IPsct =
Msct
Qsct+ Msct− Xsct
where Msct is total imports of good s to country c in year t. Qsct is the production
of good s while Xsct is the exports of good s from country c to its trade partners in
year t.
Summary statistics for the import penetration measure across countries are shown in Table I.2. This table displays the median, the 25th and 75th percentiles of import penetration. There is considerable variation in import penetration across country and time, and these differences persist even within narrowly defined sectors.
2.5
Regulation and market structure measures
The primary measure of regulation is the OECD product market regulation indicators of de jure anti-competitive regulations, focusing on the vintages which coincide with the coverage of the Amadeus data. These include the 1998 and
Import competition, domestic regulation and firm-level productivity growth 13
Table I.2: Summary statistics – Import penetration
1996 2005
Country 25th percentile median 75th percentile 25th percentile median 75th percentile
All .17 .43 .75 .23 .55 .87 BEL .36 .7 1.26 .42 .88 1.57 CZE .05 .35 .61 .25 .61 1.02 DEU .02 .2 .64 .2 .41 .87 DNK .32 .59 .86 .4 .76 1.22 ESP .13 .29 .55 .17 .46 .68 FIN .16 .47 .67 .18 .49 .82 FRA .17 .37 .54 .23 .48 .7 GBR .17 .4 .61 .24 .54 .78 GRC .06 .26 .63 .3 .58 .82 ITA .12 .22 .37 .14 .31 .5 NLD .42 .96 1.41 .4 .84 1.73 NOR .36 .62 .82 .3 .62 .91 POL .02 .25 .44 .16 .55 .75 PRT .15 .41 .72 .23 .49 .76 SWE .21 .51 .84 .27 .55 .93
Source: Authors’ calculations based on Comtrade and OECD SDBS databases.
2003 data updates, the settings for which are assumed to be unchanged for the immediately following years, preceeding the most recent 2008 data update. These indicators include both domestic as well as international barriers; only the domestic barriers are used here, specifically the grouping ‘barriers to entrepreneurship’, which covers sub-indicators for administrative burdens on startups, regulatory and administrative opacity and sectoral barriers to competition. Each of the low-level indicators are based on a scoring of regulatory data on a 0 to 6 scale reflecting the extent to which the regulations inhibit competition (see W¨olfl et al., 2009b).
A Herfindahl index of firm concentration at the four-digit level using the Amadeus firm database is used to control for the extent of de facto competition from domestic firms. It is calculated in the standard way, based on the sum of the square revenue market shares of each firm in an industry, so that it ranges between 1/n and 1 where n is the number of firms. The OECD ‘Regimpact’ measure, which assesses the industry-specific knock-on effects of anti-competitive regulation in seven network sectors is also used in robustness checks to control for the extent of upstream
14 Import competition, domestic regulation and firm-level productivity growth
regulation.7
Table I.3 displays some summary statistics for the main measures of domestic competition. Though there has been convergence in these measures over time, a wide variation is still observed across countries.
Table I.3: Summary statistics – Market structure and domestic regulation ‘Barriers to entrepreneurship’ Index
Country Standard deviation 10th percentile mean median 90th percentile
All .6 1.45 2.23 2.39 3.05 BEL .22 1.88 2.16 2.33 2.33 CZE .08 2.09 2.13 2.09 2.27 DEU .24 1.83 2.05 1.83 2.31 DNK .17 1.42 1.52 1.42 1.82 ESP .35 1.63 2.17 2.39 2.39 FIN .49 1.42 2.01 2.41 2.41 FRA .62 1.79 2.55 3.05 3.05 GBR .23 .95 1.29 1.45 1.45 ITA .54 1.58 2.38 2.74 2.74 NLD .13 1.78 1.93 2.05 2.05 NOR .21 1.33 1.45 1.33 1.83 POL .28 3.15 3.42 3.15 3.72 PRT .25 1.57 2.02 2.16 2.16 SWE .48 1.15 1.69 2.11 2.11 Herfindahl Index
Country Standard deviation 10th percentile mean median 90th percentile
All .08 0 .05 .02 .12 BEL .12 .01 .09 .04 .23 CZE .11 .01 .09 .06 .22 DEU .2 .04 .22 .16 .45 DNK .11 .02 .11 .08 .21 ESP .07 0 .03 .01 .07 FIN .13 .02 .11 .06 .25 FRA .07 0 .04 .02 .1 GBR .09 .01 .08 .04 .18 ITA .06 0 .03 .01 .08 NLD .21 .05 .23 .15 .53 NOR .09 0 .05 .03 .09 POL .13 .02 .1 .05 .25 PRT .21 .06 .22 .15 .51 SWE .09 .01 .07 .03 .17
Source: ‘Barriers to entrepreneurship’ is sourced from the OECD Regulatory database. The Herfindahl Index is based on author’s calculations using the Amadeus database.
7
These indicators are calculated using a bottom-up approach in which regulatory data are quantified and aggregated to into summary indicators by sector using weights from I/O tables.
Import competition, domestic regulation and firm-level productivity growth 15
3
Empirical analysis of firm-level productivity
3.1
The effect of competition
Competition may stem from both foreign as well as domestic sources, which we take into account by differentiating the two. Our methodology assumes that increased import shares are equivalent to an increase in competition within a narrowly defined industry and that this increase is exogenous to the productivity growth of an individual firm. Several studies document that increased imports amount to tougher competition: for instance, Katics and Petersen (1994) find that it is associated with reduced price-cost margins using industry-level data for the United States. Recent empirical studies, including Aghion et al. (2009), Bas and Strauss-Kahn (2011), Fernandez (2007) and Pavcnik (2002), use import shares as measures of competition from trade, while Kletzer (2002) discusses assumptions necessary for this approach to be valid. Using a more structural approach, Chen et al. (2009) find that import penetration has a boosting effect on industry average productivity, supporting the pro-competitive effect of trade predicted by the theoretical model of Melitz and Ottaviano (2008).
To capture domestic competition, different measures have been proposed in the literature, such as price-cost margins and concentration indexes. Both measures have substantial flaws. First, they do not allow the effect of foreign competition to be distinguished from the effect of domestic competition. Secondly, while both sources of competition are supposed to put a downward pressure on price-cost margins, it is not clear that higher concentration indexes indicate lower competitive forces. Indeed, pressures from abroad may lead to exit of domestic firms, resulting in a small number of national firms operating, and a more concentrated domestic sector. While we control for concentration, we believe that the two sub-indexes of product market regulation that we use, namely barriers to entrepreneurship and burdens on startups, capture more accurately domestic competitive pressures, as they are direct measures of barriers to market entry.
16 Import competition, domestic regulation and firm-level productivity growth
Aghion et al. (2009) exploit several policy reforms that influenced the competitive environment in Europe, namely the European Single Market Program and industry specific reforms imposed by the Monopolies and Mergers Commission. They claim that those experiments enable them to identify the causal impact of competition on innovation. The perspective of this paper is similar; it makes the most of a country-specific product market regulation (PMR) index that captures various product market reforms that took place in OECD countries between 1998 and 2008. The product market regulation index captures various policies with different treatment intensity across countries and time.
Our empirical analysis highlights that the effect of foreign competition varies with the local stringency of product market regulation. Theoretical predictions on the interaction between trade and product market regulation are ambiguous though. On one hand, PMR and openness can go in the same direction and have a positive additive effect by demanding further productivity improvements. While foreign exposure reduces rents and demand stronger competitiveness to survive, this pro-competitive effect can be higher in countries with stringent regulation protecting incumbents as it creates new incentives to upgrade the production technology. On the other hand, rigidities can impede reallocation, innovation and firm adjustments, reducing the ability to react quickly to new competitive pressures.
3.2
Empirical specification: difference-in-differences
We relate firm-level TFP growth to domestic and foreign competition as well as domestic regulation in the following way:
∆Aisct = β0+ β1IPsct+ β2IPsct× P M Rct+ β3Xisct+ γs+ Dct+ ǫisct (I.6)
where ∆Aisct is the productivity growth of firm i that belongs to sector s and country
c, IPsct is the level of import penetration in sector s for country c in year t, P M Rct
Import competition, domestic regulation and firm-level productivity growth 17
that productivity growth can vary across firms because of sectoral features that have nothing to do with competitive pressures. To avoid any spurious correlation due to industry characteristics, sector fixed effects γs are included. They capture
time-invariant characteristics that, for example, shape the potential for technological upgrading. It is also very likely that TFP growth is influenced by other institutional determinants or policies that do not affect competition. Country-time fixed effects Dct are added to deal with this type of correlation. The country-time fixed effects
also address country macroeconomic shock common to all sectors. Xisct is a set of
control variables that vary across firms and time such as the size of the firm or across sectors s, country c and time t such as the level of concentration or the impact of regulation in services sectors on the manufacturing sector under study.
Equation (I.6) enables us to understand first how firm-level TFP growth depends on foreign competition (β1), and second, how the effect of foreign competition varies
with the regulation of the product market (β2). Since we control for industry
and country-time fixed effects, this specification identifies the effect of foreign competition through differential evolution of the import penetration across industries (industry-time variation).
Models of endogenous growth, considering the existence of technological flows between firms across all countries, dwell on the role played by the pool of highly innovative firms in driving productivity growth of incumbent firms. Productivity growth of followers depends on the productivity growth of the global technological frontier. Adding productivity growth of the frontier firms (top 1 percent in levels), we estimate:
∆Aisct = β0+α∆Af rontst +β1IPsct+β2IPsct×P M Rct+β3Xisct+γs+Dct+ǫisct (I.7)
where ∆Af rontst is the frontier’s productivity growth. We compute the productivity level of the industry-year specific frontier Af rontst by taking the average productivity
18 Import competition, domestic regulation and firm-level productivity growth
which is consistent with our cross-country empirical strategy.8
3.3
The importance of the firm’s distance to the frontier
We allow for a non-monotonic effect of competition according to the heterogeneity of firms. The position on the firm in the productivity distribution is determined specific to its industry, with the right tail of the distribution representing the technological or productivity frontier. Is the positive escape-competition effect conditional on the distance of the firm to its industry frontier? The rationale behind this question is the following: the closer firms are to the frontier, the stronger the escape-competition effect on TFP growth tends to be. In other words, the pro-competitive effect of trade displays a boosting effect for firms with relatively high level of productivity. On the other hand, for laggard firms, an increase of competition due to the entry of foreign products on their market has a depressing effect because they are too far from the frontier to cope with it.
To capture the size of the technology gap among firms in an open-economy setting, we compare each firm’s productivity to the median productivity of the the same sector and year. We then divide firms into two groups: a group of firms that are above the median level of TFP – those closer to the global TFP frontier – and a group of firms that have a TFP level below the median of their industry – who have a larger technological gap. To evaluate the differential impact of foreign competition and product market regulation according to firm heterogeneity in technology gap, we estimate Equations (I.6) and (I.7) separately for the two sub-samples.
3.4
The issue of reverse causality
Foreign competition is proxied by import penetration. It is possible that a bias exists because of reverse causality between firm productivity and trade orientation of the firm’s sector. Foreign firms are able to enter more heavily a market if domestic firms 8
As a robustness check, we also compute the productivity frontier using the average of the top 5% of firms.
Import competition, domestic regulation and firm-level productivity growth 19
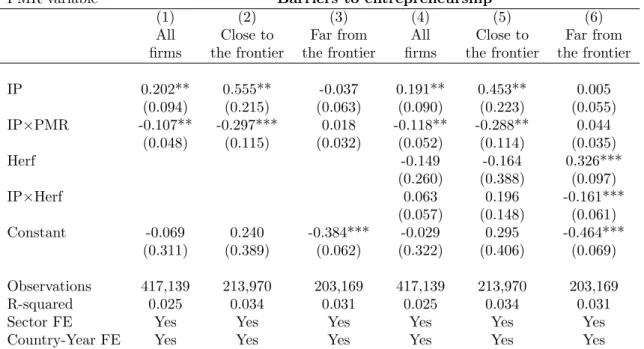
Table I.4: Contemporaneous impact of import penetration and PMR on firms’ TFP growth
Not resampled data set
PMR variable Barriers to entrepreneurship
(1) (2) (3) (4) (5) (6)
All Close to Far from All Close to Far from
firms the frontier the frontier firms the frontier the frontier
IP 0.202** 0.555** -0.037 0.191** 0.453** 0.005 (0.094) (0.215) (0.063) (0.090) (0.223) (0.055) IP×PMR -0.107** -0.297*** 0.018 -0.118** -0.288** 0.044 (0.048) (0.115) (0.032) (0.052) (0.114) (0.035) Herf -0.149 -0.164 0.326*** (0.260) (0.388) (0.097) IP×Herf 0.063 0.196 -0.161*** (0.057) (0.148) (0.061) Constant -0.069 0.240 -0.384*** -0.029 0.295 -0.464*** (0.311) (0.389) (0.062) (0.322) (0.406) (0.069) Observations 417,139 213,970 203,169 417,139 213,970 203,169 R-squared 0.025 0.034 0.031 0.025 0.034 0.031
Sector FE Yes Yes Yes Yes Yes Yes
Country-Year FE Yes Yes Yes Yes Yes Yes
Robust standard errors in parentheses, clustered standard errors by country and sector. *** p<0.01, ** p<0.05, * p<0.1
are not efficient, leaving the competitive advantage to trade partners. This implies a negative correlation between productivity and import shares. However, this relation should be weak in our specification as we regress firm level productivity on sectoral import shares. We also consider that the reverse causality issue is less acute when we look at TFP growth compared to productivity levels. Finally, this could bias us away from finding a productivity-enhancing effect of import competition. In spite of this, our results indicate a positive relationship between productivity growth of the top firms and import penetration, which strengthens our confidence in the findings.
3.5
Interpretation of results
The first set of results of the estimation of Equation equation:estbase are shown in Tables I.4 and I.5, while Tables I.6, I.7 and I.8 provide robustness checks of the same equation. These results are based on the regression of firm-level productivity growth
20 Import competition, domestic regulation and firm-level productivity growth
Table I.5: Lagged impact of import penetration and PMR on firms’ TFP growth Not resampled data set
PMR variable Barriers to entrepreneurship
(1) (2) (3) (4) (5) (6)
All Close to Far from All Close to Far from
firms the frontier the frontier firms the frontier the frontier
IPt−1 0.166* 0.518** -0.039 0.135 0.419* -0.012 (0.100) (0.222) (0.071) (0.096) (0.249) (0.071) IP×PMRt−1 -0.088* -0.281** 0.025 -0.108** -0.268** 0.036 (0.051) (0.118) (0.034) (0.052) (0.120) (0.037) Herft−1 -0.046 0.042 0.314*** (0.230) (0.408) (0.088) IP×Herft−1 0.142** 0.168 -0.089 (0.057) (0.142) (0.068) Constant 0.380 0.908 -0.428*** 0.408 0.907 -0.489*** (0.731) (0.942) (0.088) (0.731) (0.940) (0.093) Observations 454,375 233,529 220,846 454,375 233,529 220,846 R-squared 0.022 0.030 0.033 0.022 0.030 0.033
Sector FE Yes Yes Yes Yes Yes Yes
Country-Year FE Yes Yes Yes Yes Yes Yes
Robust standard errors in parentheses, clustered standard errors by country and sector. *** p<0.01, ** p<0.05, * p<0.1
on import penetration (IP ) and the interaction between import penetration and domestic regulation (IP × P M R). Import penetration at the sectoral level (IP ) is used to proxy foreign competition pressures, while the ‘barriers to entrepreneurship’
index is used to measure the stringency of domestic regulation (P M R). The
same equations are also estimated with the control variables. The first set of results, Tables I.4 through I.7, use the ‘barriers to entrepreneurship’ index (P M R) contemporaneously and with lags, both with the default dataset (Tables I.4 and I.5) and the resampled dataset (Tables I.6 and I.7).
Overall, the results, which split the sample by distance to frontier, are highly consistent with our hypotheses, and are robust across specifications, including those that account for potential reverse causality (using lagged values of IP ) and potential sampling bias (on the resampled dataset).
Changes in firm productivity are impacted by both the domestic institutional
Import competition, domestic regulation and firm-level productivity growth 21
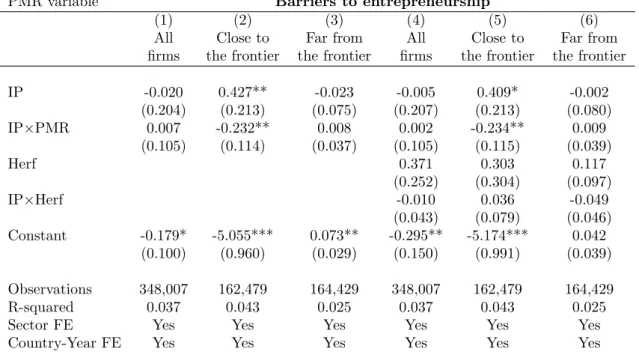
Table I.6: Contemporaneous impact of import penetration and PMR on firms’ TFP growth
Resampled data set
PMR variable Barriers to entrepreneurship
(1) (2) (3) (4) (5) (6)
All Close to Far from All Close to Far from
firms the frontier the frontier firms the frontier the frontier
IP -0.020 0.427** -0.023 -0.005 0.409* -0.002 (0.204) (0.213) (0.075) (0.207) (0.213) (0.080) IP×PMR 0.007 -0.232** 0.008 0.002 -0.234** 0.009 (0.105) (0.114) (0.037) (0.105) (0.115) (0.039) Herf 0.371 0.303 0.117 (0.252) (0.304) (0.097) IP×Herf -0.010 0.036 -0.049 (0.043) (0.079) (0.046) Constant -0.179* -5.055*** 0.073** -0.295** -5.174*** 0.042 (0.100) (0.960) (0.029) (0.150) (0.991) (0.039) Observations 348,007 162,479 164,429 348,007 162,479 164,429 R-squared 0.037 0.043 0.025 0.037 0.043 0.025
Sector FE Yes Yes Yes Yes Yes Yes
Country-Year FE Yes Yes Yes Yes Yes Yes
Robust standard errors in parentheses, clustered standard errors by country and sector. *** p<0.01, ** p<0.05, * p<0.1
responses to foreign competition are heterogeneous, even within narrowly defined sectors. The evolution of firm TFP growth depends remarkably on its position in the distribution of firm efficiency. Firms that are technologically advanced benefit from competitive pressure of foreign firms’ entry into their domestic markets. This “escape competition effect” is only present for the most competitive firms, with foreign competition generally having no significant impact on firms that are at the bottom of the efficiency distribution.
The positive pro-competitive effect of trade on advanced firms has a different magnitude according to the extent of product market regulation in the country. The negative coefficient on the interaction term indicates that trade becomes more beneficial as market regulation becomes less stringent. The ‘barriers to entrepreneur-ship’ PMR index is used in the estimates shown in Tables I.4 through I.7, which reflects anti-competitive measures such as entry barriers and administrative burdens
22 Import competition, domestic regulation and firm-level productivity growth
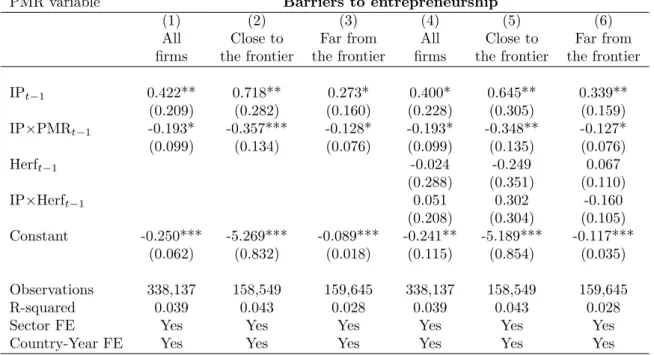
Table I.7: Lagged impact of import penetration and PMR on firms’ TFP growth Resampled data set
PMR variable Barriers to entrepreneurship
(1) (2) (3) (4) (5) (6)
All Close to Far from All Close to Far from
firms the frontier the frontier firms the frontier the frontier
IPt−1 0.422** 0.718** 0.273* 0.400* 0.645** 0.339** (0.209) (0.282) (0.160) (0.228) (0.305) (0.159) IP×PMRt−1 -0.193* -0.357*** -0.128* -0.193* -0.348** -0.127* (0.099) (0.134) (0.076) (0.099) (0.135) (0.076) Herft−1 -0.024 -0.249 0.067 (0.288) (0.351) (0.110) IP×Herft−1 0.051 0.302 -0.160 (0.208) (0.304) (0.105) Constant -0.250*** -5.269*** -0.089*** -0.241** -5.189*** -0.117*** (0.062) (0.832) (0.018) (0.115) (0.854) (0.035) Observations 338,137 158,549 159,645 338,137 158,549 159,645 R-squared 0.039 0.043 0.028 0.039 0.043 0.028
Sector FE Yes Yes Yes Yes Yes Yes
Country-Year FE Yes Yes Yes Yes Yes Yes
Robust standard errors in parentheses, clustered standard errors by country and sector. *** p<0.01, ** p<0.05, * p<0.1
Table I.8: The impact of import penetration and PMR on firms’ TFP growth Not resampled data set
PMR variable Burdens on startups
(1) (2) (3) (4) (5) (6)
All Close to Far from All Close to Far from
firms the frontier the frontier firms the frontier the frontier
IP 0.075 0.189*** -0.039* 0.181** 0.122 0.071 (0.050) (0.073) (0.023) (0.072) (0.113) (0.070) IP×PMR -0.055* -0.117*** 0.032* -0.079*** -0.113** 0.012 (0.029) (0.044) (0.019) (0.029) (0.044) (0.025) Herf -0.121 -0.035 0.422*** (0.260) (0.277) (0.101) IP×Herf -0.141 0.130 -0.145* (0.086) (0.159) (0.078) Constant -0.042 -0.614 -0.481*** -0.017 -0.597 -0.561*** (0.309) (0.470) (0.109) (0.323) (0.475) (0.104) Observations 417,389 237,355 160,651 417,389 237,355 160,651 R-squared 0.025 0.046 0.035 0.025 0.046 0.035
Sector FE Yes Yes Yes Yes Yes Yes
Country-Year FE Yes Yes Yes Yes Yes Yes
Robust standard errors in parentheses, clustered standard errors by country and sector. *** p<0.01, ** p<0.05, * p<0.1
Import competition, domestic regulation and firm-level productivity growth 23
that inhibit competition across sectors.
To more clearly delineate the effects of the measures, the ‘burdens on startups’
sub-indicator is used in Table I.8. This indicator focuses more clearly on
administrative burdens for new firms, including sector-specific burdens. Using this index, these results yield coefficient estimates that are qualitatively very similar to the estimates with the broader PMR ‘barriers to entrepreneurship’ index shown in the previous tables. The other two PMR sub-indicators of this index, ‘regulatory and administrative opacity’ and ‘barriers to competition’, show less significance.
Domestic competition may also vary within a country, across sectors. This may have an effect on firms’ incentives to upgrade their technology. The level of competition within a sector can be proxied by the concentration level within a sector.9
In concentrated sectors, firms are not forced to reduce prices and can make positive profits more easily. Hence low productivity firms can survive. Our analysis suggests that the concentration level has a different impact on more advanced versus laggard firms, based on the raw dataset (Tables I.4 and I.5). While high concentration seems to allow less efficient firms to perform well, it is not a condition for high productivity firms whose TFP growth rates are not significantly affected by the concentration level. Such a concentration index is however an imperfect measure of competition as it does not capture the existence of entry threats. Moreover it focuses on a geographically limited definition of competition while European manufacturing sectors are open and some firms operate in international markets. Our favored measure of competition is the product market regulation index, as it can proxy unobservable entry threats as well as the existing regulatory scope that can be used to adjust to changes in market structure.
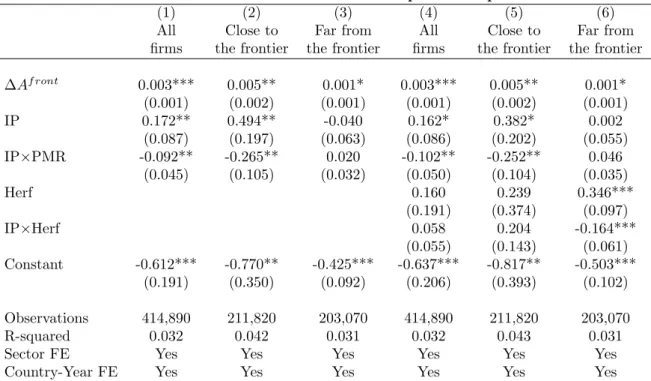
These results are robust to a number of alternative specifications, such as inclusion of the growth of the productivity frontier (Table I.9, using Equation (I.7)) 9
We also use the Regimpact regulatory impact index to help control for pressures that may affect costs. Regimpact can control for the cost structure of intermediate inputs coming from upstream sectors. Robustness checks were run with all of the estimated equations, and the inclusion of
Regimpact in the equations does not affect the interpretation of the estimates. Firms that are closer to the frontier are found to cope more easily with high regulation in upstream services sectors, and it has a damping effect on firms farther from the frontier.
24 Import competition, domestic regulation and firm-level productivity growth
Table I.9: The impact of IP and PMR on firms’ TFP growth, with frontier TFP growth
Not resampled data set
PMR variable Barriers to entrepreneurship
(1) (2) (3) (4) (5) (6)
All Close to Far from All Close to Far from
firms the frontier the frontier firms the frontier the frontier
∆Af ront 0.003*** 0.005** 0.001* 0.003*** 0.005** 0.001* (0.001) (0.002) (0.001) (0.001) (0.002) (0.001) IP 0.172** 0.494** -0.040 0.162* 0.382* 0.002 (0.087) (0.197) (0.063) (0.086) (0.202) (0.055) IP×PMR -0.092** -0.265** 0.020 -0.102** -0.252** 0.046 (0.045) (0.105) (0.032) (0.050) (0.104) (0.035) Herf 0.160 0.239 0.346*** (0.191) (0.374) (0.097) IP×Herf 0.058 0.204 -0.164*** (0.055) (0.143) (0.061) Constant -0.612*** -0.770** -0.425*** -0.637*** -0.817** -0.503*** (0.191) (0.350) (0.092) (0.206) (0.393) (0.102) Observations 414,890 211,820 203,070 414,890 211,820 203,070 R-squared 0.032 0.042 0.031 0.032 0.043 0.031
Sector FE Yes Yes Yes Yes Yes Yes
Country-Year FE Yes Yes Yes Yes Yes Yes
Robust standard errors in parentheses, clustered standard errors by country and sector. *** p<0.01, ** p<0.05, * p<0.1
or the restriction of the sample to only surviving firms (Table I.10). While these changes in specification have a slight impact on the results, they remain the same in sign, significance and roughly the same in magnitude, in these contemporaneous results. We have also checked for the inclusion of other controls at the firm level, such as an indicator of exit during the period, the size of the firm, which has no discernible effect on the main results.
Inclusion of the direct effect of product market regulation has a somewhat larger effect on the results, which was expected as we include country fixed effect and year fixed effect separately to estimate the impact of country-wide PMR. Yet the results on our variables of principal interest, import penetration and its interaction with PMR remain qualitatively similar.
Import competition, domestic regulation and firm-level productivity growth 25
Table I.10: The impact of IP and PMR on surviving firms’ TFP growth Not resampled, balanced data set
PMR variable Barriers to entrepreneurship
(1) (2) (3) (4) (5) (6)
All Close to Far from All Close to Far from
firms the frontier the frontier firms the frontier the frontier
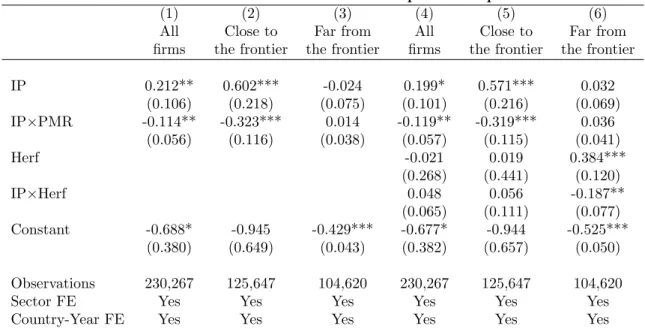
IP 0.212** 0.602*** -0.024 0.199* 0.571*** 0.032 (0.106) (0.218) (0.075) (0.101) (0.216) (0.069) IP×PMR -0.114** -0.323*** 0.014 -0.119** -0.319*** 0.036 (0.056) (0.116) (0.038) (0.057) (0.115) (0.041) Herf -0.021 0.019 0.384*** (0.268) (0.441) (0.120) IP×Herf 0.048 0.056 -0.187** (0.065) (0.111) (0.077) Constant -0.688* -0.945 -0.429*** -0.677* -0.944 -0.525*** (0.380) (0.649) (0.043) (0.382) (0.657) (0.050) Observations 230,267 125,647 104,620 230,267 125,647 104,620
Sector FE Yes Yes Yes Yes Yes Yes
Country-Year FE Yes Yes Yes Yes Yes Yes
Robust standard errors in parentheses, clustered standard errors by country and sector. *** p<0.01, ** p<0.05, * p<0.1
3.6
Effects on productivity
What is the economic significance of the results just discussed? Taking our preferred equation estimates from Table I.4, the effects of changes in import penetration and product market reform can be simulated for within-firm productivity growth, among the relatively large firms in our dataset. Given the difference-in-differences specification of the estimation equation, we therefore focus on conditional shocks. A qualitative visualization of these simulations is shown in Figure I.1.
Increases in import penetration (IP ) only boost firm TFP growth if PMR is sufficiently low, below a certain threshold (Figure I.1, Panel A) equivalent to the median PMR setting at the end of the period studied. If PMR is higher than this threshold, an increase in IP (i.e. international competition) has a perverse impact on TFP, leading to negative TFP growth through discouragement. This effect arises from an even larger-magnitude effect on the firms in the upper half of the productivity distribution (Panel B). To take a particular example, for firms
26 Import competition, domestic regulation and firm-level productivity growth
Figure I.1: Estimated within-firm TFP growth effects under conditional IP and PMR shocks 0 .05 .1 .15 .2 IP-shock 0 1 2 3 4 PMR -.04 -.02 0 .02 .04 TFP
(a) Import penetration shocks: All firms
0 .05 .1 .15 .2 IP-shock 0 1 2 3 4 PMR -.15 -.1 -.05 0 .05 .1 TFP
(b) IP shocks: Top firms
0 .2 .4 .6 PMR-reform 0 .2 .4 .6 .8 1 IP 0 .02 .04 .06 TFP
(c) Product market reform shocks: All firms
0 .2 .4 .6 PMR-reform 0 .2 .4 .6 .8 1 IP 0 .05 .1 .15 .2 TFP
(d) PMR shocks: Top firms Source: Simulations based on equation estimates from Table I.4, columns 2 and 3.
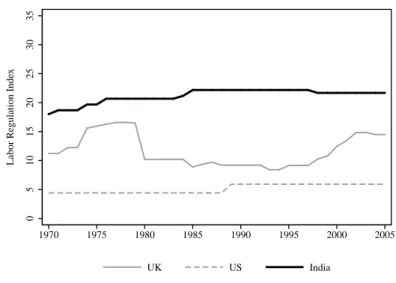
in the United Kingdom, the country with the lowest PMR, an increase in import penetration of 10 percentage points would raise firm TFP growth by approximately 1.0% per year on average, or 2.7% for the firms in the upper half of the productivity distribution. Yet for countries (primarily in earlier time periods) with higher PMR settings, the effect is essentially reversed.
A similar simulation can be carried out for a range of PMR reforms taking varying levels of import penetration as given (Figure I.1, Panels C and D). Product market regulatory reforms unambiguously boost productivity growth; however, their effects are magnified considerably when import penetration is higher. For instance, a PMR reform of 10% of the median setting would boost within-firm productivity growth
Import competition, domestic regulation and firm-level productivity growth 27
by 0.5% in a sector at the 25th percentile of import penetration, and by 2.3% in a sector at the 75th percentile. Again, the impact is driven by firms in the upper half of the productivity distribution, where productivity growth is boosted by 1.4% and 6.3%, respectively. For firms in the lower half of the productivity distribution, the impact of PMR reform through this channel is negligible. Countries with a large share of high-productivity firms will thus benefit much more from PMR reforms.
4
Conclusion
This paper offers a new assessment of the effect of import penetration on firm-level productivity growth, taking into account heterogeneity in distance to the technological frontier and country differences in product market regulation. Our results show that firms in sectors with higher import penetration have higher TFP growth only if the firms are close to their sectoral technology frontier. Only the most productive firms enjoy an increase in productivity when foreign competitors’ pressure is high. This result illustrates that in order to understand firms’ TFP growth, it is important to combine explanations based on the pro-competitive effect of trade with a “Schumpeterian” distance-to-the-frontier mechanism, an area that theoretical trade models have overlooked to date.
The pro-competitive effect of international trade depends on domestic product market regulation as measured by the OECD’s Product Market Regulation (PMR) index. Our results indicate that, at the top of the productivity distribution, the positive effect of foreign competition is inhibited for firms operating in a country with stringent regulation such as higher barriers to entry. Domestic and foreign competitive pressures are found to be complementarity: firms’ incentives or abilities to improve their productivity to cope with foreign competition are stronger in countries with lower levels of PMR. As for firms at the bottom of the productivity distribution, foreign competition does not have a significant within-firm benefit on
28 Import competition, domestic regulation and firm-level productivity growth
their efficiency – irrespective of the regulatory environment – though it may faciliate their demise, whereby they relinquish their market share to more productive firms. Future work in this area could go beyond this paper in a number of respects. First, if firm-level trade information were available in a multi-country dataset, both the extensive and intensive margins could be examined, since their impact on competition likely differs. Second, instrumentation of import penetration would make the results for the measure more robust. Third, once a longer time series of domestic regulation indicators is available, further analysis would be worthwhile.
Import competition, domestic regulation and firm-level productivity growth 29
5
Annex
Table I.11: The impact of IP and PMR on surviving firms’ TFP growth With firm fixed effects – Not resampled, balanced data set
PMR variable Barriers to entrepreneurship
(1) (2) (3) (4) (5) (6)
All Close to Far from All Close to Far from
firms the frontier the frontier firms the frontier the frontier
IP 0.310** 0.567* 0.094 0.306** 0.513* 0.100* (0.131) (0.312) (0.063) (0.130) (0.311) (0.059) IP×PMR -0.168** -0.307* -0.052 -0.190** -0.312* -0.021 (0.069) (0.166) (0.033) (0.080) (0.168) (0.047) Herf -0.070 0.165 0.050 (0.443) (0.835) (0.112) IP×Herf 0.096 0.149 -0.121* (0.086) (0.153) (0.070) Constant 0.102*** 0.353*** -0.139*** 0.120*** 0.358*** -0.162*** (0.023) (0.046) (0.012) (0.036) (0.062) (0.019) Observations 230,708 125,978 104,730 230,708 125,978 104,730 R-squared 0.036 0.046 0.006 0.036 0.046 0.006 Number of IDs 34,071 25,210 22,054 34,071 25,210 22,054
Firm FE YES YES YES YES YES YES
Country-Year FE YES YES YES YES YES YES
Robust standard errors in parentheses, clustered standard errors by country and sector. *** p<0.01, ** p<0.05, * p<0.1
Chapter II
Labor market regulation and
plant-level productivity in India
1
1
Introduction
It is well known that India’s formal Employment Protection Legislation (EPL)
is among the most stringent in the world. Many believe that this is one of
the main reasons behind the stagnant share of manufacturing output in India’s GDP during the last 40 years (OECD, 2007). Although the country has recorded impressive output growth rates since the 1970s, the share of manufactures in total output has remained between 14% and 18%. Though infrastructure and product market regulation have been major challenges, strict labor laws have been blamed in particular for the poor performance of large-scale labor intensive manufactures despite India’s labor abundance (Panagariya, 2003; Conway and Herd, 2009; Dougherty et al., 2009). According to the MCI (2011), the top five goods exported during 2010-11 represented almost 50% of the country’s total exports and they were all relatively capital intensive goods such as petroleum products, gems and jewelry, transport equipment, machinery and instruments, and pharmaceutical products. In contrast, ready-made garments, traditionally an unskilled-labor intensive export, has seen its share in total Indian exports decline from 12.5% to 6% between 2000 1
This chapter is a revised version of NBER working paper No. 17693 and OECD Economics Department working paper No. 917 (2011), “Employment Protection Legislation and Plant-Level Productivity in India,” jointly written with Ver´onica Frisancho Robles (IDB) and Kala Krishna (Penn State).
32 Labor market regulation and plant-level productivity
and 2010. In 2010, India was the fifth largest exporter of apparel, with 3.2% of the world’s exports (WTO, 2011).
Industrial relations in India fall under the joint jurisdiction of central and state governments, an arrangement that has generated a degree of variation in labor regulations across states. Although all states had essentially the same starting point under the License Raj, each state has independently amended labor regulations, rules and practices during the post-Independence period. In the last decade, this “natural experiment” setting has been exploited by several empirical studies that have tried to assess the effects of labor regulation on output, employment, and productivity. However, and despite increasing interest in the topic, the evidence for India is still inconclusive and mostly limited to industry-level analysis.
One of the most influential studies of India is Besley and Burgess (2004), which constructs an index summarizing state-level amendments to the Industrial Disputes Act (IDA) between 1949 and 1992. The index, henceforth referred to as BB, is used along with several control variables to explain state-level outcomes corresponding to the organized manufacturing sector using industry-level panel data for 1958-92. The authors identify a negative impact of pro-worker regulation on output, investment, employment, and labor productivity among registered manufacturing firms. Several papers that also rely on the BB index reach similar conclusions.2
Nonetheless, the validity of the BB index and the econometric methodology used to identify the effect of excessive pro-worker regulation have been extensively criticized. The main concerns with the use of this index are related to problems in the coding of labor laws and its exclusive focus on formal reforms to the IDA. This study tries to overcome the shortcomings of the previous empirical evidence in the tradition of Besley and Burgess to evaluate the effect of labor regulation on the Indian organized manufacturing sector. We make use of a more comprehensive measure of labor market regulations proposed in OECD (2007) and elaborated in Dougherty (2009). We argue that this index is superior to the BB index as it includes 2