HAL Id: cea-00881166
https://hal-cea.archives-ouvertes.fr/cea-00881166
Submitted on 13 Nov 2020HAL is a multi-disciplinary open access archive for the deposit and dissemination of sci-entific research documents, whether they are pub-lished or not. The documents may come from teaching and research institutions in France or abroad, or from public or private research centers.
L’archive ouverte pluridisciplinaire HAL, est destinée au dépôt et à la diffusion de documents scientifiques de niveau recherche, publiés ou non, émanant des établissements d’enseignement et de recherche français ou étrangers, des laboratoires publics ou privés.
The intense starburst HDF 850.1 in a galaxy overdensity
at z
≈ 5.2 in the Hubble Deep Field
Fabian Walter, Roberto Decarli, Chris Carilli, Frank Bertoldi, Pierre Cox,
Elisabete da Cunha, Emanuele Daddi, Mark Dickinson, Dennis Downes,
David Elbaz, et al.
To cite this version:
Fabian Walter, Roberto Decarli, Chris Carilli, Frank Bertoldi, Pierre Cox, et al.. The intense starburst HDF 850.1 in a galaxy overdensity at z ≈ 5.2 in the Hubble Deep Field. Nature, Nature Publishing Group, 2012, 486 (7402), pp.233-236. �10.1038/nature11073�. �cea-00881166�
The Intense Starburst HDF850.1 in a Galaxy Overdensity at z=5.2 in
the Hubble Deep Field
Fabian Walter1,2, Roberto Decarli1, Chris Carilli2,3, Frank Bertoldi4, Pierre Cox5, Elisabete Da Cunha1, Emanuele Daddi6, Mark Dickinson7, Dennis Downes5, David Elbaz6, Richard Ellis8, Jacqueline Hodge1, Roberto Neri5, Dominik Riechers8, Axel Weiss9, Eric Bell10, Helmut Dannerbauer11, Melanie Krips5, Mark Krumholz12, Lindley Lentati3, Roberto Maiolino13, Karl Menten9, Hans-Walter Rix1, Brant Robertson14, Hyron Spinrad15, Dan Stark14, Daniel Stern16
1
Max-Planck Institut für Astronomie, Königstuhl 17, D-69117, Heidelberg, Germany. 2
National Radio Astronomy Observatory, Pete V. Domenici Array Science Center, P.O. Box O, Socorro, NM, 87801, USA.
3
Cavendish Laboratory, J J Thomson Avenue, Cambridge University, Cambridge CB3 0HE, UK 4
Argelander Institute for Astronomy, University of Bonn, Auf dem Hügel 71, 53121 Bonn, Germany.
5
IRAM, 300 rue de la piscine, F-38406 Saint-Martin d'Hères, France. 6
Laboratoire AIM, CEA/DSM-CNRS-Université Paris Diderot, Irfu/Service d'Astrophysique, CEA Saclay, Orme des Merisiers, 91191 Gif-sur-Yvette Cedex, France.
7
National Optical Astronomy Observatory, 950 North Cherry Avenue, Tucson, AZ 85719, USA. 8
Astronomy Department, California Institute of Technology, MC105-24, Pasadena, CA 91125, USA.
9
Max-Planck-Institut für Radioastronomie, Auf dem Hügel 69, 53121 Bonn, Germany. 10
Department of Astronomy, University of Michigan, 500 Church Street, Ann Arbor, MI 48109, USA.
11
Universität Wien, Institut für Astronomie, Türkenschanzstraße 17, 1080 Wien, Austria 12
Department of Astronomy and Astrophysics, University of California, Santa Cruz, CA 95064, USA.
13
INAF-Osservatorio Astronomico di Roma, via di Frascati 33, 00040 Monte Porzio Catone, Italy.
14
Department of Astronomy, University of Arizona, 933 North Cherry Avenue, Tucson, AZ 85721, USA.
15
Department of Astronomy, University of California at Berkeley, Berkeley, CA 94720, USA. 16
Jet Propulsion Laboratory, California Institute of Technology, 4800 Oak Grove Drive, Pasadena, CA 91109, USA.
The Hubble Deep Field (HDF) is a region in the sky that provides one of the deepest multi-wavelength views of the distant universe and has led to the
detection of thousands of galaxies seen throughout cosmic time1. An early map of the HDF at a wavelength of 850 microns that is sensitive to dust emission powered by star formation revealed the brightest source in the field, dubbed HDF850.12. For more than a decade, this source remained elusive and, despite significant efforts, no counterpart at shorter wavelengths, and thus no redshift, size or mass, could be identified3-7. Here we report, using a millimeter wave molecular line scan, an unambiguous redshift determination for HDF850.1 of z=5.183. This places HDF850.1 in a galaxy overdensity at z~5.2 in the HDF,
corresponding to a cosmic age of only 1.1 Gyr after the Big Bang. This redshift is significantly higher than earlier estimates3,4,6,8 and higher than most of the >100 sub-millimeter bright galaxies identified to date. The source has a star formation rate of 850Msun yr-1 and is spatially resolved on scales of 5 kpc, with an implied
dynamical mass of ~1.3x10¹¹ Msun, a significant fraction of which is present in the
form of molecular gas. Despite our accurate redshift and position, a counterpart arising from starlight remains elusive.
We have obtained a full frequency scan of the 3 mm band towards the HDF using the IRAM Plateau de Bure Interferometer (PdBI). The observations covered the frequency range from 80-115 GHz in 10 frequency settings at uniform sensitivity and at a
resolution (~2.3”) that is a good match to galaxy sizes at high redshift. They resulted in the detection of two lines of Carbon Monoxide (CO), the most common tracer for molecular gas at high redshift9, at 93.20 GHz and 111.84 GHz at the position of
HDF850.1. Identifying these lines with the J=5 and J=6 rotational transitions of CO gives a redshift for HDF850.1 of z=5.183. This redshift was then unambiguously confirmed by the PdBI detection of the 158 μm line of ionized carbon ([CII], redshifted to 307.38 GHz), one of the main cooling lines of the star-forming interstellar medium. Stacking of other molecules covered by our frequency scan that trace higher volume densities did not lead to a detection (see Supplementary Information). Subsequently, the J=2 line of CO has also been detected using the NRAO Jansky Very Large Array (Jansky VLA) at 37.29 GHz. The observed [CII] and CO spectra towards HDF850.1 are shown in Fig. 1. The beamsize of our CO observations (~2.3”, 15 kpc at z=5.183) is too large to spatially resolve the molecular gas emission in HDF850.1. However the [CII] and underlying continuum observations (~1.2” x 0.8”) show that the source is extended (hitherto, the interstellar medium has been spatially resolved only in extremely rare quasar host galaxies at such high redshift10). A single Gaussian fit yields a deconvolved size of 0.9±0.3”, or 5.7±1.9 kpc at the redshift of the source. Fig. 2 shows the maps of total [CII] emission (left) as well as the red- and blue-shifted parts of the [CII] line (right)
superposed on the deepest available Hubble Space Telescope (HST) images of the HDF1. The derived dynamical mass is Mdyn~1.3±0.4 x 10¹¹ Msun assuming an arbitrary
inclination of 30 degrees. An alternative interpretation is that the source is a merger of two galaxies, rather than a single rotating disk, which would lower the implied dynamical
mass. Fig. 2 shows that the source is completely obscured in the observed optical and near-infrared wavebands (i.e. the rest-frame UV). There is no indication of HDF850.1 harboring an active galactic nucleus powered by a supermassive black hole (quasar)11. The CO(6-5)/CO(2-1) line luminosity ratio (in units of K km s-1 pc2)9 is 0.23±0.05.
Assuming that the gas is being emitted from the same volume, this implies that the high-J CO emission is sub-thermally excited on galactic scales, less than seen in the nuclei of local starburst galaxies12. Using a standard large velocity gradient (LVG) model we find that the observed CO line intensities can be fit with a moderate molecular hydrogen density of 103.2 cm-3 and a kinetic temperature of 45 K for virialized clouds (dv/dr=1.2 km s-1 pc-1). We caution though that these numbers would change if the CO transitions were not emitted from the same volume. The predicted CO(1-0) line luminosity is 4.3 x 10¹⁰ K km s-1 pc2, close to the measured value for CO(2-1). Depending on the choice of α, the CO-to-H2 conversion factor, this line luminosity implies a molecular gas mass of MH2 =
3.5 x (α/0.8) x 1010 Msun; here α=0.8, in units of Msun (K km s-1 pc2)-1, is the conversion
factor adopted for ultra-luminous infrared galaxies (ULIRGs)13 and thought to be
applicable to sub-millimeter bright objects14. The implied molecular gas mass fraction is MH2/Mdyn ~ 0.25±0.08 (α/0.8); i.e. even with a low ULIRG conversion factor the
molecular gas constitutes a significant fraction of the overall dynamical mass. This molecular gas mass (and fraction) is comparable to what is found in other sub-millimeter bright galaxies that are typically located at much lower redshift14,15.
The line-free channels of the observations (Fig. 1) were used to constrain the underlying continuum emission. Our accurate position of the rest-frame 158 μm emission is
indicated as a cross in Fig. 2 (right). We combine our continuum detections at 307 GHz and 112 GHz with published values and new Herschel Space Telescope observations to constrain the far-infrared (FIR) properties of the source (see Supplementary Information for details). Our best fit gives a FIR luminosity of LFIR=6.5±1 x 10¹² Lsun, a dust
temperature of 35±5 K (i.e., broadly consistent with the average kinetic temperature of the molecular gas), a dust mass of Mdust = 2.75±0.5 x 10⁸ Msun and a star formation rate
of 850 Msun yr
-1 (with an uncertainty of ~30%). Given the extent of the source this results
in an galaxy-averaged star formation rate surface density of 850 Msun yr-1 / (π x (2.8
kpc)2) ~ 35 Msun yr-1 kpc-2 (uncertainty ~50%), more than an order of magnitude less
than found in nearby merging systems and a compact quasar host galaxy at z=6.42 that has been studied in similar detail10. HDF850.1 falls on the universal local star formation law that relates the average surface density of the star formation rate to that of the molecular gas mass per local free-fall time16. The estimated surface density would increase if future observations resolved the source structure.
The resulting [CII]/FIR luminosity ratio of L[CII]/LFIR = 1.7 ± 0.5 x 10⁻³ in HDF850.1 is
comparable to what is found in normal local star-forming galaxies17, but is an order of magnitude higher than what is found in a z=6.42 quasar10, the only other high-z system where the [CII] emission could be resolved to date. Recent studies indicate that this ratio is a function of environment, with a low value (L[CII]/LFIR ~ 1 x 10⁻⁴) for luminous
systems dominated by a central black hole (quasars) and a high ratio (up to L[CII]/LFIR ~ 1
x 10-2) for low-metallicity environments. Our relatively high ratio in L[CII]/LFIR is consistent
with HDF850.1 being a high redshift star-forming system in a non-quasar environment17. An inspection of the distribution of galaxies towards HDF850.1 that have spectroscopic redshifts shows that there is an overdensity of galaxies at the exact redshift of
HDF850.1, including a quasar at z=5.18618 (Fig. 3 and Supplementary Information). This makes this region one of the most distant galaxy overdensities known to date19. An elliptical galaxy at z=1.22420 that is situated close to HDF850.1 in projection (~1” to the NE) could potentially act as a gravitational lens for this source3,4,21. Using a velocity dispersion of 146 km s-1 in a singular isothermal sphere for this elliptical galaxy4 and our new redshift and position of HDF850.1, we derive an amplification factor of ~1.4. A similar flux amplification is found for a simple point source lens model with mass 3.5 x 10¹¹ Msun. This implies that even if lensing is occurring, the quantities derived here
would not need to be revised significantly.
HDF850.1 remains outstanding in the study of dust-obscured starbursts at high redshift, being one of the first such sources discovered, and yet evading detection in the optical and near-infrared. Its redshift of z=5.183 enforces the presence of a high redshift tail (z>4) of sub-millimeter bright star-forming (non-AGN/quasar) galaxies (currently there are only about half a dozen systems known)22-26. Only a small fraction of sub-millimeter bright sources is expected to be at very high redshift27 --- it is thus ironic that the first blank-field source belongs to this subgroup. HDF850.1’s large spatial extent, in combination with the modest CO excitation, a moderate surface density of its star formation rate, and a high [CII]/FIR luminosity ratio all point to the presence of a
spatially extended major starburst that is completely obscured even in the deepest HST images available for the HDF. The absence of a possible counterpart in the available deep imaging, even though the star-forming interstellar medium is distributed over many square kpc, makes this source extreme22-24. Given its high molecular gas mass (3.5 x (α/0.8) x 1010 Msun) and star formation rate (850 Msun yr
-1
) HDF850.1 can build a
significant stellar component as early as z~428 (~few hundred Myr from z~5). Blind line searches through spectral scans at millimeter wavelengths as performed herethus play a fundamental role in unveiling the nature of star-forming galaxies that are completely obscured in the (restframe) optical and UV even if multi-wavelength data at unparalleled depth are available.
References
1. Williams, R.E. et al., The Hubble Deep Field: Observations, Data Reduction, and Galaxy Photometry, Astron. J. 112, 1335-1389 (1996)
2. Hughes, D.H. et al., A Submillimetre Survey of the Hubble Deep Field: Unveiling Dust-Enshrouded Star Formation in the Early Universe, Nature 394, 241-247 (1998) 3. Downes, D. et al., Proposed identification of Hubble Deep Field submillimeter source
HDF 850.1, Astron. Astroph. 347, 809-820 (1999)
4. Dunlop, J.S. et al., Discovery of the galaxy counterpart of HDF 850.1, the brightest submillimetre source in the Hubble Deep Field, MNRAS 350, 768-784 (2004) 5. Wagg, J. et al., A broad-band spectroscopic search for CO line emission in
HDF850.1: the brightest submillimetre object in the Hubble Deep Field-North,
MNRAS 375, 745-752 (2007)
6. Cowie, L.L., Barger, A.J., Wang, W.-H., Williams, J.P., An Accurate Position for HDF 850.1: The Brightest Submillimeter Source in the Hubble Deep Field-North, Astroph.
J. Letter 697, 122-126 (2009)
7. Carilli, C.L., Yun, M.S., The Radio-to-Submillimeter Spectral Index as a Redshift Indicator, Astroph. J. Letter 513, 13-16 (1999)
8. Richards, E.A., Radio Identification of Submillimeter Sources in the Hubble Deep Field, Astroph. J. Letter 513, 9-12 (1999)
9. Solomon, P.M., Vanden Bout, P.A., Molecular Gas at High Redshift, ARA&A 43, 677-725 (2005)
10. Walter, F. et al., A kiloparsec-scale hyper-starburst in a quasar host less than 1 Gigayear after the Big Bang, Nature, 457, 699-701 (2009)
11. Alexander, D. et al., The Chandra Deep Field North Survey. XIII. 2 Ms Point-Source Catalogs, Astron. J. 126, 539-574 (2003)
12. Loenen, A.F. et al., Excitation of the molecular gas in the nuclear region of M 82,
Astron. Astroph. Letter 521, 2 (2010)
13. Downes, D., Solomon, P.M., Rotating Nuclear Rings and Extreme Starbursts in Ultraluminous Galaxies, Astroph. J., 507, 615-654 (1998)
14. Tacconi, L. et al., Submillimeter Galaxies at z ~ 2: Evidence for Major Mergers and Constraints on Lifetimes, IMF, and CO-H2 Conversion Factor, Astroph. J. 680, 246-262 (2008)
15. Ivison, R. et al., Tracing the molecular gas in distant submillimetre galaxies via CO(1-0) imaging with the Expanded Very Large Array, MNRAS 412, 1913-1925 (2011)
16. Krumholz, M.R., Dekel, A., McKee, C.F., A Universal, Local Star Formation Law in Galactic Clouds, nearby Galaxies, High-redshift Disks, and Starbursts, Astroph. J.
745, 69 (2012)
17. Stacey, G.J. et al., A 158 μm [C II] Line Survey of Galaxies at z ~ 1-2: An Indicator of Star Formation in the Early Universe, Astroph. J. 724, 957-974 (2010)
18. Barger, A.J. et al., X-ray, Optical, and Infrared Imaging and Spectral Properties of the 1Ms Chandra Deep Field North Sources, Astron. J. 124, 1839-1885 (2002) 19. Capak, P. et al., A massive protocluster of galaxies at a redshift of z~5.3, Nature
470, 233-235
20. Barger, A.J., Cowie, L.L., Wang, W.-H., A Highly Complete Spectroscopic Survey of the GOODS-N Field1, Astroph. J. 689, 687-708 (2008)
21. Hogg, D.W., Blandford, R., Kundic, T., Fassnacht, C.D., Malhotra, S., A Candidate Gravitational Lens in the Hubble Deep Field, Astroph. J. 467, 73-75 (1996)
22. Riechers, D.A. et al., A Massive Molecular Gas Reservoir in the z = 5.3 Submillimeter Galaxy AzTEC-3, Astroph. J. Letter 720, 131-136 (2010)
23. Daddi, E. et al., Two Bright Submillimeter Galaxies in a z = 4.05 Protocluster in Goods-North, and Accurate Radio-Infrared Photometric Redshifts, Astroph. J. 694, 1517-1538 (2009)
24. Schinnerer, E. et al., Molecular Gas in a Submillimeter Galaxy at z = 4.5: Evidence for a Major Merger at 1 Billion Years after the Big Bang, Astroph. J. Letter 690, 5-8 (2008)
25. Combes, F. et al., A bright z = 5.2 lensed submillimeter galaxy in the field of Abell 773. HLSJ091828.6+514223, Astron. Astroph. Letter 538, 4 (2012)
27. Ivison, R. et al., A robust sample of submillimetre galaxies: constraints on the prevalence of dusty, high-redshift starbursts, MNRAS 364, 1025-1040 (2005)
28. Wiklind, T. et al., A Population of Massive and Evolved Galaxies at z>~5, Astroph. J.
676, 781-806 (2008)
29. Dickinson, M. et al., The Unusual Infrared Object HDF-N J123656.3+621322,
Astroph. J. 531, 624-634 (2000)
30. Daddi, E. et al., Very High Gas Fractions and Extended Gas Reservoirs in z = 1.5 Disk Galaxies, Astroph. J. 713, 686-707 (2010)
Acknowledgements: This work is based on observations carried out with the IRAM
Plateau de Bure Interferometer. IRAM is supported by MPG (Germany), INSU/CNRS (France) and IGN (Spain). The Jansky Very Large Array of the National Radio
Astronomy Observatory (NRAO) is a facility of the National Science Foundation operated under cooperative agreement by Associated Universities, Inc. DR acknowledges support from NASA through a Spitzer Space Telescope grant. RD acknowledges funding through DLR project FKZ 50OR1004.
Contributions: F.W. had the overall lead of the project. The PdBI data were analyzed
by R.D., F.W., P.C., R.N., M.K. and D.D. The Jansky VLA data reduction was performed by C.C., J.H., and L.L. The molecular gas excitation was lead by A.W. Spectroscopic redshift information was provided by M.D., R.E., H.S., D.S. and D.P.S. The SED analysis including new Herschel data was lead by E.dC, D.E. and E.D. An updated lensing model was provided by D.D. All authors helped with the proposal, data analysis and interpretation.
Competing Interest Statement: The authors declare that they have no competing
financial interests.
Corresponding authors: Correspondence and requests for material should be
Figures
Figure 1: Detection of four lines tracing the star-forming interstellar medium in
HDF850.1. From top to bottom: [CII], ν obs = 307.383 GHz; CO(6-5), νobs = 111.835 GHz;
CO(5-4), νobs = 93.202 GHz, CO(2-1), νobs = 37.286 GHz. Zero velocity corresponds to a
redshift of z=5.183. Continuum emission is detected in the top two panels at 6.80±0.8 mJy and 0.13±0.03 mJy, respectively. We derive a 3σ continuum limit of 30 µJy from the Jansky VLA observations at 37.3 GHz using a bandwidth larger than shown here.
Gaussian fits to the lines give a full width at half maximum (FWHM) of 400±30 km s-1, narrower than typically found in sub-millimeter selected galaxies13. The observed
integrated line flux densities are: S[CII]=14.6±0.3 Jy km s-1, S[CO(6-5)]=0.39±0.1 Jy km s-1, S[CO(5-4)]=0.50±0.1 Jy km s-1 and S[CO(2-1)]=0.17±0.04 Jy km s-1. The resulting line luminosities are9: 5.0, 1.0, 1.9 and 4.1 x 10¹⁰ K km s-1 pc2 or 1,104, 10.6, 11.4 and 1.5 x 10⁷ Lsun (uncertainties as given for integrated line flux densities). LVG modeling
Figure 2: [CII] line emission towards HDF850.1. Left: [CII] contours on top of a deep
HST image1 of the region in a filter (I band) that covers the Ly-α line and UV continuum at z=5.183. [CII] contours show the averaged emission over 700 km s-1 and are plotted at 5, 7, 9, 11 mJy beam-1 (1σ=1.3 mJy beam-1). A Gaussian fit to the emission gives a deconvolved size of 0.9±0.3” or 5.7±1.9 kpc at z=5.183. The underlying continuum emission (not shown) is also extended on the same scales. Right: The blue and red contours indicate the approaching and receding [CII] emission relative to the systemic redshift of z=5.183. The color shows a deep HST image in a longer wavelength filter (NICMOS J band)29. The cross indicates the position and its 5σ uncertainty of the rest-frame 158 μm continuum emission peak (RA: 12h36m51.976s, DEC: 62o12’25.80’’ in the J2000.0 system), consistent with earlier millimeter interferometric measurements3,6 at lower resolution. The [CII] contours have been derived by averaging the spectrum (Fig. 1) from -400 km s-1 to 0 km s-1 and 0 km s-1 to +400 km s-1 and are plotted at levels of 7, 10 and 13 mJy beam-1 (1σ=1.8 mJy beam-1), respectively. In both panels the
beamsize of the [CII] observations (1.23” x 0.81”) is indicated in the bottom left corner. From the spatial offset (total offset=0.9”, i.e. radius: 0.45”, or r=2.8 kpc) and the FWHM of the line, we derive an approximate dynamical mass of Mdyn ~ 3.4 x 10¹⁰ Msun / (sin i)2
where i is the (unknown) inclination of the system (using Mdyn sin2i = 1.3 x (FWHM/2)2
r/G, where G is the gravitational constant30). These deep HST images of the HDF fail to reveal the (rest-frame) UV/optical counterpart of the galaxy that is forming stars at a rate of ~850 Msun yr-1.
[CII] contours on I−band
HDF850.1
red/blue−shifted [CII]
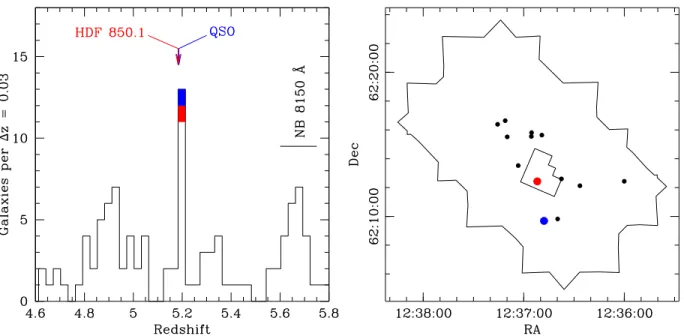
Figure 3: Distribution of galaxies near HDF850.1 Left: Distribution of spectroscopic
redshifts towards the HDF and its surrounding (GOODS-N). HDF850.1 is indicated by a red color, the quasar at the same redshift18 is shown in blue. There is an overdensity of galaxies in the redshift bin that contains HDF850.1. The high source density at z~5.7 is an observational artefact due to narrow-band Lyman-α imaging surveys of the region (with spectroscopic follow-up) that are sensitive to this particular narrow redshift range.
Right: Spatial coverage of the sources in the redshift bin z=5.183-5.213. The small
border indicates the size of the HDF – the larger border shows the surrounding area of GOODS-N. The presence of a strongly star-forming galaxy (HDF850.1) and a quasar18 in this region provides evidence for cosmic structure formation in the first Gyr of the universe. See Supplemental Information for more details.
Supplementary Information
1. Details on the Galaxy Overdensity at z=5.2
The redshifts of the galaxies shown in the left panel of Figure 3 have been compiled from a number of published spectroscopic surveys of the GOODS-N region20,31-38 and include new data from ongoing surveys (Stark et al. in prep., Stern et al. in prep). The redshifts shown in the histogram have primarily been derived from the red-shifted Lyman-Alpha emission line (typically, asymmetric line profiles are seen in the spectra, which add confidence to their high redshift). The histogram shown in Figure 3 (left) only includes the highest quality targets from these surveys.
Table 1 shows the coordinates and redshifts for the overdensity centered on the histogram bin that contains HDF850.1. The redshifts are typically accurate to the third digit. 12 sources (13 including HDF850.1) are distributed over a narrow redshift range between 5.183<z<5.213 (Δz = 0.03). This corresponds to a difference in comoving radial distance of 15.7 Mpc (i.e. a proper distance of 2.5 Mpc). If one assumes spherical symmetry for the overdensity this distance would correspond to a projected extent of 6.6 arcmin, which is close to what is observed (Fig. 3, right).
We note that HDF 850.1 and the quasar are amongst the lowest redshift galaxies in the overdensity. One possible explanation is that Lyman Alpha emission lines (used to derive the redshifts of the remaining galaxies shown here) tend to be redshifted from the systemic velocity due to systematic absorption on the blue side of the line at these redshifts (the redshift determination of HDF850.1 through molecular emission lines is not affected by this bias).
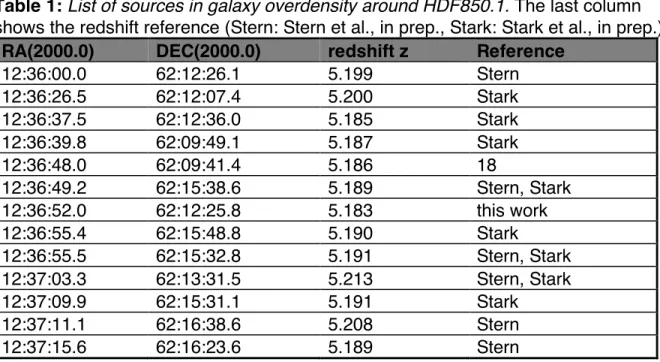
Table 1: List of sources in galaxy overdensity around HDF850.1. The last column
shows the redshift reference (Stern: Stern et al., in prep., Stark: Stark et al., in prep.)
RA(2000.0) DEC(2000.0) redshift z Reference
12:36:00.0 62:12:26.1 5.199 Stern 12:36:26.5 62:12:07.4 5.200 Stark 12:36:37.5 62:12:36.0 5.185 Stark 12:36:39.8 62:09:49.1 5.187 Stark 12:36:48.0 62:09:41.4 5.186 18 12:36:49.2 62:15:38.6 5.189 Stern, Stark 12:36:52.0 62:12:25.8 5.183 this work 12:36:55.4 62:15:48.8 5.190 Stark 12:36:55.5 62:15:32.8 5.191 Stern, Stark 12:37:03.3 62:13:31.5 5.213 Stern, Stark 12:37:09.9 62:15:31.1 5.191 Stark 12:37:11.1 62:16:38.6 5.208 Stern 12:37:15.6 62:16:23.6 5.189 Stern
2. Spectral Energy Distribution of HDF 850.1
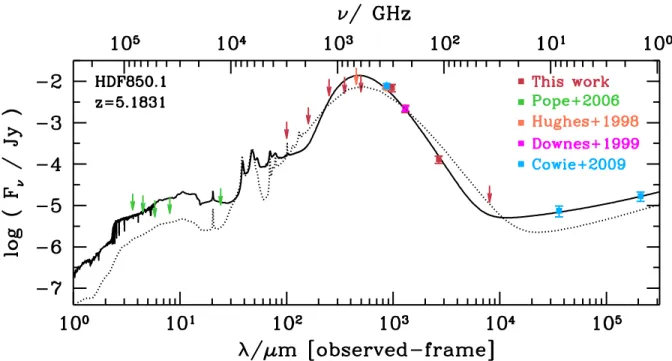
The observations presented here provide new constraints on the spectral energy distribution (SED) of HDF850.1. Figure S1 below summarizes all measurements (including data from the literature2,3,6,39) and includes new deep Herschel data of the region at 100, 160, 250, 350 and 500 microns40. For the Herschel bands we plot the measured flux density at the position of the source (0.18, 0.22, 5.0, 4.8 and 6.0 mJy, respectively) and add to this 2 times the noise (σ=0.5, 1.1, 3.2, 4.0, 4.0 mJy in the region around HDF850.1, respectively) as upper limits. We note that even though HDF850.1 is forming stars at a high rate, it is barely detected in the deep Herschel observations. The measurements done with the Spitzer Space telescope (shown in green) are blended with the bright foreground elliptical and thus only upper limits can be derived for HDF850.139. The full line shows our best-fit SED using a simple model that provides a consistent energy balance between the attenuated stellar emission and the dust emission41,42. Our modeling shows that a minimum dust attenuation (defined as the difference between the observed and intrinsic magnitude at a given wavelength,
Aλ = mλ[obs] - mλ[model]) of A1500Å ~ 5 mag in the far-UV and A5500Å ~ 2 mag in the
V-band is required to be consistent with the Spitzer/IRAC upper limits, which sample the rest-frame optical. The only other high-redshift source with similar properties (no
detection in rest-frame UV/optical) is GN1043. We note that an Arp220-like SED (shown as a dashed line) would result in even higher extinction values. An M82-like template (not shown), on the other hand, would be too bright in the rest-frame optical with respect to the observed upper limits. The emission by dust is described by using multiple
components, including polycyclic aromatic hydrocarbon (PAH) features and a hot dust component in the mid-infrared, and dust in thermal equilibrium in the far-infrared,
described by modified black bodies with an emissivity index of β=2.5. Lower values of β are difficult to reconcile with the observed steep drop in the Raleigh-Jeans part of the spectrum. This results in a total infrared luminosity of LIR = 8.7±1 x 10¹² Lsun (FIR[42-122
µm] luminosity: LFIR = 6.5±1 x 10¹² Lsun) and an average dust temperature of T=35±5 K.
The implied total dust mass is Mdust = 2.75±0.5 x 10⁸ Msun, with a resulting molecular
gas-to-dust ratio of 130±30(α/0.8), similar to what is found in local galaxies44 within the uncertainties. The implied star formation rate is 850±100 Msun yr-1 (assuming a Chabrier
stellar initial mass function). We note that the absence of reliable measurements in the rest-frame infrared around the peak of the dust emission make it difficult to obtain an accurate redshift based on photometry alone, in particular if the FIR measurements have significant uncertainties5.
Figure S1: Spectral energy distribution (SED) of HDF850.1, including all available
measurements from the literature and this work. The full line is our best-fit model (see text for details) – the dashed line is the scaled SED of Arp220 that is typically used to fit SEDs of high-redshift starburst galaxies. See Supplementary Information for details.
3. Stacking of fainter lines in the frequency scan
Our full frequency scan covers rest frequencies of 490-710 GHz for the redshift of HDF850.1. CO is by far the brightest emission line in this range, and we do not expect to detect the next brightest set of high-density tracers individually. We have however attempted to obtain a statistical detection of these lines through stacking. Figure S2 shows the result of the stacking exercise for the high-density tracers HCN(6-5), HCN(7-6), HCN(8-7), HNC(6-5), HNC(7-HCN(7-6), HCO+(6-5), HCO+(7-HCN(7-6), CS(11-10), CS(12-11), CS(13-12), CS(14-13), HOC+(6-5), HOC+(7-6) that are covered in our frequency scan. No emission is detected in this stack with a 1σ flux limit of 0.06 Jy km s-1 (assuming a linewidth of 400 km s-1). This non-detection is consistent with the few detections of dense molecular gas tracers in high-redshift objects that are significantly fainter than the CO emission45-54. Also, no stacked detection was achieved using different combinations of high density tracers (e.g. stacking only on HCN, HNC and HCO+, or including
additional species such as CN, CCH, and HC3N) or stacking on the CO isotopomers
13
Figure S2: Spectral line stack for the high-density tracers (HCN, HNC, HCO+, CS, HOC+) covered by our frequency scan. The grey lines show the individual spectra before stacking whereas the black line shows the stacked result. No emission is detection in these lines (nor in any other combination of lines, see text).
Additional References:
31. Cohen, J. et al., Redshift Clustering in the Hubble Deep Field, Astroph. J. Letter
471, 5-9 (1996)
32. Cohen, J. et al., Caltech Faint Galaxy Redshift Survey. X. A Redshift Survey in the Region of the Hubble Deep Field North, Astroph. J. 539, 29-52 (2000)
33. Cohen J., Caltech Faint Galaxy Redshift Survey. XIII. Spectral Energy Distributions for Galaxies in the Region of the Hubble Deep Field North, Astron. J. 121, 2895-2914 (2001)
34. Dawson, K.A., Stern, D., Bunker, A.J., Spinrad, H., Dey, A. Serendipitously Detected Galaxies in the Hubble Deep Field, Astron. J. 122, 598-610 (2001)
35. Kakazu, Y., Cowie, L.L., Hu, E.M., Mapping Extremely Low Metallicity Galaxies to Redshift One, Astroph. J. 668, 853-875 (2007)
36. Hu, E. et al., An Atlas of z=5.7 and z=6.5 Lyman Alpha Emitters, Astroph. J. 725, 394-423 (2010)
37. Stark, D.P., Ellis, R.S., Chiu, K., Ouchi, M., Bunker, A., Keck spectroscopy of faint 3<z<7 Lyman break galaxies - I. New constraints on cosmic reionization from the luminosity and redshift-dependent fraction of Lyman Alpha emission, MNRAS 408, 1628-1648 (2010)
38. Stark, D.P., Ellis, R.S., Ouchi, M., Keck Spectroscopy of Faint 3<z<7 Lyman Break Galaxies: A High Fraction of Line Emitters at Redshift Six, Astroph. J. Letter 728, 2
(2011)
39. Pope, A. et al., The Hubble Deep Field-North SCUBA Super-map - IV.
Characterizing submillimetre galaxies using deep Spitzer imaging, MNRAS 370, 1185-1207 (2006)
40. Elbaz, D. et al., GOODS-Herschel: an infrared main sequence for star-forming galaxies, Astron. Astroph. 533, 119 (2011)
41. da Cunha, E., Charlot, S., Elbaz, D., A simple model to interpret the ultraviolet, optical and infrared emission from galaxies, MNRAS 388,1595 (2008)
42. da Cunha, E. et al., Exploring the physical properties of local star-forming ULIRGs from the ultraviolet to the infrared, Astron. Astroph. 523, 78 (2010)
43. Daddi, E. et al., CO Emission Line from the Optical and Near-IR Undetected Submillimeter Galaxy GN10, Astroph. J. Letter 695, 176-180 (2009)
44. Draine, B. et al., Dust Masses, PAH Abundances, and Starlight Intensities in the SINGS Galaxy Sample, Astroph. J. 663, 866-894 (2007)
45. Barvainis, R., Maloney, P., Antonucci, R., Alloin, D., Multiple CO Transitions, CI, and HCN from the Cloverleaf Quasar, Astroph. J. 484, 695-701 (1997)
46. Solomon, P., Vanden Bout, P., Carilli, C., Guelin, M., The essential signature of a massive starburst in a distant quasar, Nature 426, 636-638 (2003)
47. Wagg, J., Wilner, D. J., Neri, R., Downes, D., Wiklind, T., HCN J = 5-4 Emission in APM 08279+5255 at z = 3.91, Astroph. J. Letter 634, 13-16 (2005)
48. Riechers, D., et al., First Detection of HCO+ at High Redshift, Astroph. J. Letter 645, 13-16 (2006)
49. Garcia-Burillo, S., et al., A New Probe of Dense Gas at High Redshift: Detection of HCO+(5-4) Emission in APM 08279+5255, Astroph. J. Letter 645, 17-20 (2006) 50. Riechers, D., et al., Detection of Emission from the CN Radical in the Cloverleaf
Quasar at z=2.56, Astroph. J. 666, 778-783 (2007)
51. Guelin, M., et al., Detection of HNC and tentative detection of CN at z = 3.9, Astron.
Astroph. Letter 462, 45-48 (2007)
52. Riechers, D., Walter, F., Weiss, A., Wagg, J., Dense Molecular Gas Excitation in Nuclear Starbursts at High Redshift: HCN, HNC, and HCO+(J=6-5) Emission in the z = 3.91 Quasar Host of APM 08279+5255, Astroph. J. 725, 1032-1039 (2010) 53. Danielson, A.L.R., et al., The properties of the interstellar medium within a
star-forming galaxy at z= 2.3, MNRAS 410, 1687-1702 (2011)
54. Riechers, D., et al., Dense Molecular Gas Excitation at High Redshift: Detection of HCO+(J=4-3) Emission in the Cloverleaf Quasar, Astroph. J. 726, 50 (2011)

![Figure 2: [CII] line emission towards HDF850.1. Left: [CII] contours on top of a deep HST image 1 of the region in a filter (I band) that covers the Ly-α line and UV continuum at z=5.183](https://thumb-eu.123doks.com/thumbv2/123doknet/12990821.379265/9.918.105.821.107.446/figure-emission-left-contours-region-filter-covers-continuum.webp)