HAL Id: hal-02951387
https://hal.umontpellier.fr/hal-02951387
Submitted on 28 Sep 2020
HAL is a multi-disciplinary open access
archive for the deposit and dissemination of
sci-entific research documents, whether they are
pub-lished or not. The documents may come from
teaching and research institutions in France or
abroad, or from public or private research centers.
L’archive ouverte pluridisciplinaire HAL, est
destinée au dépôt et à la diffusion de documents
scientifiques de niveau recherche, publiés ou non,
émanant des établissements d’enseignement et de
recherche français ou étrangers, des laboratoires
publics ou privés.
To cite this version:
Chris Hawkesworth, Peter Cawood, Bruno Dhuime.
The Evolution of the Continental Crust
and the Onset of Plate Tectonics.
Frontiers in Earth Science, Frontiers Media, 2020, 8,
doi: 10.3389/feart.2020.00326
Edited by: Kristoffer Szilas, University of Copenhagen, Denmark Reviewed by: Oscar Laurent, UMR 5563 Géosciences Environnement Toulouse (GET), France Marlina A. Elburg, University of Johannesburg, South Africa *Correspondence: Chris J. Hawkesworth c.j.hawkesworth@bristol.ac.uk Specialty section: This article was submitted to Petrology, a section of the journal Frontiers in Earth Science Received: 08 April 2020 Accepted: 13 July 2020 Published: 06 August 2020 Citation: Hawkesworth CJ, Cawood PA and Dhuime B (2020) The Evolution of the Continental Crust and the Onset of Plate Tectonics. Front. Earth Sci. 8:326. doi: 10.3389/feart.2020.00326
The Evolution of the Continental
Crust and the Onset of Plate
Tectonics
Chris J. Hawkesworth1* , Peter A. Cawood2and Bruno Dhuime3
1School of Earth Sciences, University of Bristol, Bristol, United Kingdom,2School of Earth, Atmosphere & Environment,
Monash University, Melbourne, VIC, Australia,3Géosciences Montpellier, Univ. Montpellier, CNRS, Montpellier, France
The Earth is the only known planet where plate tectonics is active, and different studies have concluded that plate tectonics commenced at times from the early Hadean to 700 Ma. Many arguments rely on proxies established on recent examples, such as paired metamorphic belts and magma geochemistry, and it can be difficult to establish the significance of such proxies in a hotter, older Earth. There is the question of scale, and how the results of different case studies are put in a wider global context. We explore approaches that indicate when plate tectonics became the dominant global regime, in part by evaluating when the effects of plate tectonics were established globally, rather than the first sign of its existence regionally. The geological record reflects when the continental crust became rigid enough to facilitate plate tectonics, through the onset of dyke swarms and large sedimentary basins, from relatively high-pressure metamorphism and evidence for crustal thickening. Paired metamorphic belts are a feature of destructive plate margins over the last 700 Myr, but it is difficult to establish whether metamorphic events are associated spatially as well as temporally in older terrains. From 3.8 to 2.7 Ga, suites of high Th/Nb (subduction-related on the modern Earth) and low Th/Nb (non-subduction-related) magmas were generated at similar times in different locations, and there is a striking link between the geochemistry and the regional tectonic style. Archean cratons stabilized at different times in different areas from 3.1 to 2.5 Ga, and the composition of juvenile continental crust changed from mafic to more intermediate compositions. Xenon isotope data indicate that there was little recycling of volatiles before 3 Ga. Evidence for the juxtaposition of continental fragments back to ∼2.8 Ga, each with disparate histories highlights that fragments of crust were moving around laterally on the Earth. The reduction in crustal growth at ∼3 Ga is attributed to an increase in the rates at which differentiated continental crust was destroyed, and that coupled with the other changes at the end of the Archean are taken to reflect the onset of plate tectonics as the dominant global regime.
INTRODUCTION
The present day Earth is shaped by plate tectonics, and yet this is the only known planet where plate tectonics is active, and there is much discussion over when plate tectonics may have become the dominant regime on Earth, and how that is best established (Kroner and Layer, 1992;de Wit, 1998;Komiya et al., 1999; Nutman et al., 2002; Stern, 2005; Brown, 2006; Cawood et al., 2006;Moyen et al., 2006;Smithies et al., 2007;Van Kranendonk et al., 2007;Dilek and Polat, 2008;Harrison et al., 2008;Hopkins et al., 2008;Pease et al., 2008;Shirey et al., 2008; Nebel-Jacobsen et al., 2010;Van Kranendonk, 2010;Hamilton, 2011;Shirey and Richardson, 2011;Dhuime et al., 2012;Naeraa et al., 2012;Arndt, 2013;Arndt and Davaille, 2013;Stern et al., 2013;Griffin et al., 2014; Ernst et al., 2016;Hastie et al., 2016; Stern et al., 2016;Dhuime et al., 2017;Hawkesworth et al., 2017; Cawood et al., 2018).
Different studies have concluded that plate tectonics started at times that range from the early Hadean to 700 Ma. This reflects differences in definition over what is meant by plate tectonics, and that different studies have regarded different pieces of evidence as pivotal (Hawkesworth and Brown, 2018). For example, there are a number of proxies for subduction-related and intraplate settings, such as metamorphic conditions and magma compositions. These were developed for rocks generated in the relatively recent geologic past, and it is not clear how far back in time such proxies should be regarded as reliable indications of tectonic settings, or how those settings may have changed with time. We have sought to use proxies developed on recent rocks and to explore the extent to which they have different implications in the past. It appears that processes similar to subduction of lithosphere at destructive plate margins, can be triggered by impacts and mantle plumes, as well as by plate tectonics (Gerya et al., 2015; O’Neill et al., 2017). Evidence for subduction taking place in particular locations on the early Earth may not therefore be a smoking gun in the recognition of a global-scale plate tectonic system. The challenge is to develop approaches that indicate when plate tectonics became the dominant, sustainable global regime, particularly given that only relatively small volumes of Archean rocks are preserved (Goodwin, 1996), in part by putting the results of detailed case studies into a global context.
This review considers ways in which the development of plate tectonics may be recognized from the geological record. Plate tectonics facilitates heat loss, it involves sufficient lateral movement for the generation of significant volumes of oceanic crust, and there appears to be an optimum balance between continental and oceanic crust with the Earth covered in 40% of continental crust. The residence time of oceanic crust is short, up to a couple of 100 Myr, and so for much of Earth history the record of global tectonics is preserved on the continents, even though the effects of a hotter Earth may be mostly seen in increased volumes of oceanic magmatism.
In evaluating the continental record we distinguish:
(i) Specific features preserved in the continental record, such as metamorphic and tectonic asymmetry, palaeomagnetic evidence for lateral movements, and crustal strength, and
(ii) Consequences of plate tectonics, such as recycling of atmospheric Xe and decreased crustal growth rates attributed to increased destruction due to recycling. A number of models have been proposed for the destruction and recycling of continental crust, including meteorite bombardment, sagduction, gravitational instabilities resulting in drips of lithospheric material, and subduction as observed today. Yet it remains difficult to predict differences between models in terms of metamorphic conditions and the magmas generated that provide robust, let alone unequivocal, tests in the geological record. We therefore use metamorphic and magmatic proxies for destructive plate margins from the present day, exploring where possible how they may have different implications in the Archean and early Proterozoic. These are integrated with data on the lateral movement of continents, and evidence for when the crust became strong enough for plate tectonics to operate. In passing, we note that even in periods before the inferred development of plate tectonics, it is convenient to use the term intraplate for magmas generated in settings with no significant contribution from destructive plate processes. Subduction is used if the data are similar to those observed at destructive plate margins at the present day. Use of the term subduction does not preclude other processes resulting in similar magmatic and metamorphic signatures by different processes earlier in Earth history, but those need to be established.
In summary, our approach is to evaluate when plate tectonics became the dominant tectonic regime on the basis of:
1. Magma compositions associated with destructive plate margins today,
2. Bimodal T/P conditions in metamorphic rocks, 3. Palaeomagnetic evidence for lateral movements, 4. The development of divergent boundaries,
5. Evidence that the crust is strong enough to facilitate plate tectonics, and
6. Changes in the rates of recycling of continental crust. The development of strong crust is reflected in the onset of dyke swarms and large sedimentary basins, and the development of relatively high pressure metamorphism as evidence for crustal thickening and mountain building. The bimodality of metamorphic systems is taken as evidence for tectonic asymmetry, and hence destructive plate margins (Brown, 2006; Holder et al., 2019), and it has been argued that the development of felsic crust is an indication of when plate tectonics started (Tang et al., 2016;Greber et al., 2017). However, other tectonic systems also generate felsic crust (e.g., Willbold et al., 2009; Roberts et al., 2015; Moyen and Laurent, 2018) and the composition of the bulk crust remains difficult to sample. The composition of new continental crust, and how that changed with time (Dhuime et al., 2015), constrains models for the tectonic settings in which new crust is generated. Potential consequences of plate tectonics include changes in the rates of crustal growth, which are taken to be a sign of when significant volumes of at least differentiated continental crust started to be destroyed, the Xe isotope record in the upper mantle, and perhaps changes in the Sr isotope composition of seawater.
WIDER IMPLICATIONS
Why is the nature of the early crust, and how it formed, a topic of such widespread interest? It is widely argued that the processes that shaped the crust in the Hadean and into the Archean influenced conditions on the Earth today. Heat production was 3–6 times higher than at the present time (e.g., Pollack, 1997), and most of the geological record dates back to the end of the heavy meteorite bombardment at ca. 3.9 Ga (e.g.,Hartmann et al., 2007). Less than 7% of the continental crust preserved today is older than 3 Ga (Goodwin, 1996), it is difficult to evaluate how representative that record may be of the processes that were dominant at that time, and yet there were relatively large amounts of heat that had to be dissipated by magmatic activity. The nature of the new crust reflected regional tectonics, and the nature of the bulk continental crust in turn influenced tectonics, the emergence of land, and the shaping of the biosphere. A key step was the development of plate tectonics, and how that influenced the subsequent history of the Earth, including the development of life.
Plate tectonics is associated with the generation of a magnetic field by convection of Earth’s core, and this may have protected life on Earth by deflecting the solar wind and cosmic ray particles. Plate tectonics resulted in the generation of significant volumes of emerged felsic crust, which was then susceptible to erosion and weathering with the linked drawdown in CO2. The reduction in CO2, and lithosphere recycling through long-lasting plate tectonics, helped regulate the planet’s temperature to the Goldilocks conditions of not too warm and not too hot, which have been fundamental in the development of life. The cooling of the Earth’s mantle by the onset of plate tectonics reduced the degrees of partial melting, and resulted in crustal rocks with higher phosphorus contents. On erosion, these increased the phosphorous contents of the oceans until they were high enough for photosynthesis by primitive life to thrive and to increase the oxygen contents of the atmosphere sufficiently to support multicellular life (Cox et al., 2018). Plate tectonics helps sustain life since the recycling and exchange of material between the mantle, the crust, oceans and atmosphere ensures that elements that are crucial to life, like carbon, nitrogen, phosphorus, and oxygen, are available to the biosphere. The time periods of supercontinental cycles, when continents come together to make large supercontinents, and those supercontinents then break up into smaller continental blocks again, resulted in large pulses of nutrients into the biosphere and allowed organisms to increase (Zerkle, 2018).
Bringing continents together and separating them again promotes biodiversity (Ward and Brownlee, 2000), and it may enhance isolation and competition. The action of life increases the amounts of weathering and hence the amounts of water returned to the mantle in sediments. Water in the mantle helps serve as a lubricant, facilitating convection and plate movement, and perhaps constraining the fraction of the surface covered by emergent continents (Honing et al., 2014; Cawood and Hawkesworth, 2019). Most life is found on continents and continental shelves. These make up ∼40% of the Earth surface, which may be ideal. Increasing the area of land would
increase biological productivity, but it has the downside that less precipitation will fall on the interiors of continents. Simulations suggest that the present area of continents on Earth is not readily predicted and it may, in significant part, reflect plate tectonics and the presence of water.
Studies of mountain belts, and the extent to which they are dynamic rather than static systems, led to an interest in tectonic processes. The recognition of similar fossils groups on different continents, and the geographic fit of some continents with continents nearby, encouraged models of lateral movement and discussion of continental drift (Schuchert, 1909; Wegner, 1912; Holmes, 1925; du Toit, 1937) before the recognition of a viable driving mechanism in the 1960s. This relied in part on studies of the ocean crust, and the recognition of "magnetic stripes" of alternating remnant magnetization in rocks symmetric to mid-ocean ridge axes (Hess, 1962;Vine and Matthews, 1963). The crust of the oceans was shown to be relatively young, unlike the continents, and to increase in age away from mid-ocean ridges, where it is generated by sea-floor spreading, and recycled into the mantle at oceanic trenches, resulting in the Wilson cycle of oceans opening and closing. The young age of oceanic crust, less than 200 Ma, means that such information is not available for most of Earth history, which highlights the requirement to develop other criteria for the recognition of when plate tectonics may have started.
SIGNIFICANT DEVELOPMENTS
Studies of the generation and evolution of the continental crust, and of the onset of plate tectonics, awaited the development of precise dating techniques, and the application of radiogenic isotope ratios to evaluate chemical changes through time within and between the different reservoirs of the Earth. Such studies take place within the constraints imposed by radioactive decay, which require that reservoirs need to attain a certain age, typically several 100 Myr, before they can be identified by the development of distinct radiogenic isotope ratios (e.g.,Allègre, 1987). New information from other planets, and the development of geodynamic modeling has focused attention back on the geology and tectonics of Archean terrains. The Earth is unique among the readily accessible planets, in that plate tectonics is the dominant tectonic regime, and much of the focus in this contribution is over when plate tectonics emerged as the dominant regime and how that can be established from the geological record.
Information from different scales, and how they may best be integrated, remains a key feature of the Earth Sciences. Scale is significant in part to distinguish evidence for local and more global events, and in part because the effects of particular processes may be different at different scales. Global and regional distributions of the ages of zircons may have different implications. For example, data from the Yangtze River in China have peaks and troughs of ages of crystallization of zircon (Figure 1A;Liang et al., 2018), and these can be linked to regional magmatic events, and perhaps to docking with segments of crust with different magmatic histories, which need not be
FIGURE 1 | Selected distributions of zircon crystallization ages (A) regionally from the Yangtze River (Liang et al., 2018), and (B) in a global data base (Voice et al., 2011), to highlight the different implications of global and regional age distributions. The gray bars are the estimated ages of supercontinents, taken fromCampbell and Allen (2008). The regional age distributions are clearly more closely linked to regional geological events, whereas global signals need to take that into account whether they invoke mantle plumes, or supercontinents, for example.
related to the time of global-scale events. The crust formation, or model ages, can be grouped on the basis of their oxygen isotope ratios to distinguish samples with mantle-likeδ18O values from those with higher δ18O that contain contributions from pre-existing sedimentary material and reflect crustal reworking
(Valley et al., 1998, 2005;Hawkesworth and Kemp, 2006b;Kemp et al., 2006, 2007). This allows periods of crust formation in areas sampled by the Yangtze River to be identified, and crustal growth curves to be generated for the areas sampled, and in turn compared with global models for the growth of continental crust.
Regional data sets can be combined to form global data sets, but the areas represented by regional curves are well defined, and regional studies clearly can’t be used to test global models of, in this case, crustal growth.
More generally, it is not always straightforward to link different kinds of data sets, e.g., sedimentology and geophysics, in part because they record events with different frequencies. Local evidence for plate tectonic processes on outcrop and regional scales, such as blueschist metamorphic rocks and subduction-related magma associations, needs to be placed in a larger context with more global evidence for when plate tectonics became the dominant tectonic regime. One approach has been to look for the oldest geological example, such as of blueschists, as an indication of when plate tectonics started (Stern, 2005). An alternative is to seek to establish the consequences of plate tectonics, and when they can be established, not least as this may involve a global signal. This is analogous to discussions of the biosphere and the origins of life, or of particular species, where the emphasis is on detecting the effects of the onset of life, rather than on finding the first fossil, since that is sensitive to the vagaries of preservation in the geological record.
The kinds of evidence preserved are also sensitive to the nature of the geological record. The volumes of crust preserved from the Archean, which are <10% of the present volume of the continental crust, is much less than that preserved from the Phanerozoic, for example, suggesting that large volumes of Archean crust have been destroyed (Dhuime et al., 2012, 2018; Hawkesworth et al., 2013). This highlights concerns over the extent to which the preserved geological record is representative of the geological processes that took place in different stages of Earth history. This may be simply illustrated by the discussion over the peaks of ages in global zircon compilations (Figure 1B). In most cases each zircon age marks the crystallization of a felsic magma, and some have argued that the age distribution is a primary record, and that peaks of ages represent global pulses of magmatism, typically linked to superplumes (Stein and Hofmann, 1994;Albarède, 1998;Condie, 1998;Arndt and Davaille, 2013). Others have highlighted that the peaks of ages are periods of time of increased crustal reworking, and as such typically reflect more frequent crustal thickening and hence plate collision (Campbell and Allen, 2008;Hawkesworth et al., 2009, 2017; Cawood et al., 2013; Spencer et al., 2014). Crust trapped in collision zones has a longer crustal residence time than material generated along destructive plate margins, where the rates at which crust is destroyed are similar those at which new crust is generated (e.g., Scholl and von Huene, 2007; Clift et al., 2009; Scholl and von Huene, 2009). In this interpretation, the geological record is biased by the preferential preservation of rocks from periods of enhanced continental collision (Hawkesworth et al., 2009), and the peaks of ages coincide with the ages of assembly of supercontinents. The peaks of ages in turn represent periods of increased crustal growth, not because more crust was necessarily generated, but because less of the crust that had formed was destroyed.
The frequency distribution of detrital zircon ages appears to record the preservation, in the sedimentary rock record, of zircons that grew in magmas associated with the amalgamation
and dispersal of supercontinents over time. The consequences of preservation bias highlights the issue of which aspects of the geological record may nonetheless be interpreted with confidence. As discussed for the ages of zircons, age distributions are susceptible to bias, but the characteristics of different rock suites, including geochemical compositions and metamorphic conditions, are likely to be more robust. The presence and absence of supercontinents can be established, whereas changes in the volumes of magmas generated in different tectonic settings at different times may be less reliable.
There is much discussion of the secular distribution of ore deposits of different types, not least to inform exploration models (Kerrich et al., 2005;Cawood and Hawkesworth, 2015). Some deposits reflect long term changes in conditions on the Earth, such as mantle temperatures and oxygen levels in the atmosphere, and these can be evaluated irrespective of whether their age distributions have been modified by subsequent tectonic processes. Other deposits reflect local tectonic processes, and their distribution may well have been modified by later events. Nonetheless the settings in which preserved ore deposits were generated can be evaluated without needing to infer that these settings were necessarily representative of global tectonics at the time. The existence of numerous orogenic deposits in the late Archean reflects the preservation of greenstone belts in stable shield areas of the world (Groves and Bierlein, 2007). In Proterozoic times (Cawood and Hawkesworth, 2014), by contrast, longer-lived continental stability and buoyant crust might have uplifted and eroded similar mineralized destructive plate margin sequences so that many of the related near-surface ores were destroyed. The products of Phanerozoic orogenies are better preserved because many of them have not yet suffered collision, uplift and erosion and, therefore, remain intact. For example, the Cordilleran ore systems, have yet to experience the closure of Pacific Ocean and any resultant bias this imposes on the rock archive (Cawood and Hawkesworth, 2015).
DIFFERENT SCHOOLS OF THOUGHT OR
CONTROVERSIES
Different authors have suggested that plate tectonics commenced at times that range from the early Hadean to 700 Ma (Kroner and Layer, 1992; de Wit, 1998; Komiya et al., 1999; Nutman et al., 2002; Stern, 2005; Brown, 2006; Cawood et al., 2006; Moyen et al., 2006;Smithies et al., 2007;Van Kranendonk et al., 2007; Dilek and Polat, 2008; Harrison et al., 2008; Hopkins et al., 2008;Pease et al., 2008;Shirey et al., 2008;Nebel-Jacobsen et al., 2010; Van Kranendonk, 2010; Hamilton, 2011; Shirey and Richardson, 2011;Dhuime et al., 2012;Naeraa et al., 2012; Stern et al., 2013; Griffin et al., 2014;Ernst et al., 2016;Hastie et al., 2016; Stern et al., 2016). This in part reflects different definitions of what is meant by plate tectonics, and that in turn means that different pieces of evidence have been regarded as pivotal. Should, for example, plate tectonics be regarded as similar to what is seen at the present day, or should it incorporate information on how the lithosphere behaves in a hotter, older Earth? The evidence for each might be different, as seen in the
metamorphic record. Paired metamorphic belts, and the presence of blueschists, are a key feature of recent destructive plate margins (Miyashiro, 1961, 1973), and yet most examples are younger than ∼ 700 Ma (Ernst, 1972;Brown, 2006). Older terrains have bimodal T/P distributions but at higher metamorphic gradients than blueschists. Some have therefore argued that the presence of blueschists is a key piece of evidence for plate tectonics as we know it today (Stern, 2005;Hamilton, 2011), whereas others have argued that bimodal T/P distributions reflect tectonic asymmetry and that remains critical as we seek to establish the onset of lateral movements that might reflect plate tectonics in the past (Holder et al., 2019).
The search for the oldest blueschist, has similar weaknesses to looking for the oldest fossil in trying to date the origin of life. The quirks of preservation are poorly understood, and it cannot be established whether there were older examples than the ones found that are no longer preserved. Nonetheless similar arguments have been put forward based on Cu porphyry deposits and magmatic suites similar to those generated at convergent plate margins at the present day, where the oldest example is taken at least as evidence that plate tectonics had started by that time (e.g.,Goldfarb et al., 2001;Turner et al., 2014, 2020). The concerns include; (i) it is difficult to put individual examples in wider context, particularly in the Archean for which relatively small volumes of crust are preserved. To what extent might they be representative of the rock record at that time, and how might that be established? (ii) Features that are formed in particular settings in the recent tectonic past, are taken to be evidence for similar settings in the past, when this can be difficult to establish. (iii) The presence of subduction-related features, for example, suggests that subduction took place locally at the time. However, subduction is also inferred to be triggered by meteorite impacts (O’Neill et al., 2017) and mantle plumes (Gerya et al., 2015), as well as plate tectonics (Stern, 2004), and it remains difficult to put the evidence of local examples into a global context.
The younger estimates for the onset of plate tectonics tend to reflect plate tectonics being defined similarly to what is observed today (<1 Ga) (Stern, 2005;Stern et al., 2013, 2017), or that evidence for subduction can only be established in the late Proterozoic (0.85 Ga) (Hamilton, 2011). Many estimates for the onset of plate tectonics are Archean in age, these tend to rely on geological evidence for sufficiently strong crust for subduction to take place, and for lateral movements including mobile belts, accretionary prisms, the onset of recycled mafic crust as eclogite recorded in diamonds, paired metamorphic belts, and palaeomagnetic data. In many cases these arguments are minimum ages for the onset of plate tectonics, as they are based on the oldest known evidence. Increasingly it is accepted that plate tectonics was unlikely to have begun on Earth as a single global “event” at a distinct time, but rather that it began locally and progressively became more widespread through time (Condie and Kroner, 2008; Hawkesworth et al., 2016, 2019; Cawood et al., 2018). The evidence for continental amalgamations from the late Archean (Figure 1B), consisting of crustal remnants with discrete temporal and spatial records, remains strong evidence that there was lateral movement between fragments of crust by that time.
GEOLOGICAL EVIDENCE
Relative Strength of the Crust
Geodynamic models highlight that subduction of one plate below another requires a certain rigidity in the crust. The lithosphere is weaker at higher temperatures, and it has been argued that plate tectonics may only take place once the mantle potential temperature was within ca. 150◦
C of that at the present day (Sizova et al., 2010;Johnson et al., 2014). Some geological features reflect the strength of the crust, or in some cases the lithosphere, and these include the oldest regional dyke swarms at ∼2.6 Ga, and the oldest major sedimentary basins at ∼2.8 Ga (Cawood et al., 2018). Archean granulite events tend to be late Archean in age (Holder et al., 2019), which suggests that the crust was strong enough to sustain crustal thickening and resultant deep-crustal metamorphism by that time (Rey and Coltice, 2008).
If the crust was relatively weak in the Archean then there may have been relatively little in the way of mountain building, and even significant topographic relief, in continental areas before the late Archean (Cawood and Hawkesworth, 2019). Most Archean sedimentary rocks are preserved in greenstone belts, and they were deposited in shallow water, often in coastal plain type environments (Eriksson et al., 1994). There may have been other domains of local, higher relief, but recent estimates of the increase in Sr isotope ratios in seawater, that is taken to reflect increased continental emergence and erosion, and presumably relief, took place by ∼2.9 Ga (Shields and Veizer, 2002; Satkoski et al., 2016, 2017). In terms of sampling the composition of the upper continental crust, greenstone belt sedimentary rocks appear to reflect relatively shallow topographic relief, and thus the depths of crustal exposure sampled by greenstone belt sediments is likely to have been less that that sampled by sediments in younger orogenic systems.
Western Australia provides a good example of changing tectonic styles in the Archean and into the early Proterozoic (Figure 2). The Pilbara terrain of NW Australia is characterized by dome and basin tectonics reflecting vertical tectonic movements, and associated with intraplate volcanic rocks (Hickman, 2004;Smithies et al., 2007). At ∼3.1 Ga the magmatic and structural records indicate a shift to more lateral tectonics along the northwest margin, and in N-S trending belts along the eastern Yilgarn craton, with the development of subduction related magmatic rocks and associated ores (e.g., Champion and Cassidy, 2007; McCuaig et al., 2010). Then, by the early Proterozoic, the Archean crust had stabilized sufficiently to host the oldest major dyke swarm in the area, the Widgiemooltha dykes at 2.4 Ga (Nemchin and Pidgeon, 1998; Figure 2).
Tectonic and Metamorphic Asymmetry
The asymmetry of modern destructive plate margins and the degrees of shortening associated with old mobile belts reflect lateral movements, and as such they may be taken to be features of plate tectonics. Models of tectonic regimes in a stagnant lid Earth show pulses of lateral movements (Beall et al., 2018; Capitanio et al., 2019a,b), and lateral movements may result in distinctive regimes in the metamorphic
FIGURE 2 | The changing tectonic styles from 3.5 to 2.4 Ga in Western Australia. (A) A sketch map of the dome and basin terrain of Pilbara in NW Australia, after
Hickman (2004)andVan Kranendonk (2010)(B) geological sketch map of the Yilgarn craton and the N-S trending mobile belts in the East Yilgarn (afterKusky et al., 2018), and (C) a map of the Widgiemooltha dyke swarm in the SW Yilgarn.
record.Brown (2006, 2007)compiled and reviewed variations in metamorphic conditions, for the most part in the context of plate tectonics and how far back in time that may provide a meaningful framework. He focused on the relatively high grade rocks linked to the peak of metamorphism, and subdivided the range in estimated apparent T/P values into three groups: granulites and ultrahigh-temperature (UHT) granulites, medium-temperature eclogite high pressure (EHP) granulites, and high pressure to ultrahigh pressure (HP–UHP) metamorphic rocks (Figure 3). Examples of the three groups occur back to ∼700 Ma, and older terrains are dominated by UHT and EHP rocks. In the context of tectonic processes, we consider (i) metamorphic asymmetry as in paired metamorphic belts, and (ii) maximum metamorphic pressures (Figure 4B), at least within the intermediate and high T/P groups, as an indication that the crust was sufficiently strong for tectonic thickening to take place.
At the present time, paired metamorphic belts are a distinctive feature of destructive plate margins. They result in a bimodal distribution of the apparent thermal gradients (i.e., metamorphic T/P), which is attributed to metamorphism near (low T/P, HP–UHP) and away from (high T/P) subduction
zones (Ernst, 1972;Miyashiro, 1973). Blueschists (HP–UHP) are observed back to ∼700 Ma, they are part of bimodal suites similar to those observed in the recent geological past, and there is general agreement that plate tectonics as observed today has been active since that time. Rocks older than 700 Ma also appear to record bimodal associations, but they tend to be displaced to higher T/P (Figure 4A), and while they are bimodal in term of ages it is very difficult to establish that they are spatially related.
Holder et al. (2019)reaffirmed the bimodal distribution for metamorphic rocks over the last 200 Ma, although the dividing line between the two modes is within the intermediate T/P group at 500◦
C GPa−1
, rather than at the boundary of the low T/P rocks at 350◦
C GPa−1 (Figure 4). Thus, there are concerns over what the bimodality may signify in rocks of different ages and different T/P values. The bimodality in the Proterozoic and late Archean is taken to reflect destructive plate margins but displaced to higher T/P, perhaps because the Earth was hotter (Holder et al., 2019). However, a number of examples of high T/P conditions in the Phanerozoic are associated with crustal domes and metamorphism in response to thickening, uplift and erosion, rather than to plate margins
FIGURE 3 | Variations in the temperatures and pressures from the peak of metamorphism estimates fromBrown (2006, 2007), as inBrown and Johnson (2019), The facies series are fromZheng and Zhao (2020).
(see data compilation inBrown and Johnson, 2019), and paired high and intermediate T/P metamorphism can be developed in models with lithosphere peel-back associated with lithospheric convergence (Chowdhury et al., 2020). Holder et al. (2019) argued that bimodal metamorphism was well developed by 2 Ga, and that plate tectonics may have started by the Late Archean. In general, intermediate and high T metamorphic events reflect anomalous thermal regimes linked to increased mantle heat flow or to crustal thickening. Thus, clusters of different apparent T/P values may be a feature of the geological record that reflect common thermal regimes that are not necessarily linked spatially. In which case they may not provide evidence for linked bimodality analogous to recent destructive plate margins.
The observed bimodality for young metamorphic terrains is because of the presence of low T/P metamorphic suites (Figure 3; Brown, 2006, 2007; Holder et al., 2019), and there is no bimodality within the moderate to high T/P terrains in the last 200 Ma. In terrains older than 700 Ma the inferred bimodality occurs in moderate to high T/P suites, and on the modern Earth the associated environments include crustal thickening, subduction or back arc settings, and high T rifts (Hyndman et al., 2005; Hyndman, 2019). It is less clear as to the conditions under which they might reflect linked tectonic processes, and hence result in a bimodal assemblage that might imply plate convergence.
Compressive tectonics and crustal thickening is further reflected by relatively high pressures of metamorphism, and by crustal reworking in the generation of granitic magmas.
Figure 4B plots maximum pressure estimates against age of metamorphism for the low, intermediate and high T/P
groups (following Brown, 2014), together with the ages of supercontinents (as in Figure 1B) and the variations in the degree of crustal reworking estimated from Hf isotope ratios in zircon (Dhuime et al., 2012). The ages of the metamorphic rocks broadly cluster with the ages of supercontinents, as do the zircon ages in Figure 1B. The clustering of the intermediate T/P, Barrovian-type rocks appears to be more marked than for the high T/P Buchan-type assemblages, consistent with Barrovian metamorphism being more closely linked to supercontinent assembly than rocks at relatively higher temperatures.
The high pressures of the low T/P group are very striking and for the large part they are restricted to the last 700 Ma. The maximum pressures recorded in the intermediate T/P group of Brown increase to 1.6 GPa, or depths of 60 km, by 2.5 Ga. There are few data from older rocks, but pressures are recorded of 1.3 GPa before 3 Ga. The end of the Archean is also marked the development of the oldest known supercontinent and by an increase in the proportions of continental crust involved in felsic magmas, as recorded in the Hf isotope andδ18O values of zircons (Valley et al., 2005;Belousova et al., 2010;Dhuime et al., 2012; Spencer et al., 2014; and see also Figure 13), further suggesting it was a time of significant tectonic change.
Magmatic Associations
Minor and trace element discriminant diagrams of basaltic rocks have been very successful in constraining the tectonic setting in which those magmas were generated (Pearce and Cann, 1973; Pearce, 2008). The approach is based on modern examples of rocks from different plate tectonic settings, and there is considerable interest over the extent to which similar approaches can be applied to the Archean. Discriminant diagrams have also been developed for granitic rocks (Pearce et al., 1984), but these are more difficult to interpret because of the role of source rocks in determining the minor and trace element contents of felsic magmas. The source rocks may have formed in a different tectonic setting than the ones in which the granites were generated, and that imprint may be retained in the granitic rocks. Many Archean suites are bimodal in silica, irrespective of whether they were generated in dome and basin terrains, implying vertical movements, or in more linear belts associated with compressive tectonics (e.g.,Kamber, 2015; Hawkesworth et al., 2016). Such bimodal distributions are a feature of intraplate volcanism in the recent geologic past, but not of subduction-related magmas. Most granite-greenstone terrains have been the subject of detailed geochemical investigations, seeking to constrain the tectonic setting in which the more mafic magmas were generated, and often the depths of partial melting, and differentiation, for the felsic magmas. Some approaches rely on the recognition of boninitic magmas (Cameron et al., 1979; Polat and Kerrich, 2001; Smithies et al., 2004), and others on stratigraphic associations (Turner et al., 2014) that are found in recent subduction-related settings. Yet many rely on distinctive relatively immobile trace elements and ratios such as Th/Nb, which are elevated in modern subduction-related magmas reflecting their distinctive negative anomalies in Nb and Ta, due to fluid-fluxed melting in the mantle wedge between
FIGURE 4 | Variations in metamorphic conditions with metamorphic ages (A) T/P values and bimodal associations through time fromZheng and Zhao (2020), (B) maximum pressure estimates in GPa through time, afterBrown (2014), and fromBrown and Johnson (2019). The crustal reworking curve is based on the Hf isotope ratios of zircons in different time slices (Dhuime et al., 2012), and the gray areas represent the ages of supercontinents plotted in Figure 1B afterCampbell and Allen (2008).
the downgoing oceanic lithosphere and overriding magmatic arc (e.g.,Zheng, 2019).
Whereas the separation of subduction-related magmas and those generated at constructive plate boundary and within-plate settings is marked in recent examples, there appears to be more of a continuum in Th/Nb ratios in Archean rocks (Moyen and Laurent, 2018). Thus, there has been some caution in assigning individual geochemical signatures to tectonic setting in Archean rocks (Pearce, 2008). Nonetheless there are differences in, for example, Th/Nb between different Archean suites, as illustrated in Figure 5. Th/Nb ratios are used here, in part because they are widely applied, but primarily just to illustrate the conclusions of the different studies cited in terms of the tectonic settings in which different Archean suites were generated. The application of Th/Nb ratios may be better suited to some magmatic suites than to others, and their use here is not to suggest that they are necessarily the most robust approach in the study of Archean mafic rocks. That will depend on the suites being studied.
Accepting that elevated Th/Nb ratios are a feature of subduction-related magmas, at least in the recent geologic past (e.g.,Pearce, 2008), Figure 5 summarizes the mean Th/Nb ratios of suites of Archean predominantly mafic rocks that appear not to have been modified significantly by crustal contamination (Smithies et al., 2004, 2005;Shimizu et al., 2005;O’Neil et al., 2007;Jenner et al., 2009, 2013;Puchtel et al., 2013;de Joux et al., 2014). In practice, most crustal contamination models result in increases in Th/Nb, because elevated values are a feature of the continental crust. Thus, the suites with low Th/Nb values, suggesting no contribution from subduction-related processes,
FIGURE 5 | Mean Th/Nb ratios of suites of Archean predominantly mafic rocks plotted against eruption ages, for suites which are thought not to have been modified significantly by crustal contamination. Green field is for elevated Th/Nb ratios, which are attributed to subduction-related processes, and the orange field is for within plate magmas. Data from:Barley et al. (1998),
Smithies et al. (2004, 2005),Shimizu et al. (2005),O’Neil et al. (2007),Jenner et al. (2009, 2013),Puchtel et al. (2013),de Joux et al. (2014). The colors in the small squares reflect the different locations plotted (afterHawkesworth et al., 2019).
are very unlikely to have had their Th/Nb ratios modified by crustal contamination.
The simplest interpretation of the data in Figure 5 is that suites of high Th/Nb (subduction-related) and low Th/Nb (non-subduction-related) magmas were generated at similar times in different locations, in the period 3.8–2.7 Ga. It is striking that all the low Th/Nb suites plotted are from dome and basin terrains characterized by vertical tectonics. For some of the older higher Th/Nb suites, it is not possible to evaluate the regional tectonic regime at the time of magmatism, because the rocks analyzed are older than the prevailing tectonic fabrics, but where that is possible the higher Th/Nb ratios are in magmatic rocks from more linear tectonic belts. More widely, it remains difficult to put the results of such detailed case studies into a more global context. Keller and Schoene (2018)used a weighted global database of basaltic rocks to conclude that there was no long-term change in the proportion of arc versus non-arc basaltic magmatism globally preserved in the rock record. This may reflect the scale of sampling since a running mean through the data in Figure 5 would also show no marked changes with geologic age.
The recognition of magmatic signatures in greenstone belt volcanic rocks similar to those observed in recent subduction-related magmas raises questions as to how similar the Archean setting(s) were to recent destructive plate margins. One aspect is how the magma water contents compare, and these can be constrained from maximum Al2O3 contents since high values reflect suppression of plagioclase crystallization, and that is a feature of magmas with higher water contents (Pichavant and Macdonald, 2007). Strikingly most greenstone belt volcanic rocks are not characterized by high Al2O3 contents, and yet these are a feature of recent island arc rocks (e.g.,Kelemen et al., 2003).
Figure 6presents the mean Th/Nb ratios of the Archean volcanic
FIGURE 6 | Variations of mean Th/Nb values for the magmatic suites plotted in Figure 5, with maximum Al2O3. The Barberton is not plotted because the
rocks are predominantly komatiites, and the Island arc suites are from the Marianas, Tonga, Aleutians and the Lesser Antilles (from the database GEOROC: http://georoc.mpch-mainz.gwdg.de/georoc), plotted at an arbitrary Th/Nb = 0.9.
suites in Figure 5 plotted against the maximum Al2O3 values, estimated from the Al2O3–SiO2variations.
The suites with higher Th/Nb ratios tend to have higher maximum Al2O3 values, consistent with higher water contents in the magmas with a subduction-related trace element signature (Figure 5). Although there are data from a relatively small number of studies, the mean maximum Al2O3 values for the within-plate and subduction-related suites are 15.1 and 17.2% suggesting water contents of<2% and <4%, respectively (Pichavant and Macdonald, 2007). Such max Al2O3 contents, and by implication water contents, are much less than those in recent island arcs, which may have 22% max Al2O3 indicating water contents in excess of 8%. The relatively low water contents in Archean volcanic rocks are in agreement with the discussion below that trondhjemitic cumulates in the Archean with>75% of albitic (An15−30) plagioclase, imply H2O contents of<4 wt% at 800–900◦
C (Laurent et al., 2020). At present, it is not clear when the water contents increased to the values now seen in recent island arcs, but that too may be linked to the onset of “cold”subduction and the generation of more mafic juvenile crust from ∼700 Ma.
Archean terrains are dominated by TTG suites typically derived from sources of altered basalt. Key features are their fractionated REE patterns and elevated Sr/Y ratios, and as these ratios are fractionated by garnet, they have been widely used to constrain the depths of melting in the generation of TTG. Moyen and Laurent (2018)highlight the geochemical diversity of TTG rocks and suggest a range of melting depths, from ca. 5 to>20 kbar. These depth estimates have been in turn the basis for tectonic models concerned with how altered basalt might have been taken down to such depths, including drip tectonics and warm subduction. Subsequently, Laurent et al. (2020) compared the geochemistry and U–Pb zircon ages of 3.46 Ga Theespruit TTG and Back Ridge Volcanic Complex (BRVC) rocks from the Kaapvaal craton. The new data include melt inclusion analyses from within pristine quartz, and comparison of the geochemical data highlight that the trondhjemites and the BRVC silicic volcanic rocks are, respectively, crystal- versus liquid-rich complementary magmatic units fractionated from similar evolved liquids. The best estimate of the parent magma composition to the TTG suites is 65% SiO2 with 1.8% K2O, Sr/Y ∼25 and La/Yb ∼15, which could have been formed at pressures of 6–12 kbar (Nagel et al., 2012;Johnson et al., 2017), corresponding to depths of a maximum 20 to 40 km. It has been argued that such depths may lie within the Archean crust, and they are too shallow to require models of drip tectonics and the like (Smithies et al., 2019).
Changes in Upper Crustal Compositions
Fine grained detrital sediments provide an accessible way of analyzing the upper continental crust (Nance and Taylor, 1976, 1977; McLennan and Taylor, 1982; Hamilton et al., 1983; O’Nions et al., 1983; Frost and Onions, 1984; Davies et al., 1985; Michard et al., 1985; Miller and O’Nions, 1985; Taylor and McLennan, 1991;Condie, 1993; Gao and Wedepohl, 1995; Jahn and Condie, 1995; Rudnick and Gao, 2003; Bindeman et al., 2016; Tang et al., 2016). Taylor and McLennan (1991)
used REE elements in continental-derived sedimentary rocks to evaluate the composition of the upper crust, and they highlighted particular differences between the composition of the Archean and the post-Archean upper crust. Archean sedimentary rocks have more fractionated REE patterns, and less of a Eu anomaly, consistent with the REE patterns of the granitoid rocks exposed at the surface. Post-Archean sedimentary rocks have higher Th/Sc ratios, Th and U contents and Th/U ratios. The post-Archean upper crust is more differentiated than the Archean upper crust, and there has been little change in the composition of the upper crustal compositions since the end of the Archean (Taylor and McLennan, 1985, and references therein).
Tang et al. (2016) extended the approach using Ni/Co and Cr/Zn ratios in sediments as an indication of the composition of the upper crust. These ratios are higher in more mafic source rocks, and there is a progressive reduction in those ratios with the depositional age of sediments from 3.2 to 2.6 Ga. The upper crust appears to have become more differentiated in this period, from ∼15% to 5% MgO in 700 Myr. These changes were modeled in terms of a 4 fold increase in the volume of felsic rocks in the upper crust, and linked to the onset of plate tectonics (Tang et al., 2016). The stable isotope composition of Ti also increases with the silica content of igneous rocks (Millet et al., 2016; Greber et al., 2017), and there is a broad increase in δ49Ti with the decreasing depositional ages on continental sediments. This is consistent with an increase in the SiO2 content of the upper crust through time from 3.5 Ga to the present day, and that the felsic component increased from 58% to 72% of the upper crust (Greber et al., 2017). Large et al. (2018)analyzed black shales ranging in age from 3.6 to 0.54 Ga, and attributed increases in Th/Cr, La/Cr and REE to increased contributions from felsic crust at the end of the Archean. However they also noted increased contributions from more mafic source rocks in the period 2.2– 1.85 Ga. Kamber (2010) argued that chemical weathering of predominantly (ultra)mafic upper continental crust is needed to explain the typical trace element signatures of Archean marine chemical sediments.
Rb/Sr ratios can be linked to Sr isotopes, and how these have changed with time. However the Rb/Sr ratios for the upper crust are difficult to determine from sediments, since Rb and Sr behave differently in surficial environments. Condie (1993) presented map normalized compositions of upper crust estimated from the proportions of common rock types, and compared those with values estimated from cratonic shales. The Rb/Sr ratios in Condie’s map normalized upper crust compositions increased from 0.25 for the Archean to 0.35 for the last 200 Myr, and they included a marked step up from 0.24 to 0.32 from the late Archean to the early Proterozoic (Figure 7). Yet, it remains difficult to infer the composition of the bulk crust from estimates of the upper crust. Rudnick and Gao (2003)present a detailed analysis of lower, middle, upper and bulk compositions, and if, and it is a big if as it remains difficult to test, it is assumed that the fractionation of the upper crust to the bulk crust at different stages in Earth history is similar to that inRudnick and Gao’s (2003)average crustal composition, the Condie upper crust values are equivalent to bulk crust Rb/Sr ratios increasing from 0.14 in the Archean to 0.20 in the recent geological past. These
FIGURE 7 | Changes in the Rb/Sr ratios of the upper crust (map normalized) (Condie, 1993) and of juvenile continental crust (Dhuime et al., 2015) with time. The upper crust estimates ofRudnick and Gao (2003)is for average crust which has an age of ∼2 Ga. The estimates of SiO2contents of juvenile
crust are taken from the co-variation of Rb/Sr and SiO2in magmatic rocks
(Dhuime et al., 2015).
estimates compare with Rb/Sr = 0.15 for the bulk continental crust at the present time, which might have an average age of ∼2 Ga (Rudnick and Gao, 2003).
Composition of New Continental Crust
Most upper crustal rocks are sedimentary and granitic rocks derived from pre-existing crustal rocks (Hutton, 1788; Figure 8). Thus, it is difficult to estimate the composition of new continental crust, and hence the tectonic settings in which the continental crust was generated. While Nd model ages are prone to significant errors (Arndt and Goldstein, 1987), they provide a broad estimate of when segments of new crust were generated. Together with Sr isotopes, they allow the Rb/Sr ratios of new crust to be calculated over the time period between crust generation and the age of any later crustal reworking event. Rb/Sr ratios in igneous rocks increase systematically with increasing silica contents (Dhuime et al., 2015), particularly at SiO2values<60%, and so the Rb/Sr ratios of new crust are also a proxy for its SiO2content.
Dhuime et al. (2015)evaluated the average composition of new continental crust using the initial Sr isotope ratios and model Nd ages of ∼13,000 whole rock samples to estimate the Rb/Sr ratios, and hence the silica content of new continental crust. The Archean data are highly scattered, however, the median
FIGURE 8 | Schematic sketch section through the continental crust, initially drawn by Tony Kemp (Hawkesworth and Kemp, 2006b).
Rb/Sr values for crust formation ages older than 3 Ga are similar to those of the mantle (Figure 7). Thus, the generation such new crust should not significantly reduce the Rb/Sr ratio of the upper mantle. In terms of silica contents, the new crust is similar to that of many greenstone belt volcanic rocks. From ∼3 Ga, there is a progressive increase in the Rb/Sr ratios of new crust to 0.08, and hence in its silica contents to ∼57% SiO2 by 1.4 Ga. New continental crust has become more intermediate in composition from ∼3 Ga, and that is likely to reflect changes in tectonic conditions.
In recent convergent margin magmatic rocks, Rb/Sr ratios increase with crustal thickness, consistent with magmas becoming more differentiated as they move through thicker sections of crust (Dhuime et al., 2015). The calculated Rb/Sr ratios of new crust of different ages can be linked to the changes in the thickness of the crust, at least at the sites of crust generation (Figure 9). New continental crust generated before 3 Ga has on average low Rb/Sr, and it is mafic, dense, and relatively thin (<20 km). New continental crust formed after 3 Ga gradually became more intermediate in composition, and hence more like the calc-alkaline andesitic crust that dominates the continental record today. This was accompanied by an increase in crustal thickness up to ∼40 km by 1.4 Ga. It is noteworthy that over the last billion years the Rb/Sr ratios of new crust, and hence its inferred silica contents, have decreased. The implication is that new crust is becoming more mafic in composition, perhaps linked to the onset of “cold”subduction, and the development of blueschists in the Late Proterozoic.
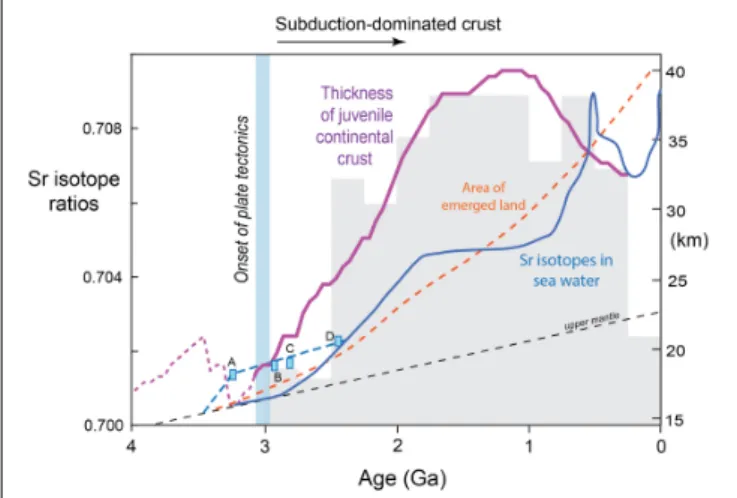
One consequence of increases in the thickness of the continental crust, is that more of it will emerge above sea level, and the models ofFlament et al. (2013)suggest that the rate of emergence is not sensitive to particular models of crustal growth (Figure 9). Crustal emergence is reflected in the proportion of large igneous provinces (LIPs) erupted on land (Kump and Barley, 2007), and there will be an increased contribution of continental crust to the chemistry of the oceans, and in particular
FIGURE 9 | Variations in the thickness of continental crust at the sites of crust generation through time, as estimated from the Rb/Sr ratios of juvenile crust (Figure 8) and the changes in Rb/Sr vs. crustal thickness in recent magmatic rocks from the Central and South America (Dhuime et al., 2015). The curve for Sr isotopes in seawater is fromShields and Veizer (2002), and the dashed portion is fromSatkoski et al. (2017). A is granular barites (Satkoski et al., 2016), B is carbonate from Red Lake, and C is from Steep Rock in the Superior Province (Satkoski et al., 2017), and D is from the Campbellrand carbonate (Kamber and Webb, 2001). The gray shaded histogram illustrates the secular variation in the proportion of subaerial LIPs (Kump and Barley, 2007). The curve for the proportion of emerged land is fromFlament et al. (2013), and it increases from 0% at 3.5 Ga to the present day value of 27.5%.
an increase in the Sr isotope ratio of seawater. Relatively few carbonate samples are available from the late Archean (Figure 9), and the dashed curve, at higher Sr isotope ratios than theShields and Veizer (2002)curve, is from Satkoski et al. (2017). At this stage there is broad agreement in the inferences drawn from the different approaches, and the inferred crustal thicknesses (at the site of crust generation) ofDhuime et al. (2015) started to increase from ∼ 20 km at ∼3 Ga. Such figures are less than those inferred for the depths of melting in the generation of TTG, which are in the range 20−40 km (section “Magmatic Associations”), but given that the source of TTG are mafic, and hence crustal, the depths of melting may primarily reflect thermal conditions rather than the thickness of the crust or the lithosphere.
Growth of the Continental Crust
Models for the evolution of the Earth have been concerned with when and how the continental crust was generated (Jacobsen and Wasserburg, 1979;O’Nions et al., 1980;O’Nions and Hamilton, 1981;Allègre, 1982; Albarède, 1998;Allègre et al., 1983;Allègre and Rousseau, 1984;Jacobsen, 1988a,b). This was in part because the depletion of the upper mantle was linked to the generation of the continental crust, and so it was important to establish the volumes of continental crust that had been generated at different times in Earth history. This was tied to the volumes of depleted mantle that resulted, whether those volumes might be restricted to the upper mantle, and the extent to which that was a constraint on layered rather than whole mantle convection. More recently there has been renewed interest because the rates
of crustal growth constrain the settings in which new continental crust was generated. The development of plate tectonics, for example, is thought to increase the rates at which continental crust is destroyed (see also section “Rates of Crustal Growth and the Onset of Plate Tectonics”), and that in turn will reduce the rates of crustal growth (Dhuime et al., 2012, 2018).
The continental crust is defined differently in different studies and using different approaches. It is the layer of granitic, sedimentary and metamorphic rocks that form the continents, including the areas of shallow seabed close to their shores, known as continental shelves. It is buoyant and high standing compared to the rocks of the oceanic crust. The constituent rocks of the continents span 4 Ga of Earth history, and have an andesitic bulk composition. In this discussion we are concerned with models for the evolution of the continental crust. These models rely on radiogenic isotope ratios, and in this context the continental crust is characterized by fractionated parent/daughter element ratios, and material that has stayed in the crust for long enough to develop distinctive isotope ratios. Partial melting of the mantle results in crust with Lu/Hf and Sm/Nd ratios less than those of the upper mantle, and we take the continental crust to have Lu/Hf and Sm/Nd ratios that are typically less than 0.18 and 0.30, and with average values of 0.081 and 0.195, respectively (Rudnick and Gao, 2003).
Mafic rocks generated in the oceans and the continents may have similar compositions and parent/daughter ratios, but they are regarded as oceanic or continental depending on the context in which they occur, i.e., location and geological setting. Whereas the continental crust includes igneous rocks that might also be generated in the oceans, they are regarded as continental if their record is retained in the continents, typically because they have been involved in subsequent geological processes, such as partial melting, metamorphism, deformation, erosion and sedimentation. Mafic and felsic lithologies may both have crustal Lu/Hf and Sm/Nd ratios, and so, as defined here, the continental crust may evolve from more mafic to more felsic compositions.
Figure 10Acontrasts the present day record of the relative volumes of rocks of different geological ages (Goodwin, 1996) with a number of models for how the volume of continental crust has changed with time. The curves are presented in three groups, and they are all anchored to the present day volume of the continental crust. The present volume of Archean crust is <10% of the present day volume, and it is unlikely that the present day volumes of say Phanerozoic and Archean crust reflect the proportions in which they were generated. We infer that significant volumes of crust have been destroyed, and the crust that is preserved today is a biased record, not least because the Archean crust is under-represented (Hawkesworth et al., 2009; Spencer et al., 2015). The Artemieva (2006) curve combines present day age and thickness data, and other curves are based on Nd isotope ratios in Australian shales, which sample relatively large volumes of upper continental crust (Allègre and Rousseau, 1984), and presently preserved volumes of rocks with different Nd or Hf crust formation ages. These curves are all based on the presently preserved proportions of rocks of either different geological or crust formation ages (Condie and Aster, 2010). Yet, as these proportions are unlikely to reflect the volumes of rock
FIGURE 10 | (A) Crustal growth curves grouped into those that rely on age distributions preserved in present day geology (dashed and red curves), those that constrain the volumes of crust in the past independent of present day age distributions (dark purple and green curves), and those that invoke relative crust volumes for a theoretical reason, such as there might be more crust generated on a hotter Earth (light purple). (B) Selected crustal growth curves suggesting that 60–80% of the present volume of the continental crust had been generated by 3 Ga, compared with the present day proportions of juvenile continental crust based on zircon crystallization ages in rocks with juvenile Nd or Hf isotope ratios (Condie and Aster, 2010). These are the starting conditions for the box model illustrated in Figure 11 (Dhuime et al., 2018).
that were present at different times in Earth history, the second group of curves is of crustal growth models independent of the relative volumes of crust of different ages preserved today.
One of the areas of debate is whether crustal growth curves are more realistic if they are based on archives in the crust, or from the mantle, and the role of the underlying assumptions in the application of such archives (Payne et al., 2016; Vervoort and Kemp, 2016;Hawkesworth et al., 2017;Korenaga, 2018a,b). Widely used crustal archives include Nd isotopes in shales, which sample the presently preserved upper crust, and zircon which tends to sample more felsic lithologies. Both are modeled in terms of the proportions of new and reworked crustal material in each time slice, and they effectively provide minimum estimates of the proportions of crust because they tend to sample more differentiated reservoirs within the continental crust (Dhuime et al., 2017;Hawkesworth et al., 2019). Mantle based archives do not sample the crust, and they rely instead on a framework in which depletion of the upper mantle is due to the generation of the continental crust (Campbell, 2003).
There is evidence that the Hf isotope ratios of the upper mantle were not depleted at least until ∼3.8 Ga (Vervoort et al., 2013, 2018;Fisher and Vervoort, 2018), and that regionally, as in the Pilbara, the mantle source for Archean crust was chondritic in composition until ∼3.3 Ga (Petersson et al., 2019). If the generation of the continental crust was responsible for depletion of the upper mantle, the presence of persistent chondritic mantle might indicate that relatively small volumes of felsic crust had been extracted. The new continental crust generated before 3 Ga appears to have been mafic in composition, and its Rb/Sr ratio was similar to that of primitive mantle (0.03, Figure 7). Simple partial melting models suggest that the minimum degrees of partial melting involved in the generation of new mafic continental crust with Rb/Sr ratios similar to that of its source is 15–20%, and at slightly higher degrees of partial melting there is also little fractionation of Sm/Nd and Lu/Hf. Thus
the mantle source of new continental crust would not become depleted in Sr, Nd and Hf isotope ratios until the degrees of melting involved in crust generation decreased sufficiently to fractionate the parent/daughter ratios, presumably as the Earth became cooler.
The second group of curves in Figure 10 seeks to estimate the volumes of continental crust at different times in Earth history, independent of the relative volumes preserved today. They are based on the proportions of reworked and juvenile crust in the zircon record (Belousova et al., 2010;Dhuime et al., 2012; Roberts and Spencer, 2015), on the secular evolution of atmospheric argon based on measurements of40Ar/36Ar in fluid inclusions in 3.5 Ga quartz (Pujol et al., 2013), and on the Nb/U ratios of Archean basalts and komatiites derived from the mantle (Campbell, 2003;Hofmann and Puchtel, 2017). A limitation with these approaches is that the curves are based on cumulative growth of the crust and sum to unity at the present day, and hence no curve can have a past volume greater than the current volume. It is also likely that such curves represent minimum estimates for the volumes of continental crust at different times (see also Guo and Korenaga, 2020), in part because the crustal material modeled has to have been in the crust for long enough to develop distinctive isotope ratios, and because zircons predominantly crystallize from relatively felsic magmas, and the record may be biased toward such differentiated lithologies. Nonetheless, these curves typically suggest that 65–75% of the present volume of the continental crust had been generated by 3 Ga (Figure 10A), and the agreement between the second group of curves, modeled on such different data sets, remains striking.
The curves ofFyfe (1978),Armstrong (1981)represent a third group (Figure 10) in which the curves are more schematic in character, but they were amongst the first to highlight that crustal growth involved both the generation of continental crust through the extraction and crystallization of magma from the mantle, and its destruction through recycling back into the mantle.
FIGURE 11 | A model for the changes in the volume and rates of generation and destruction of the continental crust through time (Dhuime et al., 2018). The model assumes that 60 to 80% of the present day volume of continental crust was established by 3 Ga, and seeks to reproduce the cumulative curve for the present day distribution of juvenile crust (Condie and Aster, 2010; Figure 10). The estimated rates of generation (green curve), destruction (red curve + shading) and net growth (blue curve) of the continental crust, are plotted in 500 Myr intervals. The inset shows the smooth evolution of the mantle temperature through time, afterHerzberg et al. (2010),Korenaga (2013).
The paucity of preserved old continental crust, as represented in the present day age distribution, reflects this recycling process. Korenaga (2018a) sought to argue that the difference between crustal growth curves based on crustal and mantle records would indicate the volumes of continental crust that had been destroyed, but that may be to confuse the messenger with the message. There is good agreement between the growth curves based on zircons and the Nb/U ratios of mantle derived basalts (Figure 10A) and the difference between the crustal growth curves in the second group, and the present day distribution of crust with different model ages may be a less ambiguous indication of the minimum volumes of crust destroyed and recycled back into the mantle (Figure 10B; Hawkesworth et al., 2013, 2016; Dhuime et al., 2017, 2018).
Dhuime et al. (2018)developed a numerical box model that allows the volume of continental crust to be greater than the present day volume at different times in the past, and explored how the rates of destruction of the continental crust changed with time (Figure 11). The model assumed that 60–80% of the present volume of the continental crust was formed by 3 Ga, and sought to reproduce the distribution of crust formation ages in the present-day continental crust (Figure 10B) after Condie and Aster (2010). Using a trial-and-error approach, the rates of crust generation and destruction for each crustal segment were adjusted at the end of a series of 500 Myr time steps and crust generation rates were assumed to vary smoothly through time. The estimated rates of crust generation broadly follow the evolution of mantle temperatures (Figure 11), but the rates of crust destruction have a marked peak in the period 3.0– 2.5 Ga before a sharp reduction and then a gradual increase in destruction rates during the Proterozoic.
The data in Figure 7 suggest that ∼3 Ga marked the transition between more mafic new crust generated before 3 Ga and younger more intermediate new crust (Dhuime et al., 2015). The high peak of destruction rate at 3.0–2.5 Ga is strikingly consistent with significant recycling of mafic/dense pre-3 Ga crust back into the mantle through subduction, such that this early predominantly mafic pre-3 Ga continental crust has been almost completely destroyed. The peak in destruction rates also appears to be a feature of the transition from a stagnant lid to a plate tectonic world (Bedard, 2018;Dhuime et al., 2018;Capitanio et al., 2019b). The reduction of the crustal growth rates at ∼3 Ga is taken to reflect the increased destruction particularly of differentiated continental crust at the onset of plate tectonics globally.
The box model for the growth of the continental crust (Dhuime et al., 2018) suggests that about 2.6–2.3 times the present volume of continental crust has been generated since the formation of the Earth, and approximately 1.6–1.3 times of this volume has been destroyed and recycled back into the mantle. The latter figure is significantly less than the figure of 2.9 times the present mass of the continental crust whichTang et al. (2015) concluded was destroyed using Sm–Eu–Gd systematics and a mass conservation model. However, asTang et al. (2015) pointed out, their estimate was primarily concerned with lower crustal recycling. Thus, the different estimates can be reconciled if the Tang et al. (2015) value primarily reflects lower crustal recycling, including mechanisms that operated in a stagnant lid world (e.g., lower crust and mantle lithosphere delamination) (see Figure 12), and theDhuime et al. (2018)estimate is primarily based on more differentiated crust recycled by subduction. This is consistent with the model ofHawkesworth and Kemp (2006a), who presented mass balance arguments that the residence times of material in the lower crust may have been as much as 6 times less than those in the upper crust.
Rates of Crustal Growth and the Onset
of Plate Tectonics
The relative ease at which more mafic denser crust may be recycled has been touched on in the previous section, and there are a number of geodynamic models in which residual lower crustal material is recycled through drips back into the mantle (Moore and Webb, 2013;Johnson et al., 2014;Rozel et al., 2017; Nebel et al., 2018; Capitanio et al., 2019a,b). Such material is typically regarded as the residual mafic material from which TTG magmas, for example, have been extracted during crustal differentiation. However, it might also include relatively dense mafic juvenile continental crust generated before 3 Ga (Figure 7). Capitanio et al. (2019b) develop a model which involves the generation of significant volumes of predominantly mafic crust in a stagnant lid regime, reflecting the higher mantle temperatures at that time, and its recycling back into the mantle (Figure 12).
TheCapitanio et al. (2019b)model treats recycling in bursts of 30–50 Myr, these destruction bursts are assumed to have been very frequent in the Hadean, and they slowed to 2–3 periods in the Archean allowing the crust to stabilize in a stagnant lid regime. The average crust destruction rates averaged over the length of the Archean before the possible onset of plate tectonics