HAL Id: hal-02903040
https://hal.archives-ouvertes.fr/hal-02903040
Submitted on 27 Oct 2020
HAL is a multi-disciplinary open access
archive for the deposit and dissemination of
sci-entific research documents, whether they are
pub-lished or not. The documents may come from
teaching and research institutions in France or
abroad, or from public or private research centers.
L’archive ouverte pluridisciplinaire HAL, est
destinée au dépôt et à la diffusion de documents
scientifiques de niveau recherche, publiés ou non,
émanant des établissements d’enseignement et de
recherche français ou étrangers, des laboratoires
publics ou privés.
in the northeastern tropical Atlantic Ocean: how close a coupling?. Annales Geophysicae, European
Geosciences Union, 2002, 20 (12), pp.2067-2076. �10.5194/angeo-20-2067-2002�. �hal-02903040�
Annales Geophysicae (2002) 20: 2067–2076 c European Geosciences Union 2002
Annales
Geophysicae
Atmospheric and oceanic dust fluxes in the northeastern tropical
Atlantic Ocean: how close a coupling?
A. Bory1, 2, F. Dulac1, C. Moulin1, I. Chiapello3, 4, P. P. Newton1, 5, W. Guelle1, C. E. Lambert1, and G. Bergametti3 1Laboratoire des Sciences du Climat et de l’Environnement, 91198 Gif-sur-Yvette, France
2Lamont-Doherty Earth Observatory of Columbia University, Palisades, NY 10964, USA
3Laboratoire Inter-Universitaire des Syst`emes Atmosph´eriques, Facult´e des Sciences et Technologies, 94010 Cr´eteil, France 4Laboratoire d’Optique Atmosph´erique, Universit´e des Sciences et Technologies de Lille 59 655 Villeneuve d’Ascq Cedex,
France
5School of Biological and Molecular Sciences, Oxford Brookes University, Headington, Oxford OX3 0BP, UK
Received: 14 November 2001 – Revised: 10 June 2002 – Accepted: 2 July 2002
Abstract. Atmospheric inputs to the ocean of dust
origi-nating from Africa are compared with downward dust flux in the oceanic water column. Atmospheric fluxes were es-timated using remote-sensing-derived dust optical thickness and parameters from a transport/deposition model (TM2z). Oceanic fluxes were measured directly over/in two regions of contrasting primary productivity of the northeastern trop-ical Atlantic (one mesotrophic and one oligotrophic, located at about 500 and 1500 km off Mauritania) underlying the off-shore dust plume. In both regions, estimates of annual at-mospheric dust inputs to the ocean surface are lower than, but of the same order of magnitude as, oceanic fluxes (49.5 and 8.8 mg.m−2.d−1in the mesotrophic and oligotrophic re-gions). Part of this mismatch may reflect both a general flaw in the dust grain size distribution used in transport mod-els, which likely underestimates large particles, and/or lateral advection to each region of dustier surface waters from up-stream, where dust deposition is higher. Higher-frequency temporal coupling between atmospheric and oceanic fluxes seems to be primary-productivity dependent, as hypothesized in previously reported studies.
Key words. Atmospheric composition and structure
(aero-sols and particles; geochemical cycles) Oceanography: bio-logical and chemical (geochemistry)
1 Introduction
Wind-blown lithogenic dust could exert a strong climate forcing via radiative scattering and condensation processes while in the atmosphere (Levin et al., 1996; Tegen et al., 1997), and also via its role in oceanic processes, for example, through iron-fertilization (Falkowski, 1998). Yet the quan-tification of today’s atmospheric dust cycle has remained largely elusive. In several regions, notably off northwest Africa, much of this dust settles to comprise the main source
Correspondence to: A. Bory ([email protected])
of lithogenic material to the ocean (Rea, 1994). However, direct measurements of dust deposition onto the ocean are scarce, and reliable estimates require continuous monitoring since only a few events may control the yearly flux (Lo¨ye-Pilot et al., 1986; Prospero et al., 1987; Bergametti et al., 1989). Such measurements are not available for the eastern tropical Atlantic Ocean. Estimates of dust fluxes in this re-gion, as well as on the global scale, have been obtained from atmospheric dust concentrations, settling rates and scaveng-ing by precipitation (Duce et al., 1991; Prospero et al., 1996), and more recently from transport models (Mahowald et al., 1999; Guelle et al., 2000; Ginoux et al., 2001).
Atmospheric dust inputs to the ocean have also been in-directly assessed from accumulation rates in sediments, and from sediment traps in the water column. These ocean-based methods are generally used to validate model outputs, assum-ing a conservative dust transfer through the water column. Such an assumption may be confounded by, for example, advective processes (e.g. Ratmeyer et al., 1999a), and the variable efficiency of biologically-mediated downward dust transport (e.g. Bory and Newton, 2000). Due to the dearth of dust deposition measurements close to ocean time-series sites, only a few studies in the Mediterranean Sea have quan-titatively explored the direct coupling of atmospheric dust deposition with fluxes in the water column (Buat-M´enard et al., 1989; Dulac et al., 1996). But results from these stud-ies are somewhat tentative, given the rather short/fragmented time-series data in the water column.
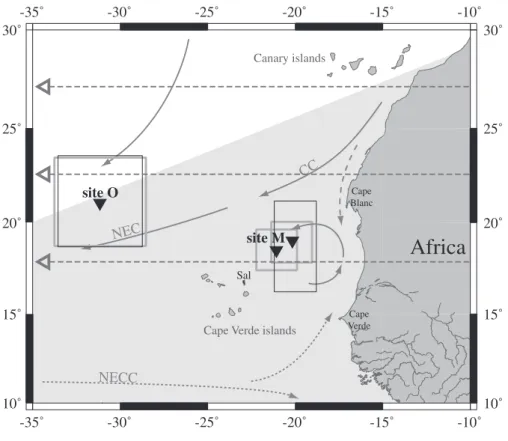
Here we present a comparison between estimates of daily inputs of atmospheric dust to the ocean and downward lithogenic particle flux in the water column over an an-nual cycle, for two regions of contrasting primary productiv-ity (i.e. biological activproductiv-ity) – mesotrophic and oligotrophic (hereinafter M and O) – downstream of Africa in the north-eastern subtropical Atlantic (Fig. 1). Atmospheric data re-sult from a combination of satellite-derived observations of the dust load in the air column and model-derived deposi-tion rates, and the oceanic data consists of time series
mea-2068 A. Bory et al.: Atmospheric and oceanic dust fluxes site O -35˚ -35˚ -30˚ -30˚ -25˚ -25˚ -20˚ -20˚ -15˚ -15˚ -10˚ -10˚ 10˚ 15˚ 20˚ 25˚ 30˚ 10˚ 15˚ 20˚ 25˚ 30˚
Africa
Cape Verde islands Canary islands NECC NEC CC site M Cape Blanc Cape Verde Sal
Fig. 1. Mooring locations (solid
tri-angles), schematic near-surface circu-lation and atmospheric dust transport pathways. Abbreviations are O, olig-otrophic; M, mesolig-otrophic; CC, Canary Current; NEC, North Equatorial Cur-rent; NECC, North Equatorial Counter Current. Solid arrows, currents: solid line, all year round; dashed line, fall, winter and spring only; dotted line,
summer and fall only. Shaded area,
winter atmospheric dust transport track. Open arrows, summer atmospheric dust transport direction. Rectangles: gray outline, Meteosat “windows”; black outline, TM2z boxes.
sured by sediment traps at several depths in the water col-umn. Temporal matches and mismatches of the atmospheric and oceanic data sets are presented to complement previously published data (Bory and Newton, 2000) in terms of under-standing the dust transfer processes from the atmosphere to the ocean water column, depending on the biological activ-ity in the surface waters. Quantitatively, atmospheric and oceanic fluxes show significant discrepancies. The possible reasons for these are discussed in detail. Surface water cir-culation may play a role. However, general flaws in dust characteristic representation in transport models – grain size in particular – are likely to be responsible for at least part of the observed difference.
2 Strategy
2.1 Oceanic flux
Time-series measurements of particle fluxes down through the water column at three sites (Fig. 1) were obtained for periods of 9–15 months during 1990–92 at 10–28 day reso-lution using deep-moored conical sediment traps within the EUMELI (EUtrophe MEsotrophe oLIgotrophe) and BOFS (Biogeochemical Ocean Flux Studies) programs of the Joint Global Ocean Flux Study (Bory and Newton, 2000). Fluxes were measured at 1000 and 2500 m depth at the oligotrophic and mesotrophic EUMELI sites (21◦030N, 31◦10 W and 18◦300N, 21◦05 W), and at 1140 and 2190 m depth at the mesotrophic BOFS site (19◦000N, 20◦10 W). All moorings
were equipped with current meters; detailed configuration, sampling and analytical procedures are described elsewhere (Bory and Newton, 2000). The lithogenic fraction of the total particle flux was estimated from Al concentration, assuming that lithogenic material is 8.4% Al (value reported for deep-sea sediment clay fraction by Turekian and Wedepohl, 1961). 2.2 Atmospheric flux
In the absence of direct measurements, atmospheric dust fall-out to the ocean surface have been computed. State-of-the-art 3-D transport models of Saharan dust still show significant deficiencies in simulating dust deposition, even with the most thorough models such as the TM2z. This dust transport and deposition model has extensively been described and tested (Balkanski et al., 1996; Schulz et al., 1996; 1998; Guelle et al., 1998a, b; 2000). Briefly, this is a global 3D, off-line, tracer transport model with a grid size of 2.5 deg and 9 sigma layers in the vertical (959, 894, 797, 635, 470, 323, 202, 110 and 40 mbar). It includes advection, convection, ver-tical diffusion, sub-grid scale verver-tical transport by turbulence and convection by clouds, sedimentation and a validated wet deposition scheme of dust particles. The dust size distribu-tion is explicitly treated. The dust emissions are computed using a detailed prognostic parameterization which has been validated independently (Marticorena and Bergametti, 1995; Marticorena et al., 1997). The transport is driven by the 12-h analyzed meteorological fields for the European Cen-tre for the Medium-range Weather Forecast (ECMWF) and run with a 1-h time step. Still, TM2z, which simulates
par-A. Bory et al.: Atmospheric and oceanic dust fluxes 2069
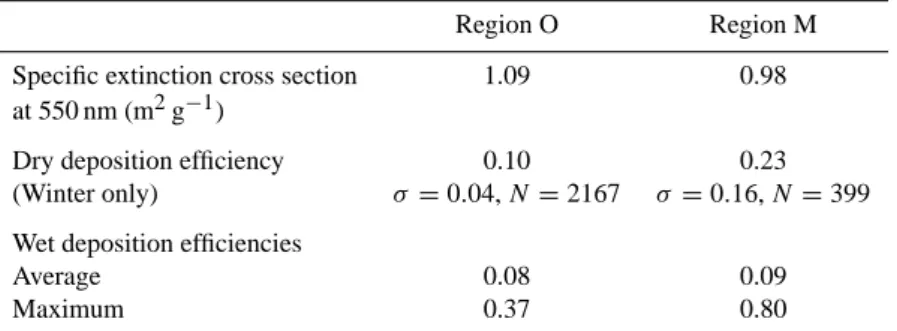
Table 1. Summary of the TM2z-derived parameters used to estimate atmospheric dust fluxes to the ocean in region O and M (corresponding boxes on the model grid are shown in Fig. 1). Specific extinction cross section and dry deposition efficiencies retrieved from TM2z correspond to “winter” (December–April) rainless days (precipitation in TM2z are model outputs from the European Centre for Medium-Range Weather
Forecast) when dust concentration was > 0.01 mg m−2and dust transport occurred below 1.2 km
Region O Region M
Specific extinction cross section 1.09 0.98
at 550 nm (m2g−1)
Dry deposition efficiency 0.10 0.23
(Winter only) σ =0.04, N = 2167 σ =0.16, N = 399
Wet deposition efficiencies
Average 0.08 0.09
Maximum 0.37 0.80
ticle size distribution evolution during transport (with a dis-tribution at the source close to that of the desert background aerosol model given by Shettle, 1984), dry and wet deposi-tion, as well as dust columnar optical thickness, misses im-portant events when day-by-day comparisons of dust depo-sition fluxes are compared to coincident observations (see Guelle et al., 2000, for details). Moreover, in summer, TM2z does not yet reproduce correctly the dust concentration pro-file above the Cape Verde region due to uncertainties in the dust source expression. High dust concentration in the first levels of the model, corresponding to the trade winds, is ob-tained, whereas the transport is known to take place mainly in the Saharan Air Layer (hereinafter SAL) above the trade wind inversion (they have a marine origin at this time of the year and relatively low dust concentration is seen at ground level; Chiapello et al., 1995). As the altitude of the dust trans-port strongly affects the gravitational deposition of the dust, modeled dry deposition in summer is, as a result, likely to contain large errors. Dust fluxes to the ocean can also be esti-mated with a better resolution using remote-sensing-derived dust optical thickness. Such an approach, which requires one to estimate dust grain size distribution, as well as dry and wet deposition coefficients, has shown encouraging results in the Mediterranean (Dulac et al., 1992b, 1996). In these studies the grain size distribution was the “desert background” given by Shettle (1984). The deposition coefficient ranges, how-ever, were poorly constrained.
Here, we combined remote-sensing-derived dust optical thickness obtained from Meteosat visible-channel numeri-cal counts (see Moulin et al., 1997a, b, for details) and pa-rameters from the transport model TM2z, to obtain the best possible estimate of dust deposition fluxes at the two ma-rine sites. Over each mooring site, M and O, the calculation of daily-averaged dust optical thickness was confined to a “window” of pixels (Fig. 1) enclosing the statistical catch-ment area of the deepest sedicatch-ment trap (i.e. the area of the ocean surface within which the trap is supposedly collecting particles; Bory and Newton, 2000). Optical thickness was vertically resolved into low and high atmospheric levels (dry
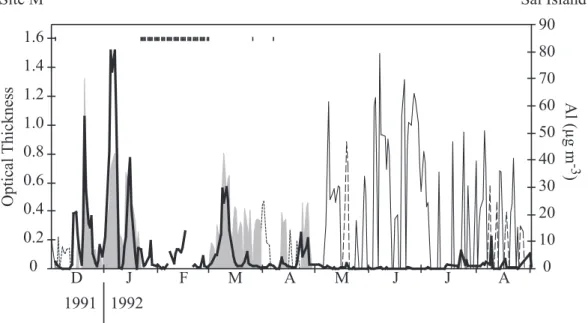
deposition is predominantly from lower levels). To achieve this resolution, for each dust “event” (a day when the opti-cal thickness was above the monthly mean and exceeds that of the two preceding and following days), the altitude of the dust was assessed by back-trajectory analyses of air masses. These analyses were carried out using TM2z in reverse mode (and were, therefore, based on ECMWF wind field analy-ses; Ramonet et al., 1996) for two levels of the atmosphere above the mooring sites, one representing the trade wind (0.4–1.2 km altitude) and the other the Saharan Air Layer (hereinafter SAL; 2.6–4.7 km altitude), both of which are well documented in terms of dust transport. During a win-ter dust transport episode, for instance, Dulac et al. (2001), using a balloon borne nephelometer, observed that most of the dust was found between 600 and 1400 m altitude, just above the marine boundary layer, and in the summer, aircraft (Carlson and Prospero, 1972) and lidar (Karyampudi et al., 1999) observations showed that the SAL is located between 1.5 and 5–6 km altitude. For a given dust event, a continental origin of the air mass in the lower level and a marine origin in the upper level indicated that dust transport occurred in the trade winds, while the reverse indicated transport in the SAL. This approach clearly reproduces the seasonal cycle of dust transport in this region, with higher concentrations at the ground/sea level between early November and mid-April (Chiapello et al., 1995) driven by the continental trade winds (i.e. the “Harmattan”). This method’s validity was further tested in region M (Fig. 1) for 1992, using measurements of daily atmospheric dust concentrations at the ground level on the nearby island of Sal in the Cape Verde Archipelago: mea-sured peaks are in excellent agreement with optical-depth-derived dust events identified in the lower atmosphere over region M using back-trajectories (Fig. 2).
In both M and O regions, calculations of atmospheric dust fluxes to the ocean surface were based on a summer/winter differentiation. For “winter” dust events (dust transport dom-inantly in the lower atmosphere), dry and wet depositions were taken into account. For “summer” dust events (dust transport predominately at altitude), dry deposition was
con-2070 A. Bory et al.: Atmospheric and oceanic dust fluxes
D
J
F
M
A
M
J
J
A
1992
1991
0
0.2
0.4
0.6
0.8
1.0
1.2
1.4
1.6
0
10
20
30
40
50
60
70
80
90
Al (µg m
-3)
Optical
Thickness
Site M
Sal Island
Fig. 2. Dust optical thickness at site M (shaded area and thin black lines) and dust concentration (expressed as Al) in the air at ground level at Sal Island (bold solid black line) between December 1991 and August 1992. Shaded area, back trajectories indicate a continental origin of the air mass in the lower atmospheric level (0.4–1.2 km) and a marine origin in the upper level (2.6–4.7 km); thin solid black line, reverse situation; dotted line, no continental origin at any of the two levels; dotted line, continental origin at both atmospheric levels. Vertical bars indicate days for which no dust optical thickness data is available.
sidered negligible (see Fig. 2 and Chiapello et al., 1995). For each site, daily atmospheric dust columnar content was es-timated using a specific extinction cross section calculated as the mean ratio of the dust optical thickness versus the at-mospheric dust columnar content, both retrieved from TM2z (Table 1). As the model satisfactorily reproduces the dust concentration and vertical distribution in winter, daily dry deposition fluxes were then determined for this period us-ing mean dry deposition efficiencies (ratio of the dry depo-sition flux versus dust columnar content) given by the model (Table 1). Daily wet deposition fluxes were determined all year round (the inaccuracy of the dust concentration profile in summer is thought to have little effect on the wet depo-sition efficiency) using the model daily wet depodepo-sition effi-ciencies (ratio of the wet deposition flux versus dust colum-nar content). When both dry and wet deposition occur, only the highest is taken into account.
3 Results and discussion
3.1 Dry versus wet dust deposition
In each region, both dry and wet deposition contribute sig-nificantly to the atmospheric-ocean dust flux (Table 2). Wet contribution to the total deposition, however, is much less than in the west tropical Atlantic (Prospero et al., 1987). This is consistent with the fact that (1) grain size distribution shifts towards smaller sizes as the distance from the source increases, and (2) dust reaching the western Atlantic is trans-ported in the SAL at high altitude. Both factors limit the
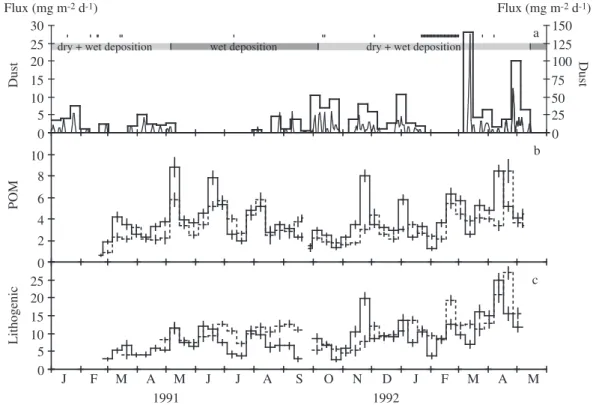
gravitational deposition of the long-range transported dust, which is, therefore, largely scavenged by rain, while coarser grain size and lower transport in the trade winds associated with little precipitation allow for dry deposition to dominate in the eastern Atlantic. Wet deposition occurs only in sum-mer in region M, but all year round in region O. Most of the dust deposition takes place during a few major events, no-tably in region M, where three dust events in winter and three in summer (Fig. 3a) – each about 4–15 days long – comprise about two-thirds of the dry and wet deposition, respectively (see Table 3 for details).
3.2 Temporal variability of atmospheric and oceanic dust fluxes
In region M, the atmospheric deposition time series is char-acterized by a large flux increase in mid-December/early-January (Fig. 3a). Dust flux is then relatively low un-til August/September, apart from a large deposition in March/April. In the underlying water column, the high-est lithogenic flux is observed at the beginning of the year (Fig. 3c), only a few weeks after the large winter atmospheric deposition event (Fig. 3a). The lithogenic flux then decreases progressively, perhaps showing two minor increases in spring and summer which coincide with large organic matter fluxes (Fig. 3b), and another increase (lower trap only) at the end of the time series (late August–early September 1991). The apparent similarities in the atmospheric dust and oceanic lithogenic time series at site M support Bory and Newton’s (2000) conclusions that a rapid down-column transfer of the
A. Bory et al.: Atmospheric and oceanic dust fluxes 2071 J F M A M J J A S D N O S A 1990 1991 20 40 60 80 100 0 20 40 60 80 100 0 50 100 150 200 0 Dust Lithogenic POM Flux (mg m-2 d-1) a c b Flux (g m-2 d-1) Dust 0.2 0.4 0.6 0.8 1 0 dry + wet deposition wet deposition
wet deposition figure 3
Fig. 3. Region M. (a) Atmospheric dust fluxes. Daily values (right-hand axis), and averages over sediment-trap sampling intervals (left-hand axis). As dust optical thickness obtained for both mooring-site “windows” (Fig. 1) were nearly identical, only results for the EUMELI site were used. Vertical bars indicate days for which no dust optical thickness data is available. (b) Particulate organic matter (POM) and (c) lithogenic fluxes in the water column (from Bory and Newton, 2000). Plain (dotted) thick and thin lines; BOFS 1140(2190) m and Eumeli 1000(2500) m depth traps, respectively.
Table 2. Mean atmospheric dust deposition and oceanic water column lithogenic fluxes during study periods at regions O and M.
Water-column fluxes are those obtained at 1000 and 1140 m depth at EUMELI and BOFS sites, respectively
Flux Region O Region M
mg m−2d−1 EUMELI: 21.03◦N–31.10◦W EUMELI: 18.30◦N-21.05◦W
BOFS: 19.00◦N–20.10◦W
Atmosphere
Dust Winter Summer Winter Summer
Dry deposition 3.7 – 19.7 –
Wet deposition 1.3 1.0 0 22.6
Mean 3.6 21.1
Prospero et al. (1996) 2.3a 16.0b
Ocean water column
Lithogenic 8.8 ± 1.1 49.5 ± 4.7
aValue given for 20/30◦N–30/40◦W.
bValue given for 10/20◦N–20/30◦W.
lithogenic material takes place, likely to be driven, as shown by these authors, by the high biological activity in surface waters and the consequent large and fast downward export of particulate organic material carrying the dust.
In region O, most of the atmospheric dust deposition oc-curs over the fall-spring period (Fig. 4a). In the water col-umn, lithogenic fluxes show no marked seasonal variability, but are generally higher in fall-spring than spring-summer
(Fig. 4c). Low-frequency variability in atmospheric dust de-position may, therefore, be reflected by water-column fluxes to some degree, but high-frequency temporal variability of lithogenic flux in the water column does not appear to be closely coupled to atmospheric inputs. Instead, the high-frequency lithogenic flux variability resembles that of the particulate organic matter (Fig. 4b; the linear regression gives a correlation coefficient r2 of 0.64), which is argued
else-2072 A. Bory et al.: Atmospheric and oceanic dust fluxes Flux (mg m-2 d-1) a c b PO M 2 4 6 8 10 0 J F M A M J J A S O N D J F M A M 1991 1992 Litho genic 5 10 15 20 25 0 Dust 5 10 15 20 25 0 30 Flux (mg m-2 d-1) Dust 25 50 75 100 125 0 150
wet deposition dry + wet deposition
dry + wet deposition
Fig. 4. Region O. As per Fig. 3 legend. (b), (c), Plain and dotted lines, Eumeli 1000 and 2500 m depth traps, respectively. Note that the time period and vertical scales are different from Fig. 3.
Table 3. Contribution of the 3 major dry and 3 major wet dust deposition events to the total dry/wet fluxes, respectively, estimated at site M during the study period
Dry deposition Wet deposition
Beginning of event 27/12/90 17/03/91 01/04/91 01/06/91 02/08/91 26/08/91
Ending of event 11/01/91 25/03/91 10/04/91 04/06/91 05/08/91 01/09/91
Fraction of the total 35% 16% 12% 10% 23% 31%
dry/wet deposition
where (Bory and Newton, 2000) to indicate that the latter limits the export of dust, and, therefore, controls its tim-ing. Such a hypothesis was supported by particle settling rates and residence time measurements, that Bory and New-ton (2000) found much slower and longer, respectively, in region O compared to M. As a result, and in contrast with re-gion M, the oceanic time series at rere-gion O does not directly reflect the atmospheric signal.
3.3 Quantitative assessment of atmospheric and oceanic fluxes
Quantitatively, the downward atmospheric and oceanic dust fluxes are of the same order of magnitude, but the former are 2–3 times lower, on average (Table 2). There seem to be three possible causes for the mismatch: (i) down-column ocean fluxes of dust have been overestimated (sampling arti-fact or advected mid-water inputs of dust); (ii) atmospheric
deposition has been underestimated; (iii) surface-water ad-vection of deposited dust.
First, a possible overestimation of down-column ocean fluxes of dust due to a bias in sediment trap efficiency seems unlikely since the later has been assessed (Bory and New-ton, 2000; Bory et al., 2001), and errors on the lithogenic flux are estimated at, on average, <10%. Moreover, the alu-minum content value chosen to estimate dust flux is in the upper range of those given in the literature (see Prospero, 1996, for review). Significant mid-water lateral advection of resuspended bottom sediment to the traps is also improba-ble, given that no nepheloid layer was recorded and that the lithogenic flux varies little between different depths (Bory and Newton, 2000).
Concerning the second of the potential causes of the ob-served mismatch, a large underestimate of the summer atmo-spheric dust input to the ocean is not supported by the dust
A. Bory et al.: Atmospheric and oceanic dust fluxes 2073
concentration time series over Sal (Chiapello et al., 1995). Although those concentration measurements do not capture the larger particles (> 20 µm) which may reach the region, those particles would represent at most 15% of the annual flux (Ratmeyer et al., 1999b) if we assume that sediment trap material grain size distribution reflects that of atmospheric dust in this range of the spectrum; this is an upper limit, al-though aggregation processes in the ocean, among other fac-tors, may lead to overestimating large particles. Therefore, the 2–3-fold difference between atmospheric and oceanic fluxes cannot be attributed to our approximation of a neg-ligible dry deposition in summer.
Ground-truthing indicates that remote measurements of dust optical depth are reliable (Moulin et al., 1997a), but converting dust optical depth to dust concentration using a constant factor incorrectly assumes that particle grain size distribution and density do not vary in time. It is difficult to assess precisely the influence of the density’s potential variability but it is not thought to be significant considering the little temporal variation in the composition of the dust in that region (Glaccum and Prospero, 1978). The absolute value used in the model is 2.65, which is in the high range of the density spectrum for atmospheric particles. Density could not, therefore, account for a possible underestimation of the atmospheric dust fluxes. Concerning the grain size distribution, the daily ratios of the atmospheric dust colum-nar content versus dust optical thickness given by the model vary only moderately, and there is no reason why the average values that are used for each site would lead to a system-atic underestimation of dust concentration. Moreover, even if the value of the specific extinction cross section of the dust model at the source (about 0.8 m2.g−1; Moulin et al., 1997a,
b) is used, the estimated atmospheric content and, therefore, deposition only increases by ∼ 20%.
Dry deposition efficiencies depend on the square of the grain size, and are proportional to density, as well as the transport altitude. The relationship between the estimated dust concentration in the lower atmosphere and the dust con-centration at ground level, as measured at Sal, appears to be variable (Fig. 2). This may reflect, among others, some vari-ation in the altitude of transport which is beyond our ana-lytical resolution. Since dry deposition depends on the alti-tude of the dust, the conversion of estimated dust concentra-tion in the lower atmosphere to dry deposiconcentra-tion, using a con-stant factor, is, therefore, an approximation, but here also, the associated uncertainties are unlikely to be systematic. In any case, in region M, for instance, the dry deposition effi-ciency that would be required for mean atmospheric fluxes to match mean oceanic fluxes during the period when atmo-spheric transport occurs in the lower atmosphere is close to one, which is unrealistic.
Uncertainties associated with wet deposition also need to be considered, in particular in region O, where precipitation is more abundant and where a wet deposition event can de-liver up to 20% of the total dust deposition during the moor-ing deployment period. Such uncertainty is large due to un-certainties in ECMF modeled precipitation data, and also as
the satellite sensor’s ability to detect dust decreases with the cloud cover, which is when wet deposition is most likely to occur. However, considering the difference in precipitation occurrence in the two regions (none in region M during win-ter, according to ECMWF outputs, which is in agreement with precipitation data obtained at Sal Island; Bernadette Chatenet, personal communication, 1997), any associated dust-flux underestimation should not affect both sites sim-ilarly and could not explain the mismatch between atmo-spheric and oceanic data sets in winter at site M, for instance. Overall, although uncertainties associated with atmo-spheric dust flux are large, they do not seem to be able to explain on their own the systematic differences between at-mospheric and oceanic fluxes in both regions, unless there is a significant bias in the modeled particle size distribution.
It is arguable, indeed, that a Shettle’s desert background-like distribution, such as the one used in the model, whose dust volume median diameter main mode (i.e. which rep-resents nearly 80% of the total volume) is found at about 2.5 µm, represents the true dust distribution at the source, or even at the sampling sites (< 1000 − 3000 km away from the source), during dust outbreaks. Shettle’s desert background distribution has been shown to represent well African dust over Corsica, matching the size distributions retrieved from cascade impactors in the 0.2–6 µm size range (Dulac et al., 1989), and leading to satisfactory estimates of dust fluxes to the ocean in this region (Dulac et al., 1992b; 1996). Shettle’s desert background distribution seems also to best simulate optical properties of the dust over the Atlantic (see Moulin et al., 2001, and references therein). However, particles with much larger grain size (whose contribution is generally dif-ficult to assess quantitatively by cascade impactors) are ob-served near sources (e.g. Shettle, 1984), but also in remote areas (see Pye, 1987, for review). One of the most strik-ing evidence of long-range transport of large particles is that of Betzer et al. (1988), who found particles up to 100 µm in diameter thousands of kilometers from their source in the Pa-cific Ocean. Microscope observations of Saharan dust gravi-tationally deposited in Corsica, for instance, have shown that particles over 10 µm in diameter can control the dry deposi-tion flux (Dulac et al., 1992a). The mass median diameter of particles in “red” rains collected in Europe is also found to be of the order of 10 µm or more (Pitty, 1968; De Falco et al., 1996; Stefano Guerzoni, personal communication, 2001; Franc¸ois Dulac, unpublished data). A few quantitative grain size measurements are also available in the study region. Chester et al. (1971, 1972), for example, found that 75–91% of dust collected in the eastern tropical Atlantic is < 4 µm. These measurements, however, were not taken following ma-jor dust storms. Prospero et al. (1970) report that coarser dust fall can occasionally occur, even reaching the western tropi-cal Atlantic. As a result of a vigorous storm in June 1967, for instance, which was associated with a rapid transport across the Atlantic, these authors report that about half of the par-ticles collected in Barbados was in the 5–20 µm fraction. It has to be pointed out, however, that these Atlantic studies were carried out using meshes, not filters, which may have
bution computed by the model may represent satisfactorily the real size distribution of the dust most of the year, chances are that the latter could be greatly underestimated during ma-jor dust outbreaks affecting both atmospheric dust concentra-tion, by underestimating the specific extinction cross section – values at 550 nm of about 0.55 and 0.7 m2.g−1have been
estimated in the Canaries (Maring et al., 2000) and Barbados (Li et al., 1996), and values even as low as 0.23 m2.g−1have been proposed 2000 km away from the dust source (Sch¨utz, 1979) – and the dry deposition efficiency calculations. As those outbreaks are responsible for a large fraction of the annual dust deposition, such a potential bias could indeed lead to a significant underestimation of the atmospheric dust flux, explaining in this study part and possibly most of the observed mismatch between atmospheric and oceanic dust fluxes. The likelihood of a significant underestimation of the contribution of large particles affecting primarily the dry de-position flux is supported by a recent study based on another transport model (Ginoux et al., 2001). In this study, unpre-dicted fluxes are thought to be due to the truncation of the larger size fraction contribution in the dust particle size range (largest simulated radius is 6 µm), yielding to as increased underestimation of deposition flux with decreasing distance to the source region.
The last hypothesis for this mismatch is surface-water ad-vection of deposited dust. Surface currents have a strong westward component (Bory et al., 2001) that could deliver downstream the highly dust-enriched waters from coastal re-gions. If the atmospheric dust deposition gradient between regions O and M is extrapolated upstream, deposition near the coast is estimated to be 2–3 times larger than in re-gion M, consistent with the factors estimated using TM2z and the model of Prospero et al. (1996). Surface-water par-ticulate aluminum (hereinafter pAl) concentration measure-ments also show a steep gradient, about 5-fold between a site 130 km west of Cape Blanc and region M (Tachikawa et al., 1999). Given the surface currents in this region, typi-cally 25–50 cm s−1, surface waters could be transported be-tween these two sites in 8–16 days, which is the likely range for dust residence time in surface waters (Bory and New-ton, 2000). Such a rapid westward transport is supported by pigment tracers and the timing of biogenic particle fluxes (Bory et al., 2001). Thus, the westward decreasing gradient in surface-water pAl concentration (also observed between regions M and O) could also account for a significant part
particular, need to be tested against measured parameters in the field. Lithogenic fluxes in the ocean water column have recently been used on broad geographical scales to validate dust transport models (e.g. Mahowald et al., 1999), assuming a simplistic conservative transfer of the dust material from the atmosphere to the oceanic water column.
The study presented here aimed at comparing estimated dust deposition to the ocean and lithogenic fluxes in the wa-ter column at a high temporal resolution over a year-cycle pe-riod in the eastern tropical Atlantic, to document dust trans-fer processes from the atmosphere to the deep ocean and to test the validity of state-of-the-art dust transport model pa-rameterization. This study was carried out in two contrasting regions in terms of biological activity, mesotrophic and olig-otrophic, which was of particular interest given the major in-fluence of the biological activity on the dust transfer through-out the water column. Comparing the best atmospheric dust deposition data set available (obtained using remote sensing derived data and parameters from the dust transport model TM2z) and lithogenic fluxes in the water column supports Bory and Newton’s (2000) hypothesis that higher-frequency temporal coupling between atmospheric and oceanic fluxes seems to be primary-productivity dependent. Most impor-tantly, this comparison shows that estimated atmospheric fluxes are 2–3 times lower that oceanic fluxes. A somewhat under-representation in dust transport models of large parti-cles, which seem to have the potential for travelling much farther than models can predict, as well as a surface currents redistribution of dust before settling, appear to be the two likely causes for the apparent mismatch between dust flux estimates to the ocean and measured dust flux in the water column in the northeastern Atlantic. Estimating the respec-tive contribution of the two identified causes is not possible here as the few evidences discussed indicate that each could have accounted for most of the mismatch.
Concerning the particle size distribution, a more elab-orated way of representing particles shape (models incor-rectly use the approximation of spherical and homogenous particles, while clay minerals generally produce flake-like particles; e.g. Bergametti et al., 1992) might help to im-prove the modeling of long-range transport of large particles. While accurate size distributions in the submicron and mi-cron ranges are essential to radiative models, a better rep-resentation of larger particle modes would be crucial to the quantitative estimates of dust flux inputs to the ocean and
A. Bory et al.: Atmospheric and oceanic dust fluxes 2075
associated iron fertilization estimates, for instance. Finally, when undertaking quantitative studies of dust cycling in re-gions with similar shallow ocean dynamics, including when attempting to validate model outputs, spatial decoupling of dust deposition and export by surface currents should be con-sidered.
Acknowledgements. We are grateful to P. Bousquet and B. Aumont for help with back-trajectory calculations and presentation, respec-tively. We thank B. Chatenet for kindly providing us with Sal Island precipitation data. A. Bory thanks MENRT for studentship support, and P. Newton thanks BMS for a visiting research fellowship. LSCE contribution 776 and LDEO contribution 6337.
Topical Editor J.-P. Duvel thanks two referees for their help in evaluating this paper.
References
Balkanski, Y., Schultz, M., Marticorena, B., Bergametti, G., Guelle, W., Dulac, F., Moulin, C., and Lambert, C.: Importance of the source term and of the size distribution to model mineral dust cycle, in: The impact of desert dust from northern Africa across the Mediterranean, (Eds) Guerzoni, S., and Chester, R., Kluwer Academic Publishers, Oristano (Sardinia), pp. 69–76, 1996. Bergametti, G., Dutot, A.-L., Buat-M´enard, P., Losno, R., and
Re-moudaki, E.: Seasonal variability of the elemental composition of atmospheric aerosol particles over the northwestern Mediter-ranean, Tellus, 41, 353–361, 1989.
Bergametti, G., Chapuis, A., Devaux, C., Druilhet, A., Fontan, J., Gaudichet, A., Gomes, L., Ide, H., Lamaud, E., Maidouka, A., and Tinga, A.: Atmosphere-soil exchange of mineral particles in a Sahelian area, in: Precipitation Scavenging and Atmosphere-Surface Exchange, (Eds) Schwartz, S. E., and Slinn, W. G. N., Hemisphere, Richland, Wa, pp. 909–920, 1992.
Betzer, P. R., Carder, K. L., Duce, R. A., Merrill, J. T., Tindale, N. W., Uematsu, M., Costello, R. W., Young, R. W., Feely, R. A., Breland, J. A., Bernstein, R. E., and Greco, A. M.: Longrange transport of giant mineral aerosol particles, Nature, 336, 568– 571, 1988.
Bory, A. J.-M. and Newton, P. P.: Transport of airborne lithogenic material down through the water column in two contrasting re-gions of the eastern subtropical North Atlantic Ocean, Global Biogeochem. Cycles, 14, 297–315, 2000.
Bory, A., Jeandel, C., Leblond, N., Vangriesheim, A., Khripounoff, A., Beaufort, L., Rabouille, C., Nicolas, E., Tachikawa, K., Etcheber, H., and Buat-M´enard, P.: Particle flux within different productivity regimes off the Mauritanian upwelling zone (EU-MELI program), Deep Sea Res. Part I, 48, 2251–2282, 2001. Buat-M´enard, P., Davies, J. E., Remoudaki, E., Miquel, J.-C.,
Bergametti, G., Lambert, C. E., Ezat, U., Qu´etel, C., La Rosa, J., and Fowler, S. W.: Non-steady-state biological removal of the at-mospheric particles from Mediterranean surface waters, Nature, 340, 131–133, 1989.
Carlson, T. N. and Prospero, J. M.: The large-scale movement of Saharan air outbreaks over the northern equatorial Atlantic, J. Appl. Meteorol., 11, 283–297, 1972.
Chester, R., Elderfield, H., and Griffin, J. J.: Dust transported in the North-east and South-east Trade Winds in the Atlantic Ocean, Nature, 233, 474–476, 1971.
Chester, R., Elderfield, H., Griffin, J. J., Johnson, L. R., and Padgham, R. C.: Eolian dust along the eastern margins of the Atlantic Ocean, Mar. Geol., 13, 91–106, 1972.
Chiapello, I., Bergametti, G., Gomes, L., and Chatenet, B.: An addi-tional low layer transport of Sahelian and Saharan dust over the north-eastern tropical Atlantic, Geophys. Res. Lett., 22, 3191– 3194, 1995.
Collins, D. R., Jonsson, H. H., Seinfeld, J. H., Flagan, R. C., Gasso, S., Hegg, D. A., Russel, P. B., Schmid, B., Livingston, J. M., Ostrom, E., Noone, K. J., Russell, L. M., and Putaud, J. P.: In situ aerosol-size distributions and clear-column radiative closure during ACE-2, Tellus, 52, 498–525, 2000.
De Falco, G., Molinaroli, E., and Rabitti, S.: Grain size analysis of aerosol and rain particles: a methodological comparison, in: The impact of desert dust from northern Africa across the Mediter-ranean, (Eds) Guerzoni, S., and Chester, R., Kluwer Academic Publishers, Oristano (Sardinia), 233–238, 1996.
Duce, R., Liss, P., Merrill, J., Atlas, E., Buat-M´enard, P., Hicks, B., Miller, J., Prospero, J., Arimoto, R., Church, T., Ellis, W., Galloway, J., Hansen, L., Jickells, T., Knap, A., Reinhardt, K., Schneider, B., Soudine, A., Tokos, J., Tsunogai, S., Wollast, R., and Zhou, M.: The atmospherical input of trace species to the world ocean, Global Biogeochem, Cycles, 5, 193–259, 1991. Dulac, F., Buat-M´enard, P., Ezat, U., Melki, S., and Bergametti, G.:
Atmospheric input of trace metals to the western Mediterranean: uncertainties in modelling dry deposition from cascade impactor data, Tellus, 41, 362–378, 1989.
Dulac, F., Bergametti, G., Losno, R., Remoudaki, E., Gomes, L., Ezat, U., and Buat-M´enard, P.: Dry deposition of mineral aerosol particles in the marine atmosphere: Significance of the large size fraction, in: Precipitation Scavenging and Atmosphere-Surface Exchange, (Eds) Schwartz, S. E., and Slinn, W. G. N., Hemi-sphere, Richland, Wa, pp. 841–854, 1992a.
Dulac, F., Tanr´e, D., Bergametti, G., Buat-M´enard, P., Desbois, M., and Sutton, D.: Assessment of the African Airborne Dust Mass Over the Western Mediterranean Sea Using Meteosat Data, J. Geophys. Res., 97, 2489–2506, 1992b.
Dulac, C., Moulin, C., Lambert, C. E., Guillard, F., Poitou, J., Guelle, W., Quetel, C. R., Schneider, X., and Ezat, U.: Quan-titative remote sensing of African dust transport to the Mediter-ranean, in: The impact of desert dust from northern Africa across the Mediterranean, (Eds) Guerzoni, S., and Chester, R., Kluwer Academic Publishers, Oristano (Sardinia), pp. 25–49, 1996. Dulac, F., Chazette, P., Gomes, L., Chatenet, B., Berger, H., and
Vinicula Dos Santos, J. M.: Aerosol profiling of the lower tro-posphere off Sahara with coupled scatter and meteorological rawindsondes, J. Atmos. Sci., 32, 1069–1086, 2001.
Falkowski, P. G.: Evolution of the nitrogen cycle and its influence
on the biological sequestration of CO2in the ocean, Nature, 387,
272–275, 1998.
Ginoux, P., Chin, M., Tegen, I., Prospero, J., Holben, B., Dubovik, O., and Lin, S.: Sources and distributions of dust aerosols simu-lated with the GOCART model, J. Geophys. Res., 106, 20 255– 20 273, 2001.
Glaccum, R. and Prospero, J.: Mineralogy and elemental
composition of mineral aerosols over North-Atlantic Ocean, Transactions-AGU, 59(4), 283, 1978.
Guelle, W., Balkanski, Y. J., Dibb, J. E., Schulz, M., and Dulac, F.: Wet deposition in a global size-dependent aerosol transport model, 2. Influence of the scavenging scheme on Pb vertical pro-files, surface concentrations and deposition, J. Geophys. Res., 103, 28 875–28 891, 1998a.
Guelle, W., Balkanski, Y. J., Schulz, M., Dulac, F., and Monfray, P.: Wet deposition in a global size-dependent aerosol transport
Levin, Z., Ganor, E., and Gladstein, V.: The effects of desert parti-cles coated with sulfate on rain formation in the eastern Mediter-ranean, J. Appl. Meteorol., 35, 1551–1523, 1996.
Li, X., Maring, H., Voss, K., and Prospero, J. M.: Dominance of mineral dust in aerosol light-scattering in the North Atlantic trade winds. Nature, 380, 416-419, 1996.
Lo¨ye-Pilot, M. D., J. M. Martin, and J. Morelli, Influence of Saha-ran dust on the rain acidity and atmospheric input to the Mediter-ranean, Nature, 321, 427–428, 1986.
Mahowald, N., Kohfeld, K., Hansson, M., Balkanski, Y., Harri-son, S. P., Prentice, I. C., Schultz, M., and Rodhe, H.: Dust sources and deposition during the last glacial maximum and cur-rent climate: A comparison of model results with paleodata from ice cores and marine sediments, J. Geophys. Res., 104, 15 895– 15 916, 1999.
Maring, H., Savoie, D., Izaguirre, M., McCormick, C., Arimoto, R., Prospero, J., and Pilinis, C.: Aerosol Physical and Optical Properties and their Relationship to Aerosol Composition in the Free Troposphere at Iza˜na, Tenerife, Canary Islands during July 1995, J. Geophys. Res., 105, 14 677–14 700, 2000.
Marticorena, B. and Bergametti, G.: Modeling the atmospherical dust cycle: 1. Design of a soil-derived dust emission scheme, J. Geophys. Res., 100, 16 415–16 430, 1995.
Marticorena, B., Bergametti, G., Aumont, B., Callot, Y., NDoume, C., and Legrand, M.: Modeling the atmospheric dust cycle. 2. Simulation of Saharan dust sources, J. Geophys. Res., 102, 4387–4404, 1997.
Moulin, C., Dulac, F., Lambert, C. E., Chazette, P., Jankowiac, I., Chatenet, B., and Lavenu, F.: Long-term daily monitoring of Sa-haran dust load over ocean using Meteosat ISCCP-B2 data 2. Accuracy of the method and validation using Sun photometer measurements, J. Geophys. Res., 102, 16 959–16 969, 1997a. Moulin, C., Guillard, F., Dulac, F., and Lambert, C. E.: Long-term
daily monitoring of Saharan dust load over marine areas using Meteosat ISCCP-B2 data, 1, Methodology and preliminary re-sults for 1983–1994 in the Mediterranean, J. Geophys. Res., 102, 16 947–16 958, 1997b.
Moulin, C., Gordon, H. R., Banzon, V. F., and Evans, R. H.: As-sessment of Saharan dust absorption in the visible from SeaWiFS imagery, J. Geophys. Res., 106, 18 239–18 250, 2001.
Pitty, A. F.: Particle size of the Saharan dust which fell in Britain in July 1968. Nature, 220, 364–365, 1968.
Prospero, J. M., Bonatti, E., Schubert, C., and Carlson, T. N.: Dust in the Caribbean atmosphere traced to an African dust storm, Earth Planet. Sci. Lett., 9, 287–293, 1970.
Prospero, J., Nees, R. T., and Uematsu, M.: Deposition rate of
par-Ramonet, M., Le Roulley, J. C., Bousquet, P., and Monfray, P.: Radon-222 measurements during the Tropoz II campaign and comparison with a global atmospheric transport model, J. Atmos. Chem., 23, 107–136, 1996.
Ratmeyer, V., Fischer, G., and Wefer, G.: Lithogenic particle fluxes and grain size distributions in the deep ocean off NW Africa: Im-plications for seasonal changes of aeolian dust input and down-ward transport, Deep Sea Res. Part I, 46, 1289–1337, 1999a. Ratmeyer, V., Balzer, W., Bergametti, G., Chiapello, I., Fischer, G.,
and Wyputta, U.: Impact of mineral dust on deep-ocean particle flux in the eastern subtropical Atlantic Ocean, Mar. Geol., 159, 241–252, 1999b.
Rea, D.: The paleoclimatic record provided by eolian deposition in the deep sea: The geologic history of wind, Rev. Geophys., 32, 159–195, 1994.
Schulz, M., Balkanski, Y., Guelle, W., Dulac, F., Moulin, C., and Lambert, C. E.: Relevant components to model the Saharan dust plume pattern over the Mediterranean Sea, in: The impact of desert dust from northern Africa across the Mediterranean, (Eds) Guerzoni, S., and Chester, R., Kluwer Academic Publishers, Oristano (Sardinia), pp. 51–58, 1996.
Schulz, M., Balkanski, Y., Guelle, W., and Dulac, F.: Role
of aerosol size distribution and source location in a three-dimensional simulation of a Saharan dust episode tested against satellite-derived optical thickness, J. Geophys. Res., 103, 10 579–10 592, 1998.
Sch¨utz, L.: Saharan dust transport over the North Atlantic Ocean – Model calculations and measurements, in: Saharan dust (Mo-bilization, Transport, Deposition), (Ed) Morales, C., John Wiley & Sons, Chichester-New York-Brisbane-Toronto, pp. 267–277, 1979.
Shettle, E. P.: Optical and radiative properties of a desert aerosol model, in: Proc. symposium on radiation in the atmosphere, (Eds) Fiocco, G. and Deepak, A., Hampton, Va., pp. 74–77, 1984.
Tachikawa, K., Jeandel, C., Vangriesheim, A., and Dupr´e, B.: Dis-tribution of rare earth elements and neodymium isotopes in sus-pended particles of the tropical Atlantic Ocean (EUMELI site), Deep Sea Research I, 46, 733–756, 1999.
Tegen, I., Holrigl, P., Chin, M., Jacob, D., and Penner, J.: Contri-bution of different aerosol species to the global aerosol extinc-tion optical thickness: Estimates from model results, J. Geophys. Res., 102, 23 895–23 915, 1997.
Turekian, K. K. and Wedepohl, K. H.: Distribution of the elements in some major units of the Earth’s crust, Geol. Soc. Am. Bull., 72, 175–192, 1961.