HAL Id: hal-00327953
https://hal.archives-ouvertes.fr/hal-00327953
Submitted on 1 Aug 2005HAL is a multi-disciplinary open access
archive for the deposit and dissemination of sci-entific research documents, whether they are pub-lished or not. The documents may come from teaching and research institutions in France or abroad, or from public or private research centers.
L’archive ouverte pluridisciplinaire HAL, est destinée au dépôt et à la diffusion de documents scientifiques de niveau recherche, publiés ou non, émanant des établissements d’enseignement et de recherche français ou étrangers, des laboratoires publics ou privés.
Transport and mixing zone of desert dust and sulphate
over Tropical Africa and the Atlantic Ocean region
K. V. Desboeufs, G. Cautenet
To cite this version:
K. V. Desboeufs, G. Cautenet. Transport and mixing zone of desert dust and sulphate over Tropical Africa and the Atlantic Ocean region. Atmospheric Chemistry and Physics Discussions, European Geosciences Union, 2005, 5 (4), pp.5615-5644. �hal-00327953�
ACPD
5, 5615–5644, 2005Transport and mixing zone of dust and
sulphate K. V. Desboeufs and G. Cautenet Title Page Abstract Introduction Conclusions References Tables Figures J I J I Back Close
Full Screen / Esc
Print Version Interactive Discussion
EGU
Atmos. Chem. Phys. Discuss., 5, 5615–5644, 2005 www.atmos-chem-phys.org/acpd/5/5615/
SRef-ID: 1680-7375/acpd/2005-5-5615 European Geosciences Union
Atmospheric Chemistry and Physics Discussions
Transport and mixing zone of desert dust
and sulphate over Tropical Africa and the
Atlantic Ocean region
K. V. Desboeufs1and G. Cautenet2
1
LISA, UMR 7583, Universit ´es Paris 7 et 12, Cr ´eteil, France
2
LaMP, UMR 6026, Universit ´e Clermont 2, Aubi `ere, France
Received: 5 November 2004 – Accepted: 24 February 2005 – Published: 1 August 2005 Correspondence to: K. V. Desboeufs (desboeufs@lisa.univ-paris12.fr)
ACPD
5, 5615–5644, 2005Transport and mixing zone of dust and
sulphate K. V. Desboeufs and G. Cautenet Title Page Abstract Introduction Conclusions References Tables Figures J I J I Back Close
Full Screen / Esc
Print Version Interactive Discussion
EGU
Abstract
The potentiality of dust particles to mix with sulphate over Tropical Africa and the At-lantic Ocean is investigated by combining a meso-scale meteorological model with a dust production model and an SO2 emission database. This mixing process study is based on a qualitative approach where the reactivity of dust is estimated from its cal-5
cite content, which is the main mineral known to be reactive with sulphur species. We are presenting a 1-month simulation (January 1993). Our results show that the regions Northern Egypt and Libya (NEL), Western Sahara (WS) and Sahel (S) are the major sources of dust plumes. The simulated dust loading is in agreement with the measured data close to the African coasts. The Mediterranean and Maghreb regions are highly 10
influenced by European sources of sulphate, for which the simulated concentrations are consistent with the observed trends. This simplified study identifies two zones that favour the mixing process between dust and sulphate: 1. the Eastern Mediterranean basin due to the concomitance of high concentrations of dust and sulphate and 2. the North-Eastern Atlantic Ocean due to the high amount of calcite in the ejected dust 15
which is very reactive. Thus, we assume that the coating process takes place mainly in these regions and the sulphate-coated dust found on the other side of the Atlantic Ocean (Caribbean and American coasts) is principally due to this phenomenon.
1. Introduction
Atmospheric aerosols play an important role in climate by scattering and absorbing ra-20
diation, and also by governing the formation, life-time and albedo of clouds. Estimates of the direct aerosol effect indicate that anthropogenic non-sea-salt sulphate (nss SO2−4 ) causes substantial cooling in the Northern Hemisphere (e.g. Hegg et al., 1993). Optical measurements in the North Atlantic Ocean, where transported African dust, European anthropogenically emitted pollutants, sea salt and aerosols from biomass 25
ACPD
5, 5615–5644, 2005Transport and mixing zone of dust and
sulphate K. V. Desboeufs and G. Cautenet Title Page Abstract Introduction Conclusions References Tables Figures J I J I Back Close
Full Screen / Esc
Print Version Interactive Discussion
EGU
moderately dusty and even clear situations (Chiapello et al., 1999; Li et al., 1996; Mar-ing et al., 2000). On the contrary, hygroscopic sulphates and sea salt are known to be particularly efficient as cloud condensation nuclei whereas the indirect effect of mineral dust is uncertain (Buseck et al., 1999; Ghan et al., 2001; Br ´eon et al., 2002), at least in its native (non-weathered) state.
5
The Sahara and Sahel regions are probably the world’s largest sources of Aeolian soil dust. The transport mechanisms of African dust are well-understood and show a seasonal and spatial variability of the mineral dust over the Atlantic Ocean (e.g. Pros-pero, 1999). The meteorological conditions over Western Europe are favourable to the pollutant transport towards the Atlantic such as non-sea-salt sulphate. Several obser-10
vations emphasize that mineral dust is likely being internally mixed with sulphate either during its transport in the troposphere over the Atlantic Ocean (Chiapello et al., 1996; Li-Jones et al., 1998; Maring et al., 2000; Putaud et al., 2000), or generally in regions where polluted air masses are mixed with dust plumes (Anderson et al., 1996; Levin et al., 1996; Buseck et al., 1999; Davis et al., 2000; Gao et al., 2001; Trochkine et al., 15
2003). The resulting coating seems to be the result of different heterogeneous chem-ical processes such as uptake of gaseous SO2 onto the aerosol surface (Dentener et al., 1996), collision/coalescence between dust and aerosol sulphate (Mori et al., 1998), and aqueous phase oxidation of SO2during cloud processes (Levin et al., 1990). This mixing process seems to greatly modify the dust and sulphate radiative effect (Li-Jones 20
et al., 1998; McGovern et al., 1999), in particular since the more hygroscopic dust could have an impact on the cloud cover (Levin et al., 1996; Rosenfeld et al., 2001; Pradelle et al., 2002).
The purpose of this paper is to investigate the trend of dust/sulphate mixing pro-cesses on desert particles transported over the North Atlantic Ocean from the Sahara 25
and Sahel regions. Our approach is principally qualitative in order to identify the syn-optic situation where dust is likely to be coated by sulphate. This is accomplished by coupling a meso-scale meteorological model with a dust production model and an SO2 emission database. The dust and sulphate transport are consequently modelled. In
ACPD
5, 5615–5644, 2005Transport and mixing zone of dust and
sulphate K. V. Desboeufs and G. Cautenet Title Page Abstract Introduction Conclusions References Tables Figures J I J I Back Close
Full Screen / Esc
Print Version Interactive Discussion
EGU
the model, the chemical mixing process is not directly taken into account but evaluated by the modification of the dust calcite content.
2. Model description
2.1. Transport model
The Regional Atmospheric Modelling System (RAMS; Cotton et al., 2003) is used to 5
simulate the meteorological conditions and the subsequent atmospheric transport of mineral dust and SO2−4 over the Atlantic Ocean from Europe and North Africa. The selected grid for the simulation spreads from 18◦W to 60◦E and from 41◦N to 5◦N to include all sources of dust and SO2 in our study. The horizontal grid resolution is 100 km. The vertical resolution is divided into 30 expanding levels and reaches 21 km 10
above surface. The studied area is presented in Fig. 1. Four sites are chosen to estimate the dust concentrations in the dusty zones: Canary Island (4◦W, 30◦N), East-ern Mediterranean (30◦E, 35◦N), Sal Island (in Capo Verde Islands, 23◦W, 16◦N) and Guinea Gulf (1◦W, 6◦N). January is a typical period for dust plumes over the Atlantic Ocean. The model runs presented in this paper are initialized and laterally forced using 15
the January 1993 ECMWF database.
The microphysical parameterisation is considered using the relatively simple Kuo-Arakawa scheme: the condensation of water vapour, e.g. in the form of clouds, occurs whenever supersaturation is attained. The results obtained for the simulated cloud cover are in a good agreement with the observations for the investigated period. In this 20
stratiform cover, the precipitated cloud water, i.e. rainwater, is assumed to be equal to 10% of the total condensed cloud water. Moreover, for each pixel where condensed water is formed, it is presumed that all the particles are removed by rainwater. Finally, we assume that the liquid phase is also very efficient in removing SO2quickly.
ACPD
5, 5615–5644, 2005Transport and mixing zone of dust and
sulphate K. V. Desboeufs and G. Cautenet Title Page Abstract Introduction Conclusions References Tables Figures J I J I Back Close
Full Screen / Esc
Print Version Interactive Discussion
EGU
2.2. SO2source
Up to now, no detailed temporal emission inventory exists for this region. However, the annual EDGAR database (Olivier et al., 1996) is well-adapted to our requirements since the major SO2source in our working grid and in January, is the European source, which has no marked seasonal behaviour. Therefore, we use this database as SO2 source 5
(Fig. 1). Indeed, the biomass fires, which are predominant in this season, are not as-sumed to be a major source of SO2. The simulation starts with sulphur concentrations being equal to zero for the entire region. After one week, sulphur mass concentrations become principally dependent on the meteorology and quasi-independent of the initial conditions over the studied zone. In consequence, we focuse our study on the last 10
three weeks of January. 2.3. African dust source
Mineral aerosol production is modelled by the Dust Production Model (DPM) devel-oped by Marticorena and Bergametti (1995). This DPM is coupled online with the RAMS model according to a method described in Cautenet et al. (2000). The word 15
“online” means here that the surface wind used as DPM input is continuously pro-vided by RAMS itself. The dust production is based on physical phenomena such as creeping, saltation and sandblasting of soil aggregates (Gomes et al., 1990; Alfaro et al., 1998). The mobilized mass is subsequently distributed over 10 size classes from 0.1 µm to 17 µm in radius. Previous studies on mixing processes of terrestrial particles 20
reported that SO2or sulphate reacts with water-soluble inorganic components, which are carbonate/bicarbonate of mineral dust (Dentener et al., 1996; B ¨oke et al., 1999; Song and Carmichael, 1999). The mineral composition of Saharan dust over North Africa and the Atlantic Ocean is found to consist of mica, quartz, kaolinite, chlorite, montmorillonite, plagioclase, microcline and calcite (Chester et al., 1972; Drees et al., 25
1993; Glaccum and Prospero, 1980). Thus, the most likely mineral for carbonate is calcite (CaCO3). In order to estimate the extend to which dust is mixed with sulphate,
ACPD
5, 5615–5644, 2005Transport and mixing zone of dust and
sulphate K. V. Desboeufs and G. Cautenet Title Page Abstract Introduction Conclusions References Tables Figures J I J I Back Close
Full Screen / Esc
Print Version Interactive Discussion
EGU
we use the calcite content of mineral aerosol as the principal mixing contributor during its transport. The initial aerosol calcite composition is derived from data on mineral composition of African soil (Fig. 2; Claquin et al., 1999), since the calcite/quartz ratio in soil and dust are in good agreement.
2.4. Reactivity assumptions 5
The purpose of this work is to estimate, in a semi-quantitative way, the influence of synoptic conditions on the coating of African dust by anthropogenic sulphate during its transport over the Atlantic Ocean. Therefore, this simplified study focuses mainly on emission and transport of considered species and ignores the complex chemical processes. In consequence, we neglect the details of the SO2oxidation processes to 10
produce sulphate. It is known that the conversion of SO2to sulphate is fast and almost complete (Restad et al., 1998). Thus, we consider that SO2 is completely and imme-diately oxidised to sulphate from emission. This kind of simplification was also used to simulate meso-scale transport during INDOEX (Minvielle et al., 2004) and the results are in good agreement with aircraft measurements. The SO2−4 mass concentrations 15
are derived by multiplying SO2mass concentrations by a factor of 1.5.
The chemical reaction kinetics between SO2or SO2−4 and calcite are not considered here. We assume a reactivity with a ratio 1:1 between sulphate and dust calcite mass concentrations to form a coating phase, gypsum, according to:
CaCO3+ SO2−4 → CaSO4+ CO2−3 (R1)
20
This way, the coating phase mass on the dust particles corresponds with the sulphate mass removed from the atmosphere. Considering our assumption on the reactivity, this sulphate mass is an estimation of the maximum value of sulphate that can be removed by coating process. Moreover, the reactivity module is coupled off-line with the transport simulation. Thus, the results presented here characterize the zones where 25
ACPD
5, 5615–5644, 2005Transport and mixing zone of dust and
sulphate K. V. Desboeufs and G. Cautenet Title Page Abstract Introduction Conclusions References Tables Figures J I J I Back Close
Full Screen / Esc
Print Version Interactive Discussion
EGU
3. Results and discussion
3.1. Dust transport
The values of mass fluxes evidence three active zones with regard to dust rising which are situated in the North of Egypt and Libya (NEL), Western Sahara (WS) and Sahel (S), with the latter extending from Mali to Chad (Fig. 3). These sources have early been 5
identified. Thus, it was found that the dust loading over the Sahel region can exceed that over the Sahara, notably during drought years (Middleton, 1985; N’Tchayi et al., 1997). Furthermore, the Egyptian and Lybian deserts constitute a dust production source as important as West and North Sahara (Singer et al., 2003). From these zones, three important events of dust expulsion were noticeable during January 1993 10
(Fig. 3):
– The first event, between 4 and 11 January, is essentially related to dust
pro-duction from the NEL region, and expulsions are concentrated over the Eastern Mediterranean. Even though the NEL region was shown to be a persistent source (Prospero, 1999), the dust events over the Eeastern Mediterranean are rare in 15
winter because the Mediterranean cyclones in the region lead to trajectories that originate in the North and are likely to generate frequent precipitation (Kubilay et al., 2000). Thus, while the dust loading near the source is high (in average on this event: 700 µg m−3), it is only about 10 µg m−3 in the Eastern Mediterranean according to the literature (Table 1).
20
– The second event, observed from 6 to 10 January, includes Western Saharan
sources, particularly Mauritania. It principally extents towards the North over the Canary and Azores Islands and is accompanied by less extensive ejections to-wards the Capo Verde Islands, the tropical Atlantic Ocean and over Guinea. This dust plume persists until 16 January and finally reaches the Caribbean Sea. In 25
January, dust events in the Capo Verde zone were identified to come from the South-western Sahara (Chiapello et al., 1997). High frequency of Saharan dust
ACPD
5, 5615–5644, 2005Transport and mixing zone of dust and
sulphate K. V. Desboeufs and G. Cautenet Title Page Abstract Introduction Conclusions References Tables Figures J I J I Back Close
Full Screen / Esc
Print Version Interactive Discussion
EGU
inputs (42%) on the Canary Islands is produced during winter (Torres-Padron, 2002). In winter, a low-layer dust in the Saharan Air Layer (SAL) transported by the trade winds extends into a south-westerly direction and is located over the West African coast at latitudes between about 10◦ and 20◦ north (Sch ¨utz, 1980; Chiapello et al., 1999). This low-altitude transport is also observed in our results 5
(Fig. 4). During these synoptic conditions, dust concentrations in the Capo Verde and Canary Island regions are important in January, with typical values during dust events around 300 to 800 µg m−3(Chiapello et al., 1997; Viana et al., 2002). Our simulations are in agreement with these values since we found maximum a dust loading of 250 and 600 µg m−3, respectively, for these two archipelagos (Ta-10
ble 1). On the contrary, low dust concentrations are observed over Barbados in January, with measured values generally less than 10 µg m−3 (Prospero et al., 1999). In our simulation, the maximum of dust loading transported through the Atlantic Ocean up to 20◦N/50◦W is around 2 µg m−3at this location.
– The third dust expulsion, between 16 and 25 January, is issued from the Sahelian
15
region, and spreads out to the north over the Canary Island up to the coasts of Spain and to the west, as well as to the south over the Gulf of Guinea up to the Brazilian coasts. The Sahel was identified as a source of dust outbreaks in the Canary Island and the Gulf of Guinea (Bergametti et al., 1989; N’Tchayi et al., 1997) due to the Harmattan wind blowing from the Sahara across the semi-20
arid Sahel towards the Guinea coast of Africa. The thus-transported mineral dust produces dry haze over the Gulf of Guinea and the adjacent lands. The frequency of dust in January is higher in the Sahel, and the Harmattan winds transport the dust from the sources southwards into the Sahara and Sahel regions (N’Tchayi et al., 1997). The modelled dust loadings are in good agreement with the field 25
measurements (Table 1). Moreover, our results show a good representation of the altitude of dust transport by the Harmattan winds located above 1000 m (Kalu, 1979), as displayed in Fig. 4.
ACPD
5, 5615–5644, 2005Transport and mixing zone of dust and
sulphate K. V. Desboeufs and G. Cautenet Title Page Abstract Introduction Conclusions References Tables Figures J I J I Back Close
Full Screen / Esc
Print Version Interactive Discussion
EGU
We have verified that these observations are in agreement with the IDDI images cal-culated from the Meteosat infrared data according to Legrand et al. (2001) as well as with the colour composition derived from the Meteosat visible channel which was pro-cessed according to the method by Jankowiak and Tanr ´e (1992). We briefly recall that the IDDI method is based upon the day-by-day analysis of the 12:00 UTC pictures of a 5
given scene during a 2-week period in the infrared (IR) Meteosat channel (8–12 µm). The maximum IR radiative count is ascribed to the surface thermal response, i.e. to a minimum atmospheric effect. The process eliminates the effect of short-lived phenom-ena such as clouds, in so far as they do not represent a permanent layer. The radiative IR count difference (decrease) at 12:00 h as compared to the maximum is ascribed to 10
the atmospheric dust load. This allows to derive a dust index, the so-called Infrared Difference Dust Index (IDDI). This index ranges from 0 IR count for a clear atmosphere to values as large as 35 IR counts or even more in case of high dust contents. This method gives evidence of a dust rise over a land surface. Moreover, the comparison of our results (Table 1) with those found in the literature emphasizes that the mod-15
elled dust loading is generally in agreement with the measured data. The dust fluxes averaged for each event present maximum values of 3800, 64 and 57 µg m−2 s−1 in the respective source zones. These values correspond to the fluxes measured dur-ing dust haze events in the source zones of Tropical Africa (Gillies et al., 1996; Rajot et al., 2003). Finally, the simulations emphasize that the NEL is a persistently active 20
region in January which induces a high atmospheric loading in the Eastern Mediter-ranean region. The Saharan and Sahelian sources have more sporadic and weaker contributions to the dust production in January. However, contrary to the former, these latter dust events associated with these sources extend rather over the African and At-lantic regions. These results for the dust transport correspond with many of the familiar 25
features of the Saharan dust plume in winter. Thus, January 1993 presents the di ffer-ent typical scenarios met in winter in this region, and in this regard, it is particularly interesting for this study.
ACPD
5, 5615–5644, 2005Transport and mixing zone of dust and
sulphate K. V. Desboeufs and G. Cautenet Title Page Abstract Introduction Conclusions References Tables Figures J I J I Back Close
Full Screen / Esc
Print Version Interactive Discussion
EGU
The distinction among dust calcite content as a function of both dust source and transport is also important in this study. In Fig. 2, it appears that the Sahelian dust sources indicate a typically low calcite content (<10%). On the contrary, the NEL source corresponds with soils richer in calcite and, hence, could be at the origin of dust plumes which could strongly react in the presence of sulphate. Therefore, we 5
have estimated the proportion of transported calcite for each dust event. In Fig. 3, we have reported the zone where the vertically integrated calcite loading (or calcite col-umn burden) is superior to 2.10−2µg m−2. Contrary to what one would expect from source analysis, it appears that the dust event during which the calcite plume is more extended corresponds with the second and third episodes which are Saharo-Sahelian 10
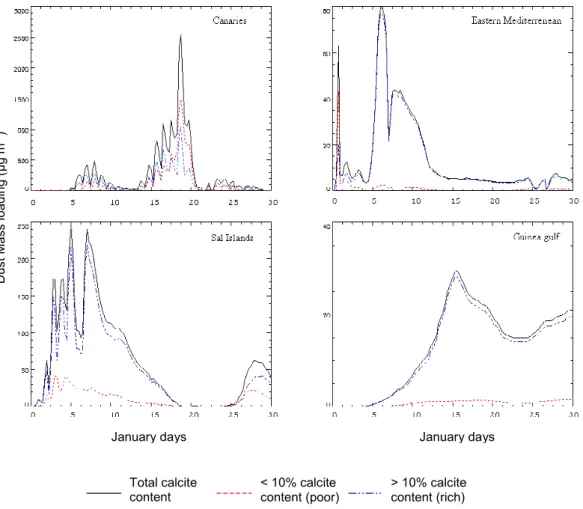
dust expulsions. We found the largest ratio between poor- and rich-calcite dust over the North and tropical Atlantic Ocean on their main ways of transport (Fig. 5). Thus, during the second and the third episode, the percentage of poor-calcite reaches 40% and 70% over the Canary and Sal Islands, respectively, whereas this percentage does not exceed 7% in the Gulf of Guinea and over the Eastern Mediterranean. This dif-15
ference in dust calcite content coming from the same sources is probably due to the passage of dust plumes over Northern Morocco and Algeria as well as over the coasts of Mauritania and Senegal where the soils are rich in calcite. On the contrary, the regions crossed over by dust expulsions that reach the Gulf of Guinea present low cal-cite contents. Finally, according to the observations of the calcal-cite content in the three 20
typical dust events studied here, the episodes reaching the Canary Island appear to be the most favourable to mixing phenomena, since they couple high dust loading and rich-calcite dust.
3.2. Sulphate transport
According to the EDGAR database, the main sources of sulphate are situated in Eu-25
rope and North Africa, in the Gulf of Guinea, and in Brazil. European pollution is brought over the Mediterranean and provides a supply of sulphate first in North Africa and then particularly in Algeria, Tunisia and Libya (Fig. 6). The maximum
concen-ACPD
5, 5615–5644, 2005Transport and mixing zone of dust and
sulphate K. V. Desboeufs and G. Cautenet Title Page Abstract Introduction Conclusions References Tables Figures J I J I Back Close
Full Screen / Esc
Print Version Interactive Discussion
EGU
trations of sulphate found in the Maghreb zone are about 20 µg m−3. These values are much lower than the dust concentrations, but remain constant throughout January. Sulphate concentrations of this order of magnitude are also observed in the equatorial Atlantic Ocean. These equatorial amounts are probably issued from Brazilian sources, and sulphate is concentrated in this zone due to the position of the ITCZ at this time of 5
year. The sulphate transport in the rest of the modelled area is low, and the background level is around 2 µg m−3. Along the main ways of dust expulsion, it appears that the sites which present the higher sulphate concentrations are the Canary Island (between 5 and 12 January and the Eastern Mediterranean (15 January until end of January; Fig. 7). These high sulphate supplies correspond with the 2nd and 3rd dust expulsion. 10
Under local and Brazilian influence, the sulphate concentrations of the Gulf of Guinea are steady around 4 µg m−3 over the studied period. The expulsion over the Tropical Atlantic Ocean is the less affected by sulphate pollution, with an average concentration of 2 µg m−3 at Sal Island in the lower layers of the atmosphere.
Literature values indicate background levels lower than 1 µg m−3 for non sea-salt 15
sulphate when an European influence is absent (Harrison et al., 1996; McGovern et al., 1999; Johansen et al., 2000; Maring et al., 2000). Measured concentrations in air masses over the Canary Island coming from Europe and passing over the Mediter-ranean Sea and North Africa vary from over 1 to nearly 7 µg m−3 (Van Dingenen et al., 1995; McGovern et al., 1999; Maring et al., 2000). Our results agree with the 20
measured trends which suggest a low influence of European pollution on the Tropical Atlantic Ocean in winter. Several observations (e.g., Chiapello et al., 1999) noted that the transport of sulphate from Europe over North Africa towards the Atlantic Ocean is associated with synoptic conditions of dust travel. Thus, our results show that sulphate is typically transported in the same lower tropospheric layers as dust (Fig. 4).
ACPD
5, 5615–5644, 2005Transport and mixing zone of dust and
sulphate K. V. Desboeufs and G. Cautenet Title Page Abstract Introduction Conclusions References Tables Figures J I J I Back Close
Full Screen / Esc
Print Version Interactive Discussion
EGU
3.3. Mixing zone
Figure 8 gives the concentrations of dust affected by the mixing process. The thick line demarcates the region where the mixing is limited by calcite content or by sulphate concentrations. Two areas are evident among the potential regions where dust and sul-phate mixing process could be predominant: (i) the Western Sahara up to the Canary 5
Island and (ii) the Eastern Mediterranean (Fig. 8). These zones correspond with the main dust expulsions during the month of January (at least in 1993). On the contrary, the two other ways of dust transport in this season, i.e. the Tropical Atlantic Ocean and the Gulf of Guinea, are less affected by the coating of dust by sulphate (Fig. 8). For the Tropical Atlantic Ocean (Sal Island), Fig. 6 indicates that sulphate concentrations are 10
low in comparison to the other ways of dust transport. Moreover, the dust is poor in cal-cite in this region (Fig. 5) and is, therefore, little reactive, even in the presence of SO2−4 . The Gulf of Guinea is also a region where dust is poorly reactive (Fig. 5). Furthermore, it appears that the altitude where the majority of dust is transported (between 1000 and 3000 m) is above the transport altitude of sulphate coming from local and Brazil-15
ian sources, and is, therefore, not carried by Harmattan winds (Fig. 4). The regions highly influenced by sulphate transport, North Africa and the Equatorial Atlantic, are not very favourable to the mixing process either. It seems that the dust calcite content is the limiting factor in these zones (Fig. 8). Thus, there is no sufficient dust surface for the reaction and the coated sulphate concentrations produced in these regions do not 20
exceed 1.5 µg m−3.
Contrary to these regions, the conditions in the Western Sahara and the Eastern Mediterranean appear to favour the mixing process. Our results demonstrate that sul-phate and mineral dust share common pathways in the atmosphere over the North Atlantic. For the Western Sahara, dust is rich in calcite and is, therefore, very reactive 25
(Fig. 5). Moreover, the second dust outbreak happens simultaneously during a high sulphate supply (Fig. 7). We found that on average 54% of dust is coated by sulphate during this period (Fig. 8). This represents coated sulphate concentrations produced
ACPD
5, 5615–5644, 2005Transport and mixing zone of dust and
sulphate K. V. Desboeufs and G. Cautenet Title Page Abstract Introduction Conclusions References Tables Figures J I J I Back Close
Full Screen / Esc
Print Version Interactive Discussion
EGU
on dust of around 5 µg m−3. These results seem to agree with literature values in this region which suggest, particularly in winter, an association between dust and sulphate. Raes (2000) noted that desert plumes transported over the Atlantic Ocean tend to be mixed which polluted aerosol. Tomza et al. (2001) found that nss SO2−4 is associated with dust during a Saharan dust outbreak in the Canary Island. In the same region, 5
Viana et al. (2002) found sulphate concentrations around 3 to 10 µg m−3 associated with dust during a dusty period. Furthermore, Reis et al. (2002) observed over the Azores that African dust could be contaminated with polluted aerosol from Europe. For the Eastern Mediterranean, it is known that dust coming from Africa travels for long periods over the sea where it interacts with polluted air masses from Europe (Falkovich 10
et al., 2001). However, it appears in our simulations that high sulphate supplies are not concomitant with dust events due to the meteorological conditions (Figs. 5 and 7). Nevertheless, the dust source for this region, i.e. the NEL region, is steady resulting in a constant dust loading values of about 5 µg m−3 during non dusty periods. The sulphate supply is also constant and high around 6 µg m−3. Thus, even if dust is poor 15
in calcite, sulphate in high concentrations is found to interact upon dust particles and react with the calcite. This implies in third dust event, that the concentrations of coated sulphate are in the same order as those observed over the Canaries (around 3 µg m−3) and that dust is highly affected by coating (Fig. 8). The Eastern Mediterranean is also a zone where Saharan dust particles are found to be covered by sulphate (Levin et al., 20
1990, 1996; Herut et al., 2000).
Our results do not identify the tropical Atlantic Ocean as a major mixing zone. How-ever, several authors observed a dust coating during the plume transport over the At-lantic Ocean to the American coasts, notably by in the case of gypsum (CaSO4) instead of calcite on the dust (Glaccum and Prospero, 1980; Buseck et al., 1999). Gypsum is 25
a product that results from the reaction between calcite and sulphur species (Li-Jones et al., 1998; Prospero, 1999). Glaccum and Prospero (1980) observed that the calcite concentrations decrease from Sal islands over Bermuda to Miami, whereas gypsum concentrations inversely increase. The mixing, i.e. gypsum formation, could happen
ACPD
5, 5615–5644, 2005Transport and mixing zone of dust and
sulphate K. V. Desboeufs and G. Cautenet Title Page Abstract Introduction Conclusions References Tables Figures J I J I Back Close
Full Screen / Esc
Print Version Interactive Discussion
EGU
either close to the region of dust expulsion or during the transport over the Atlantic. Our results indicate that this phenomenon is particularly prominent over the coastal re-gions of Africa, and that, therefore, the gypsum found in Bermuda is produced over the Eastern Atlantic Ocean. The concentrations of coated sulphate on dust found on Bar-bados are around 1 µg m−3 during a dust event (Li-Jones et al., 1998). The majority of 5
these observations are mostly made in summer when the trade winds carry very high concentrations of mineral dust at high altitudes (3–5 km). In our case, the simulations were made in winter when the trade winds carry African dust towards the Brazilian coasts. Thus, it appears that the coated sulphate concentrations on Barbados are ten times lower than the Li-Jones et al. (1998) measurements. However, we found consis-10
tent concentrations of coated sulphate on the Brazilian coasts with an average value of 0.4 µg m−3 and a maximum value of 1.2 µg m−3. Thus, the results of the simula-tions are comparable with the observasimula-tions and the main trend for the coating process is rather satisfactorily reflected. In addition to the external mixing between dust and sulphate indicated by numerous observations in the Western Atlantic Ocean, we can 15
also suppose that the internal mixing between dust and sulphate is significant, despite the fact that the chemical process is mainly located in the Eastern Atlantic Ocean.
4. Conclusions
Our simulations show that during the study period (January 1993), the main dust sources over Northern Africa are the Northern Egypt and Libya (NEL), Western Sahara 20
(WS) and Sahel (S), with the Sahel region extending from Mali to Chad. High amounts of dust are expulsed from Africa typically in the lower layers of the troposphere. These simulated dust loadings correspond with those observed in this season near the African coast. Four main pathways of dust expulsion have been identified by our simulations in agreement with the observations: Eastern Mediterranean, North Atlantic via Canary 25
Island, Tropical Atlantic Ocean via Cap Verde Islands, and Gulf of Guinea. We focused particularly on the calcite concentrations of transported dust. It appears that the NEL
ACPD
5, 5615–5644, 2005Transport and mixing zone of dust and
sulphate K. V. Desboeufs and G. Cautenet Title Page Abstract Introduction Conclusions References Tables Figures J I J I Back Close
Full Screen / Esc
Print Version Interactive Discussion
EGU
source produces rich calcite dust, but the highest calcite contents transported by dust are found during the events where dust was expulsed over the North Atlantic from the Western Sahara. Thus, these two regions seem to be the most favourable to study the heterogeneous reactivity of dust which is directly based on calcite content (Dentener et al., 1996). The supply of sulphate from the European source is mainly directed to-5
wards the Mediterranean up to Northern Maghreb and over the North Atlantic close to the coasts of the Iberian Peninsula. The observed trends of a high European SO2 influence in Mediterranean and Maghreb are realistically reproduced.
Finally, our model results on dust and SO2transport are in good agreement with the behaviour typically observed in Africa and over the Atlantic Ocean and the Mediter-10
ranean in winter. Based on these arguments, we can conclude concerning the coating phenomenon of dust by sulphate in these regions that:
– the most favourable zones of mixing process between dust and sulphate are: (i)
the Eastern Mediterranean basin due to the concomitance of high concentrations of dust and sulphate and (ii) the North-Eastern Atlantic Ocean due to the high 15
amount of calcite in the expulsed dust which is, therefore, reactive;
– the coating process is mainly centred on these regions, even if coated dust is
observed up to the Caribbean and American coasts;
– the winter period is the most favourable time period for this phenomenon in this
region since it represents the period where the majority of dust expulsions are 20
observed, accompanied by high SO2concentrations from Europe.
Acknowledgements. This work makes use of the RAMS model, which was developed under the support of the National Science Foundation (NSF) and the Army Research Office (ARO). We also thank the Centre National d’Etudes Spatiales (CNES) for its financial support.
ACPD
5, 5615–5644, 2005Transport and mixing zone of dust and
sulphate K. V. Desboeufs and G. Cautenet Title Page Abstract Introduction Conclusions References Tables Figures J I J I Back Close
Full Screen / Esc
Print Version Interactive Discussion
EGU
References
Afeti, G. M. and Resch, F. J.: Physical characteristics of Saharan dust near the Gulf of Guinea, Atmos. Envir., 34, 1273–1279, 2000.
Alfaro, S., Gaudichet, A., Gomes, L., and Maill ´e, M.: Mineral aerosol production by wind ero-sion: aerosol particle sizes and binding energies, Geophys. Res. Lett., 25, 991–994, 1998.
5
Anderson, J. R., Busek, P. R., Patterson, T. L., and Arimoto, R.: Characterization of the Bermuda tropospheric aerosol by combined individual-particle and bulk-aerosol analysis, Atmos. Envir., 30, 319–338, 1996.
Bardouki, H., Liakakou, H., Economou, C., Sciare, J., Smolik, J., Zdimal, V., Eleftheriadis, K., Lazaridis, M., Dye, C., and Mihalopoulos, N.: Chemical composition of size-resolved
10
atmospheric aerosols in the eastern Mediterranean during summer and winter, Atmos. Envir., 37, 195–208, 2003.
Baumbach, G., Vogt, U., Hein, K. R. G., Oluwole, A. F., Ogunsola, O. J., Olaniyi, H. B., and Akeredolu, F. A.: Air pollution in a large tropical city with a high traffic density – results of measurements in Lagos, Nigeria, Sci. Total Envir., 169, 25–31, 1995.
15
Bergametti, G., Gomes, L., Remoudaki, E., Desbois, M., Martin, D., and Buat-Menard, P.: Present transport and deposition patterns of African dust to the north-western Mediter-ranean, I, in: Paleoclimatology and Paleometeorology: Modern and past patterns of global atmospheric transport, edit by: Leinen, M. and Sarnthein, S., Kluwer Academic Publishers, Dordrecht, 227–252, 1989.
20
Br ´eon, F. M., Tanr ´e, D., and Generoso, S.: Aerosol effect on cloud droplet size monitored from satellite, Science, 295, 834–838, 2002.
Buseck, P. R. and Posfai, M.: Airborne mineral and related aerosol particles: effects on climate and the environment, PNAS US, 96, 3372–3379, 1999.
B ¨oke, H., G ¨okt ¨urk, E. H., Caner-Saltik, E. N., and Demirci, S.: Effect of airborne particle on
25
SO2-calcite reaction, Appl. Surf. Sci., 140, 70–82, 1999.
Cautenet, G., Guillard, F., Marticorena, B., Bergametti, G., Dulac F., and Edy, J.: Modeling of a Saharan dust event, Meteorol. Z., 9, 221–230, 2000.
Chester, R., Elderfield, H., Griffin, J. J., Johnson, L. R., and Padgham, R. C.: Eolian dust along the eastern margins of Atlantic ocean, Marine Geol., 13, 91–105, 1972.
30
Chiapello, I.: Les a ´erosols atmosph ´eriques au dessus de l’Atlantique nord tropical: approche physico-chimique et m ´et ´eorologique, Evaluation de la contribution des diff´erentes esp`eces
ACPD
5, 5615–5644, 2005Transport and mixing zone of dust and
sulphate K. V. Desboeufs and G. Cautenet Title Page Abstract Introduction Conclusions References Tables Figures J I J I Back Close
Full Screen / Esc
Print Version Interactive Discussion
EGU
`a l’ ´epaisseur optique en a ´erosol, PhD thesis, University Paris 7, Paris, 1996.
Chiapello, I., Bergametti, G., Chatenet, B., Bousquet, P., Dulac, F., and Santos Soares, E.: Origins of African dust transported over the northeastern tropical Atlantic, J. Geophys. Res., 102, 13 701–13 709, 1997.
Chiapello, I., Bergametti, G., Chatenet, B., Dulac, F., Jankowiak, I., Liousse, C., and Santos
5
Soares, E.: Contribution of the different aerosol species to the aerosol mass load and optical depth over the northeastern tropical Atlantic, J. Geophys. Res., 104, 4025–4035, 1999. Claquin, T., Schulz, M., and Balkanski, Y. J.: Modeling the mineralogy of atmospheric dust
sources, J. Geophys. Res., 104, 22 243–22 256, 1999.
Cotton, W. R., Pielke Sr., R. A., Walko, R. L., Liston, G. E., Tremback, C. J., Jiang, H., McAnely,
10
R. L., Harrington, J. Y., Nicholls, M. E., Carrio, G. G., and McFadden, J. P.: Rams 2001: Current status and future directions, Meteorol. Atmos. Phys., 82, 5–29, 2003.
Davis, B. L. and Jixiang, G.: Airborne particulate study in five cities of China, Atmos. Envir., 34, 2703–2711, 2000.
Dentener, F. J., Carmichael, G. R., Zhang, Y., Lelieveld, J., and Crutzen, P. J.: Role of mineral
15
aerosol as a reactive surface in the global troposphere, J. Geophys. Res., 101, 22 869– 22 889, 1996.
Drees, L. R., Manu, A., and Wilding, L. P.: Characteristics of aeolian dusts in Niger, West Africa, Georderma, 59, 213–233, 1993.
Falkovich, A. H., Ganor, E., Levin, Z., Formenti, P., and Rudich, Y.: Chemical and mineralogical
20
analysis of individual mineral dust particles, J. Geophys. Res., 106, 18 029–18 036, 2001. Gao, Y. and Anderson, J. R.: Characteristics of Chinese aerosols determined by
individual-particle analysis, J. Geophys. Res., 106, 18 037–18 045, 2001.
Gelado-Caballero, M. D., Torres-Padron, M. E., Hernandez-Brito, J. J., Herreva-Melian, J. A., and Perez-Pena, J.: Aluminium distributions in Central east atlantic waters (Canary Islands),
25
Marine Chem., 51, 359–372, 1996.
Ghan, S. J., Easter, R. C., Chapman, E. G., Abdul-Razzak, H., Zhang, Y., Leung, L. R., Laulainen, N., Saylor, R. D., and Zaveri, R. A.: A physically based estimate of radiative forcing by anthropogenic sulfate aerosol, J. Geophys. Res., 106, 5279–5293, 2001.
Gillies, J. A., Nickling, W. G., and McTainsh, G. H.: Dust concentrations and particulate-size
30
characteristics of an intense dust haze event: inland delta region, Mali, West Africa, Atmos. Envir., 30, 1081–1090, 1996.
Miner-ACPD
5, 5615–5644, 2005Transport and mixing zone of dust and
sulphate K. V. Desboeufs and G. Cautenet Title Page Abstract Introduction Conclusions References Tables Figures J I J I Back Close
Full Screen / Esc
Print Version Interactive Discussion
EGU
alogy, Marine Geol., 37, 295–321, 1980.
Gomes, L., Bergametti, G., Coud ´e-Gaussen, G., and Rognon, P.: Submicron desert dust: a sandblasting process, J. Geophys. Res., 1996(95), 13 927–13 935, 1990.
Harrison, R. M., Peak, J. D., and Kaye, A. D.: Atmospheric aerosol major ion composition and cloud condensation nuclei over the northeast Atlantic, J. Geophys. Res., 101, 4425–4434,
5
1996.
Hegg, D. A., Ferek, R. J., and Hobbs, P. V.: Light scattering and cloud condensation nucleus activity of sulfate aerosol measured over the northeast Atlantic ocean, J. Geophys. Res., 98, 14 887–14 894, 1993.
Herut, B., Starinsky, A., Katz, A., and Rosenfeld, D.: Relationship between the acidity and
10
chemical composition of rainwater and climatological conditions along a transition zone be-tween large deserts and Mediterranean climate, Israel, Atmos. Envir., 34, 1281–1292, 2000. Jankowiak, I. and Tanr ´e, D.: Satellite climatology of Saharan dust outbreaks: Method and
preliminary results, J. Climate, 5, 646–656, 1992.
Johansen, A. M., Siefert, R. L., and Hoffmann, M. R.: Chemical composition of aerosols
col-15
lected over the tropical North Atlantic ocean, J. Geophys. Res., 105, 15 277–15 312, 2000. Kalu, A. E.: The African plume: its characteristics and propagation across West Africa in winter,
in: Saharan dust: Mobilization, transport, deposition, edited by: Morales, C., John Wiley, New York, 95–118, 1979.
Kubilay, N. and Saydam, A. C.: Trace elements in atmospheric particulates over the eastern
20
Mediterranean; concentrations, sources and temporal variability, Atmos. Envir., 29, 2289– 2300, 1995.
Kubilay, N., Nickovic, S., Moulin, C., and Dulac, F.: An illustration of the transport and deposition of mineral dust onto the eastern Mediterranean, Atmos. Envir., 34, 1293–1303, 2000. Legrand, M., N’doum ´e, C., and Plana Fattori, A.: Satellite detection of dust using the IR imagery
25
of Meteosat, Part 1: Infrared Difference Dust Index, J. Geophys. Res., 101, 18 261–18 274, 2001.
Levin, Z., Ganor, E., and Gladstein, V.: The effects of desert particles coated with sulfate on rain formation in the Eastern Mediterranean, J. Appl. Met., 35, 1511–1523, 1996.
Levin, Z., Price, C., and Ganor, E.: The contribution of sulfate and desert aerosols to the
30
acidification of clouds and rain in Israel, Atmos. Envir., 24A, 1143–1151, 1990.
Li-Jones, X. and Prospero, J. M.: Variations in the size distribution of non-sea-salt sulfate aerosol in the marine boundary layer at Barbados: Impact of African dust, J. Geophys. Res.,
ACPD
5, 5615–5644, 2005Transport and mixing zone of dust and
sulphate K. V. Desboeufs and G. Cautenet Title Page Abstract Introduction Conclusions References Tables Figures J I J I Back Close
Full Screen / Esc
Print Version Interactive Discussion
EGU
103, 16 073–16 084, 1998.
Li, X., Maring, H., Savoie, D., Voss, K., and Prospero, J. M.: Dominance of mineral dust in aerosol light-scattering in the North Atlantic trade winds, Nature, 380, 416–419, 1996. Maring, H., Savoie, D. L., Izaguirre, M. A., McCormick, C., Arimoto, R., Propero, J. M., and
Pilinis, C.: Aerosol physical and optical properties and their relationship to aerosol
composi-5
tion in the free troposphere at Izana, Tenerife, Canary Islands, during July 1995, J. Geophys. Res., 105, 14 677–14 700, 2000.
Marticorena, B. and Bergametti, G.: Modeling the atmospheric dust cycle: 1. Design of a soil-derived dust emission scheme, J. Geophys. Res., 100, 16 415–16 430, 1995.
McGovern, F. M., Raes, F., and Van Dingenen, R.: Anthropgenic influences on the chemical
10
and physical properties of aerosols ine the Atlantic subtropical region during July 1994 and July 1995, J. Geophys. Res., 104, 14 309–14 319, 1999.
Middleton, N. J.: Effect of drought on dust production in the Sahel, Nature, 316, 431–434, 1985.
Minvielle, F., Cautenet, G., Lasserre, F., Foret, G., Cautenet, S., Leon, J. F., Andreae, M. O.,
15
Mayol-Bracero, O. L., Gabriel, R., Chazette, P., and Roca, R.: Modelling The transport of aerosols during INDOEX 1999 and comparison with experimental data, Part 2: continental aerosols and their optical depth, Atmos. Envir., 31, 1823–1837, 2004.
Mori, I., Nishikawa, M., and Iwasaka, Y.: Chemical reaction during the coagulation of ammo-nium sulphate and mineral particles in the atmosphere, Sci. Total Envir., 224, 87–91, 1998.
20
N’Tchayi Mbourou, G., Bertrand, J. J., and Nicholson, S. E.: The diurnal and seasonal cycles of wind-borne dust over Africa North of the Equator, J. Appl. Met., 36, 868–882, 1997. Olivier, J. G. J., Bouwman, A. F., Van der Maas, C. W. M., Berdowski, J. J. M., Veldt, C., Bloos,
J. P. J., Visschedijk, A. J. H., Zandveld, P. Y. J., and Haverlag, J. L.: Description of EDGAR Version 2.0. A set of global emission inventories of greenhouse gases and ozone-depleting
25
substances for all anthropogenic and most natural sources on a per country basis and on
1◦ti mes1◦grid, RIVM/TNO report, RIVM, Bilthoven, RIVM report n. 771060 002, (TNO MEP
report nr. R96/119), 1996.
Pradelle, F. and Cautenet, G.: Radiative and microphysical interactions between marine stratocumulus clouds and Saharan dust 2. Modeling, J. Geophys. Res., 107, 4413,
30
doi:10.1029/2000JD000156, 2002.
Prospero, J. M.: Long-range transport of mineral dust in the global atmosphere: Impact of African dust on the environment of the southeastern United States, PNAS US, 96, 3396–
ACPD
5, 5615–5644, 2005Transport and mixing zone of dust and
sulphate K. V. Desboeufs and G. Cautenet Title Page Abstract Introduction Conclusions References Tables Figures J I J I Back Close
Full Screen / Esc
Print Version Interactive Discussion
EGU
3403, 1999.
Putaud, J. P., Van Dingenen, R., Mangoni, M., Virkkula, A., Raes, F., Maring, H., Prospero, J. M., Swietlicki, E., Berg, O. H., Hillamo, R., and M ¨akel ¨a, T.: Chemical mass closure and assessment of the origin of the submicron aerosol in the marine boundary layer and the free troposphere at Tenerife during ACE-2, Tellus B, 52, 141–168, 2000.
5
Raes, F., Van Dingenen, R., Vignati, E., Wilson, J., Putaud, J. P., Seinfeld, J. H., and Adams, P.: Formation and cycling of aerosols in the global troposphere, Atmos. Envir., 34, 4215–4240, 2000.
Rajot, J. L., Alfaro, S. C., Gomes, L., and Gaudichet, A.: soil crusting on sandy soils and its influence on wind erosion, Catena, 53, 1–16, 2003.
10
Ratmeyer, V., Balzer, W., Bergametti, G., Chiapello, I., Fischer, G., and Wyputta, U.: Seasonal impact of mineral dust on deep-ocean particle flux in the Eastern subtropical Atlantic Ocean, Marine Geol., 159, 241–252, 1999.
Redstad, K., Isaksen, I. S. A., and Berntsen, T. K.: Global distribution of sulphate in the tropo-sphere: a three-dimensional model study, Atmos. Envir., 32, 3593–3609, 1998.
15
Reis, M. A., Oliveira, O. R., Alves, L. C., Rita, E. M. C., Rodrigues, F., Fialho, P., Pio, C. A., Freitas, M. C., and Soares, J. C.: Comparison of continental Portugal and Azores Islands aerosol during a Sahara dust storm, Nucl. Inst. B, 189, 272–278, 2002.
Rosenfeld, D., Rudich, Y., and Lahav, R.: Desert dust suppressing precipitation: A possible desertification feedback loop, PNAS US, 98, 5975–5980, 2001.
20
Sch ¨utz, L.: Long range transport of desert dust with special emphasis on the Sahara, Annals New York Academy of sciences, 515–532, 1980.
Singer, A., Ganor, E., Dultz, S., and Fischer, W.: Dust deposition over the Dead Sea, J. Arid Envir., 53, 41–59, 2003.
Smirnov, A., Holben, B. N., Savoie, D., Prospero, J. M., Kaufman, Y. J., Tanr ´e, D., Eck, T. F.,
25
and Slutsker, I.: Relationship between column aerosol optical thickness and in situ ground based dust concentrations over Barbados, Geophys. Res. Lett., 27, 1643–1646, 2000. Song, C. H. and Carmichael, G. R.: The aging process of naturally emitted aerosol (sea-salt
and mineral aerosol) during long range transport, Atmos. Envir., 33, 2203–2218, 1999. Tomza, U., Arimoto, R., and Ray, B. J.: Color-related differences in the chemical composition
30
of aerosol-laden filters, Atmos. Envir., 35, 1703–1709, 2001.
Torres-Padron, M. E., Gelado-Caballero, M. D., Colllado-Sanchez, C., Siruela-Matos, V. F., Cardona-Castellano, P. J., and Hernandez-Brito, J. J.: Variability of dust inputs to the
ACPD
5, 5615–5644, 2005Transport and mixing zone of dust and
sulphate K. V. Desboeufs and G. Cautenet Title Page Abstract Introduction Conclusions References Tables Figures J I J I Back Close
Full Screen / Esc
Print Version Interactive Discussion
EGU
CANIGO zone, Deep-Sea II, 49, 3455–3464, 2002.
Trochkine, D., Iwasaka, Y., Matsuki, A., Yamada, M., Kim, Y.-S., Nagatani, T., Zhang, D., Shi, G.-Y., and Shen, Z.: Mineral aerosol particles collected in Dunhuang, China, and their com-parison with chemically modified particles collected over Japan, J. Geophys. Res., 108, 8642, doi:10.1029/2002JD003268, 2003.
5
Van Dingenen, R., Raes, F., and Jensen, N. R.: Evidence for anthropogenic impact on num-ber concentration and sulfate content of cloud-processed aerosol particles over the North Atlantic, J. Geophys. Res., 100, 21 057–21 067, 1995.
Viana, M., Querol, X., Alastuey, A., Cuevas, E., and Rodriguez, S.: Influence of African dust on the levels on atmospheric particulates in the Canary Islands air qualtity network, Atmos.
10
ACPD
5, 5615–5644, 2005Transport and mixing zone of dust and
sulphate K. V. Desboeufs and G. Cautenet Title Page Abstract Introduction Conclusions References Tables Figures J I J I Back Close
Full Screen / Esc
Print Version Interactive Discussion
EGU Table 1. Winter reported mineral dust concentrations in the Africa and Tropical Atlantic Ocean
regions.
Location Winter means Maximum loading References
(µg/m3) (µg/m3)
Eastern Mediterranean 3–9 Kubilay and Saydam (1995)
7–16 Kubilay et al. (2000)
2000 Falkovich et al. (2001)
2–5 Bardouki et al. (2003)
14 145 This work
Canaries 150 Gelado-Callabero et al. (1996)
60 Tomza et al. (2001)
120–180 800 Viana et al. (2002)
40–90 300–1300 Torres-Padron et al. (2002)
110 600 This work
Azores 9 20 Reis et al. (2002)
4 15 This work
Sal Island 57 113 Chester et al. (1972)
180 Ratmeyer et al. (1999) 70 300–600 Chiapello et al. (1997) 80 400–700 Chiapello et al. (1999) 60 250 This work Barbados 1–10 Prospero (1999) 2–8 Smirnov et al. (2000) 2 This work
Guinea gulf 900 Sch ¨utz (1980)
200 800 Baumbach et al. (1995)
17–134 120–330 Afeti and Resch (2000)
ACPD
5, 5615–5644, 2005Transport and mixing zone of dust and
sulphate K. V. Desboeufs and G. Cautenet Title Page Abstract Introduction Conclusions References Tables Figures J I J I Back Close
Full Screen / Esc
Print Version Interactive Discussion EGU
16
Figure 1.
Figure 2.
Fig. 1. SO2emission flux from annual EDGAR database and the focused sites locations.
ACPD
5, 5615–5644, 2005Transport and mixing zone of dust and
sulphate K. V. Desboeufs and G. Cautenet Title Page Abstract Introduction Conclusions References Tables Figures J I J I Back Close
Full Screen / Esc
Print Version Interactive Discussion EGU
16
Figure 1.
Figure 2.
Fig. 2. Calcite content (%) in the silt fraction (2–50 µm) at the surface of arid soils from
evalua-tion of Claquin et al. (1999).
ACPD
5, 5615–5644, 2005Transport and mixing zone of dust and
sulphate K. V. Desboeufs and G. Cautenet Title Page Abstract Introduction Conclusions References Tables Figures J I J I Back Close
Full Screen / Esc
Print Version Interactive Discussion
EGU
Figure 3.
Fig. 3. Averaged mass fluxes (µg m−2 s−1) and integrated dust loading (µg m−2) for the dust event from 4 to 11 January 1993(a), from 6 to 10 January 1993 (b) and from 16 to 25 January
1993(c). The dotted line on the right-hand figures represents the limits of dust concentrations
with calcite content >2.10−2µg m−3at the surface.
ACPD
5, 5615–5644, 2005Transport and mixing zone of dust and
sulphate K. V. Desboeufs and G. Cautenet Title Page Abstract Introduction Conclusions References Tables Figures J I J I Back Close
Full Screen / Esc
Print Version Interactive Discussion EGU 18 Figure 4. Figure 5. Figure 6. Dus t Mas s l oad in g ( µ g m -3 ) January days January days < 10% calcite > 10% calcite Total calcite
Fig. 4. Vertical distribution of mass concentrations (µg m−3) averaged on the grid for the focused sites.
ACPD
5, 5615–5644, 2005Transport and mixing zone of dust and
sulphate K. V. Desboeufs and G. Cautenet Title Page Abstract Introduction Conclusions References Tables Figures J I J I Back Close
Full Screen / Esc
Print Version Interactive Discussion EGU Dus t Mas s l oad in g ( µ g m -3 ) January days January days < 10% calcite
content (poor) > 10% calcite content (rich) Total calcite
content
Fig. 5. Monthly distribution of rich (>10%) and poor (<10%) calcite dust on the modelled dust
mass loading (µg m−3) at the surface for the focused sites.
ACPD
5, 5615–5644, 2005Transport and mixing zone of dust and
sulphate K. V. Desboeufs and G. Cautenet Title Page Abstract Introduction Conclusions References Tables Figures J I J I Back Close
Full Screen / Esc
Print Version Interactive Discussion EGU 19 Figure 6. Figure 7.
Fig. 6. Averaged integrated sulphate concentrations (µg m−2) in January.
ACPD
5, 5615–5644, 2005Transport and mixing zone of dust and
sulphate K. V. Desboeufs and G. Cautenet Title Page Abstract Introduction Conclusions References Tables Figures J I J I Back Close
Full Screen / Esc
Print Version Interactive Discussion EGU 19 Figure 6. Figure 7.
ACPD
5, 5615–5644, 2005Transport and mixing zone of dust and
sulphate K. V. Desboeufs and G. Cautenet Title Page Abstract Introduction Conclusions References Tables Figures J I J I Back Close
Full Screen / Esc
Print Version Interactive Discussion
EGU
20 Figure 8.
Fig. 8. Averaged values of monthly modelled mass loading of coated dust with sulphate in
January.