HAL Id: hal-00089767
https://hal-insu.archives-ouvertes.fr/hal-00089767
Submitted on 28 Aug 2006
HAL is a multi-disciplinary open access archive for the deposit and dissemination of sci-entific research documents, whether they are pub-lished or not. The documents may come from teaching and research institutions in France or abroad, or from public or private research centers.
L’archive ouverte pluridisciplinaire HAL, est destinée au dépôt et à la diffusion de documents scientifiques de niveau recherche, publiés ou non, émanant des établissements d’enseignement et de recherche français ou étrangers, des laboratoires publics ou privés.
The influence of impregnation by hydrocarbons on coal
structure during its thermal evolution
María José Iglesias, María José Cuesta, Fatima Laggoun-Défarge, Isabel
Suarez-Ruiz
To cite this version:
María José Iglesias, María José Cuesta, Fatima Laggoun-Défarge, Isabel Suarez-Ruiz. The influence of impregnation by hydrocarbons on coal structure during its thermal evolution. Journal of Analytical and Applied Pyrolysis, Elsevier, 2001, 58-59, pp.841-871. �10.1016/S0165-2370(00)00181-9�. �hal-00089767�
The influence of impregnation by hydrocarbons on coal
structure during its thermal evolution
Maria José Iglesiasa, Maria José Cuestaa, Fatima Laggoun-Défargeb and Isabel Suárez-Ruiz a
a Instituto Nacional del Carbón, CSIC, Ap. Co. 73, 33080 Oviedo, Spain
b UMR 6531/FR 09 CNRS-Université d’ Orléans, 45067 Orléans, Cedex 2, France – remplacé
par UMR6113 - ISTO
Abstract
The present work analyses the changes in the chemical structure of a perhydrous coal during its thermal evolution at different temperatures in an open-medium pyrolysis system. The results obtained were compared with those described for non-perhydrous coals in order to establish the effect of the substances assimilated by the coal structure (hydrocarbon/oil-like substances) on the thermal evolution of the coal. The transformation ratio at each stage of thermal treatment was determined and the chemical-structural characterisation of the resultant products was performed. Changes in textural and microtextural properties associated with structural modifications during the evolution were also tested. The results obtained show that this perhydrous coal develops a specific evolution pathway different from that followed by non-perhydrous coals with a normal H/C ratio. The substances assimilated by the perhydrous coal cannot be easily and totally released from its structure so that they can be only partially removed after thermal treatment. Thus, the treatment debilitates the interactions between the substances and the coal matrix in addition to weakening and cracking the matrix during the thermal process. The increase in temperature also leads to the conversion of some of the heavy assimilated substances into lighter compounds. However, the assimilated substances are present even at high temperatures of the thermal process, providing hydrogen which has the effect of stabilising the radicals originated during the pyrolysis and improving the fluidity properties in the reacting medium.
Author Keywords : Coal; Chemical structure; Physical structure; Coal strucutre; Perhydrous
1. Introduction
Lipoidal or bituminous material can become assimilated within the coal structure, especially in vitrinite (one of the petrographic coal components). Incorporation of lipoidal substances can take place during early diagenesis when organic material is deposited in environments with a high bacterial and/or planktonic input [1, 2, 3, 4 and 5]. Furthermore, coals can assimilate or be impregnated by liquid hydrocarbons (bitumen) during coalification as a result of the mobilisation/fluidisation of certain liptinite macromolecular substances such as cutinite, resinous material and other hydrogenated products. This is, therefore, related to coals with high liptinite contents [6, 7, 8, 9, 10, 11 and 12]. Adsorption of secondary bitumen derived from the increase in maturity of lipoidal organic matter from the surrounding oil shales [13] as well as an assimilation or impregnation by oil/petroleum-like substances that have migrated from other sediments [14] is also possible.
The impregnation or assimilation of hydrocarbons/oil-like substances gives rise to an enrichment in hydrogen, abnormally low vitrinite reflectance values and, in general, strong discrepancies in the chemical and petrological parameters related to composition and rank in the affected coals [14]. They are perhydrous coals and their evolution will take place in a different way to that described during normal coalification. Thus, it is assumed that in these coals the aromatisation and condensation processes are hindered [12, 15 and 16] and an evolution model for them based on hydrogenation rather than the thermal model commonly used for explaining coalification has been proposed [17]. Coals containing hydrocarbons or oil-like substances in their structure also show peculiar properties and behaviour from a technological point of view. As these types of coal have a high calorific value due to their high hydrogen content, they are very good fuels for combustion. On the other hand, they also show different textural properties to those described for normal coals and, in general, they swell strongly. During the carbonisation process they show low viscosity and high fluidity. The presence of hydrocarbons in the coal structure can, therefore, produce an enhancement of the coking properties [18 and 19]. The addition of bituminous material and petroleum tar or pitches to the coal blend during the process of carbonisation is at present used in order to change the thermoplastic behaviour of coal [20 and 21]. This is because these materials provide additional fluid components and reduce the softening temperature of the system. Moreover, the conversion of these types of perhydrous coal into liquids is high probably as result of the conjunction of two factors, the low degree of condensation of the aromatic units in the vitrinite network (usually the main coal component) and the presence in the system of compounds that provide sufficient hydrogen to stabilise the radical formed during the thermal treatment. Here, it should be mentioned that coal/petroleum co-processing has been proposed as an alternative approach to the production of liquids related with the conventional coal liquefaction or hydrogenation of petroleum residues [22]. Perhydrous coals can, therefore, be regarded, either by themselves or as components of coal blends, as valuable materials for conversion into useful products of a higher quality. This requires knowledge of the behaviour of this type of coals during pyrolysis processes, which can in turn provide new insights into the evolution of its composition and physico-chemical structure. Moreover, the nature of the substances incorporated into the coal network, especially in the case of coals affected by hydrocarbons or petroleum-like substances can be elucidated.
Thus, the main objective of this research was to study the changes in the physico-chemical structure of a perhydrous coal (which has absorbed or has been impregnated with natural hydrocarbon or oil-like substances) during its thermal evolution by means of an increase in temperature in an off-line open-medium pyrolysis system. The results obtained were also
compared with those described for non-perhydrous coals, which had been thermally treated in the same experimental conditions [23]. In this way, the effect of the substances assimilated during the evolution of coals as well as the different modifications within the coal structure can be seen.
2. Experimental procedures and analytical methods
2.1. Coal characteristics and experimental procedures
The sample used in this work (AJV coal) comes from the Jurassic Basin in Northern Spain and an extensive characterisation has been reported in previous papers [14, 15, 16 and 17]. It was formed by drift-wood which, during the early diagenetic stages, was impregnated with oil from an adjacent petroleum source-rock [14]. This coal has a very pure organic composition (1.1% wt. ash) and it is made up exclusively of the huminite/vitrinite maceral group (ulminite and phlobaphinite, 85.5 and 14.5% vol. mmf, respectively). The oils/hydrocarbons from the lower sediments have been adsorbed and retained only in the ulminite component because of its specific nature (derived from vegetal tissue) and physical features (high initial porosity). This explains the differences in vitrinite reflectance between the huminite/vitrinite macerals (ulminite 0.39%, phlobaphinite 0.72%, see Plate 1a). The sample shows a high H/C atomic ratio (0.83) and gives very high oil and gas yields (23 and 7%, respectively, during the Gray– King pyrolysis at 550°C). This coal has a very low porosity and moisture content [14 and 15] and the cokes obtained at 1000°C [19] show the development of abnormally large molecular orientation domains (MOD).
For the present work, the selected perhydrous coal was pyrolysed at different temperatures (250, 300, 325, 350, 375, 400, 450 and 500°C) in an off-line open-medium prolysis system, following the procedure described by Suárez-Ruiz et al. [24] as was reported for the thermal evolution of non-perhydrous coals [23]. At the end of the process the amount of solid residue and effluents was determined in order to obtain the transformation ratio at each stage of pyrolysis.
Plate 1. (a–d) Optical microscopy (reflected white light and oil immersion). Evolution of the perhydrous huminite/vitrinite structure during the main steps of the pyrolysis process. (a) Raw sample (25°C). U, ulminite (humotelinite) with 0.39% of reflectance and P, phlobaphinite (humocollinite) with of 0.72%. (b) Stage (350°C). Gradual loss of definition of the botanical structures (ulminite reflectance, 0.81% and phlobaphinite reflectance, 0.95%). Limits between macerals poorly defined. Borders of particles are rounded. Development of small-size porosity at this scale. (c) Stage (375°C). Vitrinite particles with homogeneous appearance due to the unification of the optical properties of ulminite and phlobaphinite (reflectance of 1.30%). Significant development of vacuoles and small-size porosity of irregular distribution. (d) Stage (500°C). Vitrinitic fragments with homogeneous texture corresponding to the thin walls between vacuoles of great size. High reflectance, 2.33%. (e–h) Scanning electronic microscopy images. Evolution of the fine structure of the perhydrous huminite/vitrinite during the pyrolysis process. (e) Raw sample (25°C). Botanical structure (ulminite and phlobaphinite). Heterogeneous appearance as result of the superposition of lamellae with a relative ordered distribution. (f) Stage (350°C). Progressive softening. Vitrinite with heterogeneous and clot aspect. (g) Stage (375°C). Development of devolatilisation vacuoles and porosity of different size in walls between vacuoles. Walls with relatively homogenous texture. (h) Stage (500°C). Vitrinitic particles with vitreous aspect after solidification. Irregular fracture of sharp limits. Massive development of degasification vacuoles (which can coalesce) and porosity with different size. Homogenous walls between pores with their flat and smooth surfaces.
2.2. Analytical methods
Optical microscopy observations were carried out with a MPV Combi Leitz microscope in reflected white light using oil immersion lenses (32×, 50×). The reflectance was determined according to standard procedures (ISO 7404/5 1984). Observations by means of fluorescence microscopy were achieved with a MPVII Leitz apparatus, using water immersion lenses (same magnifications) and blue–violet light excitation. The vitrinite ultrafine structure was studied in grains crushed to <1 mm covered with a gold film using a SEM Zeiss-DSM 942 instrument.
Textural characterisation was performed through the determination of real (true) and apparent densities. These data were used to calculate the pore volume and the porosity. The real density was determined using a glass pycnometer. The samples (ca. 2 g, particle size between 1 and 3 mm) were degassed at 100°C for 3 h before the introduction of helium. Apparent density was determined by means of a mercury porosimeter using a Carlo Erba Macropore Unit 120 apparatus. The samples were dried and degassed before being filled with mercury. The same equipment was used to measure the accumulative pore volume of a pore size (Dp) with a
diameter greater than 7.50 nm. The distribution of the pore size allowed the separation of macro (Dp>50 nm) and mesopores (50 nm>Dp>7.50 nm). The approximate volume of the
micropores was calculated by difference.
Proximate analysis was carried out following International Standard Procedures ISO-589 1981; ISO-562 1981 and ISO 1171 1981). Ultimate analyses were performed in a microanalyser Carlo-Erba CHS-O 1108 and Rock-Eval pyrolysis was carried out in accordance with Espitalié [25 and 26]. Determinations of the Free Swelling Index were performed according to the UNE-32005 procedure. The solid residues were prepared for FTIR analysis, using the standard KBr pellet procedure for this type of material [27, 28 and 29] (coal:KBr mixture at a 1:100 ratio). All of the absorbance spectra were recorded on a Perkin– Elmer 1750 and analysed following procedures described by Iglesias et al. [15].
The oils generated during the different pyrolysis stages (from 300 to 500°C) and the extracts (obtained following a modified procedure described in Blanco et al. [30]) from the raw vitrinite and the pyrolysate at the 250°C stage were analysed by means of gas chromatography/mass spectrometry (GC/MS) and nuclear magnetic resonance (1H-NMR and
13C-NMR). The chromatographic study was carried out on a Hewlett–Packard HP 6890 gas
chromatograph equipped with flame ionisation detection (FID) and identification of the compounds was performed by means of GC/MS using a Finningan GCQ gas chromatograph equipped with mass detection. The experimental conditions used in this work were the same as those previously reported by Jiménez et al. [23].
The 1H (400.13 MHz) and 13C (100.61 MHz) NMR spectra were measured on a Bruker AMX400 spectrometer equipped with a 5 mm broad band (31P–104Ag) reverse probe. Samples were prepared by dissolving the oils in CDCl3 and/or CS2 (D2O as external lock, presaturation
of the water signal). The 13C spectra were obtained in the inverse gate decoupling mode on samples doped with 5 mg of Cr(acac)3. Exponential multiplication of LB=2 was applied prior
to Fourier transformation. The DEPT pulse sequence was used for 13C-editing. Quaternary
3. Results and discussion
3.1. Mass balance
Fig. 1 shows the mass balance of the pyrolysis process. The water is released up to the 375°C stage, arising from both the water trapped in the coal network and from the deoxygenation of organic matter. The moisture of the coal studied is very low [14] and during pyrolysis this parameter does not change significantly (from 2.95% in the raw material, to 1.43% for the pyrolysate at the 500°C stage). This shows that dehydration reactions play an important role in the production of water for this coal although the amount of water collected was relatively low (ca. 8% throughout the entire process).
Fig. 1. Mass balance of generated products during the pyrolysis process of the perhydrous coal.
The production of oil is significant at the 325°C stage and between 350 and 500°C (Fig. 1). The evolution of the gas yield shows an increase up to 375°C and then, between the 450 and 500°C stages, a new pulse in gas production is observed ( Fig. 1). The gas and oil yields throughout the pyrolysis process of this coal are higher than those obtained from a non-perhydrous vitrinite in the same experimental conditions [23]. Differences in the evolution yields with the increase in temperature are also found ( Fig. 2a and b). The differences in the relative oil production (Fig. 2a) occur above 325°C and a higher oil production in the case of non-perhydrous vitrinite is observed at higher temperatures (400–450/500°C). The gas production ( Fig. 2b) occurs at higher temperatures during pyrolysis of the perhydrous vitrinite. Furthermore, the progressive increase in gas yield in the 350–450°C temperature range for the non-perhydrous vitrinite is not found in the perhydrous coal ( Fig. 2).
Fig. 2. Comparison of the results obtained from the thermal treatment of a perhydrous and non-perhydrous vitrinites series. (a) Oil and (b) gas productions at different stages refer to the total amount collected (data for non-perhydrous vitrinite were taken from Jimenez et al. [23]).
The results obtained are rationalised on the basis of a different thermal stability of the pyrolysates from both vitrinites (perhydrous and non-perhydrous) as a result of structural differences between them and the presence of hydrocarbons in the network of the perhydrous vitrinite. It is known that during pyrolysis the reacting medium plays an important role in the conversion of coals [31 and 32]. The higher conversion into liquids at lower temperature required for the perhydrous coal possibly arise from the presence of hydrocarbons or oil-like substances in its structure which can act as hydrogen donors, thus improving fluidity in the reacting medium. On the other hand, if there is not sufficient hydrogen in the reacting medium to stabilise the radicals formed during pyrolysis, polymerisation of such intermediate radicals is favoured. As a result, the amount of tar/oil is low and the temperature of tar released increases. The impregnating substances in the structure of the perhydrous coal are present in the reacting medium at least up to the 375°C stage as is inferred through the swelling behaviour ( Table 1). Such heavy substances [14] could be converted into lighter compounds during heating. Their contribution to gas production up to 400°C cannot, therefore, be discarded. It explains, at least in part, the differences found between the gas yield trend in perhydrous and non-perhydrous vitrinites ( Fig. 2b). On the other hand, the gas generated at high temperatures (400–450/500°C) could be partly due to the condensation reactions within
the vitrinite network. Thus, the condensation reactions produced at 400°C needed more energy in the case of perhydrous coal than in non-perhydrous vitrinite.
Table 1. Free swelling index for the perhydrous coal (vitrinite) and its pyrolysates
3.2. Evolution of the physical structure of the perhydrous coal during the pyrolysis process
3.2.1. Macroscopic changes
Macroscopic changes in pyrolysates from perhydrous coal start at 350°C and at the 500°C stage, the pyrolysate is an expanded and voluminous mass, inconsistent, friable and highly porous. These changes are related with the decrease in the free swelling index (Table 1). Values for this index are very high ( Table 1) in the raw sample and in the pyrolysates from the initial temperatures (250, 300 and 325°C) in accordance with their low rank ( Table 2). This behaviour was not observed during the same thermal treatment in non-perhydrous vitrinites [23]. The strong swelling is mainly due to substances assimilated within the ulminite matrix in the perhydrous coal. The massive generation of such substances by cracking processes seems, therefore, to take place in the 325–350°C temperature range. The strong interactions between the impregnating (absorbed) compounds and the vitrinite network could be attributed to the heavy nature of these substances [14].
3.2.2. Optical microscopy determinations: evolution of reflectance, texture
and structure
The evolution of the reflectance of ulminite and phlobaphinite, during the pyrolysis of this perhydrous coal is shown in Table 2. Differences in reflectance between these macerals disappear at the 375°C stage, at which ulminite and phlobaphinite show the same optical properties and reflectance value (1.30%). The components then evolve together up to the 500°C stage reaching a reflectance value close to that of the anthracite rank ( Table 2). This evolution is accompanied by important modifications of the optical texture and structure of the macerals ( Plate 1). Thus, the initial optical characteristics of ulminite and phlobaphinite ( Plate 1a) are maintained almost up to the 350°C stage although a progressive loss of structural definition at the 325°C pyrolysis stage was detected. At this stage ulminite increased its reflectance by 0.11% while phlobaphinite is unchanged ( Table 2). The fluorescence properties previously described for the ulminite component in the raw material [14], which are maintained in colour and intensity through the 250 and 300°C stages, strongly decrease until finally they almost disappear. Some cracks and fractures of different size were also observed. For the 350°C stage reflectances ( Plate 1b) of ulminite and phlobaphinite have considerably increased ( Table 2) and the fluorescence properties are totally lost. Moreover, he morphological characteristics of the particles have changed and the development of a disperse microporosity (<10 μm), irregularly distributed in the coal particles has taken place. At the 375°C stage and above this temperature the original botanical structures of the coal cannot be distinguished ( Plate 1c) and ulminite and phlobaphinite have the same homogeneous appearance and reflectance value. At this temperature, an abundant porosity in the form of large vacuoles of different size (usually higher than 40 μm) with variable morphology is developed ( Plate 1c). Small size-pores, lower than 5 μm, are disperse. This porosity it due to the massive departure and expulsion of the effluents generated at this stage ( Fig. 1). Particles of vitrinite have a specific morphology, which correspond to the broken walls around pores and vacuoles. This significant porosity coincides with the sharp expansion undergone by the coal at this temperature and with the total loss of the free swelling index ( Table 1). For the 400°C stage and above the presence of large vacuoles which in most cases coalesce and a significant microporosity are the most important features. This is more evident in the pyrolysate at 450°C. No orientation was found in the distribution of porosity. At this stage and at 500°C, expansion of the sample during pyrolysis was so great that at optical microscopy scale only the thin and broken walls of the vacuoles remain ( Plate 1d). The absence of anisotropy in the high temperature pyrolysate indicates that the aromatic layers are not sufficiently oriented even if the reflectance value is close to anthracite rank ( Table 2). Thus, for the least three stages of temperatures (400–500°C) the rapid increase in reflectance and the development of a high porous structure of pyrolysates are the most significant features, but they are different to those described for a normal vitrinite pyrolysed in similar conditions. In the case of normal vitrinite the original botanical structures were microscopically discernible up to the 450°C stage [23] and the reflectance slowly increased reaching lower values than those shown by the perhydrous coal. The pyrolysis behaviour of a perhydrous vitrinite is clearly different to that of the non-perhydrous vitrinite as revealed by the evolution of its optical properties.
3.2.3. SEM observations
At the initial stage (25°C) the vitrinite shows a laminar, granular, rough and ridged texture with a heterogeneous aspect (Plate 1e) typical of a botanical structure. These characteristics slowly and progressively change with the increase in temperature (325°C) and are specially evident for the 350°C stage ( Plate 1f). At this stage, at which the thermal degradation of the vitrinite network is significant as shown by the hydrocarbons yield ( Fig. 1) and the variation in optical properties, the vitrinite shows a softened, melted appearance and clot surfaces ( Plate 1f) with limits and borders of rounded particles. At the scale of these observations, porosity in the pyrolysate at 350°C was not observed. These findings differ from those reported for pyrolysates of non-perhydrous vitrinite at the 325 and 350°C stages at which they showed a rigid appearance, clear vacuole development and a porosity of different size [23] related with the loss of water and the expulsion of free hydrocarbons. The behaviour of the perhydrous vitrinite found at 350°C must be mainly due to the substances absorbed in its structure, which contributed to an increase in the fluidity of the vitrinite network, thereby preventing the development of other characteristics. However, a sharp change in the appearance of the vitrinite was produced at 375°C as a consequence of the significant degradation of its structure ( Plate 1g). At this stage vitrinite shows a porous structure in which a massive development of degasification vacuoles ( Plate 1g) has taken place. These vacuoles are of different size (100, 200 μm), but always higher than 40 μm as detected by optical microscopy. However, a porosity of reduced size (<5–10 μm) and of irregular distribution with no preferential orientation has also developed on the walls between vacuoles ( Plate 1g). These walls are of a relatively homogeneous texture ( Plate 1g). All of these characteristics indicate that this sample has gone through a relatively plastic phase at this temperature, developing a highly porous system due to the expulsion of hydrocarbons ( Fig. 1). The progressive pyrolysis gives rise to devolatilisation processes as reflected in the increase of the number, size and morphology of the vacuoles and pores. As a result the thickness of the walls between vacuoles is considerably reduced. The vacuoles tend to coalesce and collapse ( Plate 1h) especially in pyrolysates from the higher stages of the thermal process (500°C stage) because of the massive departure of gas. At this stage, vitrinitic particles show a vitreous aspect ( Plate 1h).
3.2.4. Evolution of textural properties (density and porosity determinations)
The evolution of the textural properties with increasing temperature of pyrolysis is shown in Fig. 3a–c. As expected the real density of the pyrolysates gradually increases with temperature, showing a very good linear correlation (r=0.98) with the atomic ratio H/C (Fig. 3a). This confirms the strong influence of elemental composition and especially of hydrogen content on this parameter [33, 34 and 35]. The variation of the density values for the pyrolysates ( Fig. 3a) shows a similar trend to that described for other thermal treated coals [36]. Such a trend is attributed to the release of volatile matter and the corresponding organisation and rearrangement of aromatic units.
Fig. 3. (a) Evolution of the real (true) density of the perhydrous coal during the pyrolysis process and relationship with the H/C atomic ratio. (b) Variation in pore volume and in pore distribution for the perhydrous coal with increasing pyrolysis temperature. (c) Evolution of the porosity (%) with the increase in the carbon content (%daf) of the pyrolysates.
Fig. 3b shows the evolution trend of the total pore volume (mm3 g−1) and the pore distribution (macro-, meso- and micropore following the IUPAC [37] classification) for pyrolysates from the perhydrous coal. For residues from the 250 to 300°C temperatures, only a slight increase in the amount of micropores with respect to those of the initial stage (25°C) was observed. This increase results from the loss of gases and very light compounds. For the 325°C stage ( Fig. 3b) there is a sharp decrease in total pore volume due to the decrease in the amount of micropores. This could be interpreted as a result of the thermal degradation of the vitrinite matrix and the absorbed substances from which, hydrocarbons are generated and differently mobilised. As the conditions (internal pressure and temperature) in this pyrolysis step are still
not suitable for initiating a massive expulsion of hydrocarbons, they are partially retained inside the vitrinite structure occupying the porosity. The minimum in porosity at 325°C points to the softening of the coal and the beginning of plastic behaviour which is enhanced by the mobilisation and fluidisation of produced hydrocarbons. Above 325°C, when the massive production and expulsion of hydrocarbons ( Fig. 1) is produced, the pore volume (mainly because of the micropore distribution) of the pyrolysates increases progressively ( Fig. 3b) reaching a maximum at 500°C. Above 375°C the increase in pore volume coincides with the development of the significant network of large vacuoles in the residues ( Plate 1) as shown from microscopic determinations.
The increase in porosity agrees with the increase in rank of the solid residues and it correlates with their carbon content (Fig. 3c). However, the increase in porosity, especially above the 450°C stage ( Fig. 3b and c), is higher than in the case of normal vitrinites with a similar carbon content and reflectance values [33]. This disappointing result could be due to the conjunction of two factors, the rapid rise in temperature and the high temperatures used during the pyrolysis process (which favoured the development of porosity in relation to natural vitrinites) and the anomalous behaviour of this sample throughout the pyrolysis process.
3.3. Evolution of the composition and chemical structure of the perhydrous coal during the pyrolysis process
3.3.1. Variation of chemical parameters
The evolution of the volatile matter during the pyrolysis of the perhydrous coal is given in Fig. 4 and compared with data for the non-perhydrous vitrinite [23]. Nishioka et al. [38] have reported that coal pyrolysis can start at low temperatures (250°C) with processes involving chain reactions and/or electrocyclical processes. Thus, the loss of volatile matter for the pyrolysate from the perhydrous vitrinite at 250°C could be interpreted as a result of the cyclisation and aromatisation of alkyl chains and/or aromatisation of hydroaromatic compounds. Between 325 and 400°C, when a significant oil yield is observed ( Fig. 1), the strongest decrease in volatile matter occurs ( Fig. 4), mainly due to the loss of aliphatic structures through depolymerisation reactions. Differences in the decrease in volatiles between the perhydrous and non-perhydrous coals can be attributed to the different oil and gas production ( Fig. 1) at these stages [23]. However, no straightforward correlation between hydrocarbon production and decrease in volatile matter was found. Thus, whereas hydrocarbon expulsion for the perhydrous coal at these temperatures is three times higher than that found for the normal coal the decrease in volatiles is only two times higher. For pyrolysates from the 400–450/500°C range of temperature the loss of volatile matter is lower in the perhydrous vitrinite than in the normal vitrinites and it occurs at higher temperatures ( Fig. 4). These results point to different contributions from the processes of depolymerisation, aromatisation and condensation during the pyrolysis of the two coals and confirm the view that for the normal vitrinites the condensation reactions occur at lower temperatures of pyrolysis. The differences in volatile matter at the 400°C stage between the non-perhydrous and perhydrous vitrinites suggests a higher degree of aromatisation in the latter. This could explain the different behaviour of these residues in relation to condensation processes.
Fig. 4. Evolution of volatile matter content during the pyrolysis process of the two series of coals (perhydrous and non-perhydrous, data for non-perhydrous vitrinite were taken from Jimenez et al. [23]).
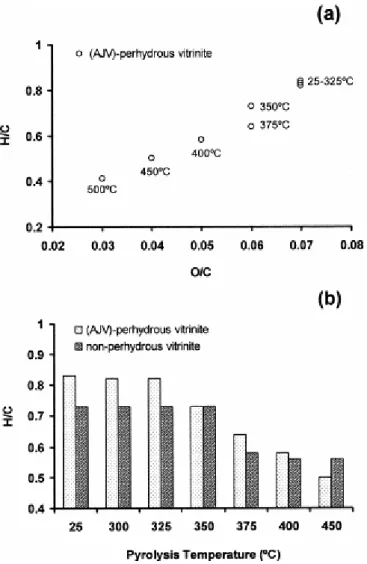
The changes in H/C and O/C atomic ratios (Fig. 5) start above the 325°C stage of pyrolysis and coincide with a significant hydrocarbon production (Fig. 1) and with the changes in the vitrinite structure observed at microscopic scale. These modifications develop at lower temperatures than in the case of non-perhydrous vitrinite ( Fig. 5b) as a result of the high oil expulsion from the perhydrous vitrinite between 325 and 350°C ( Fig. 1). Progressive pyrolysis also produces a greater decrease in the H/C atomic ratio in the case of perhydrous vitrinite ( Fig. 5a and b) but pyrolysates from the 375 and 400°C stages are still very enriched in hydrogen ( Fig. 5b). This could be due to structural differences in the aliphatic structures derived from the hydrogenated substances in the perhydrous vitrinite, which act as hydrogen donors during the thermal evolution.
The S2 parameter (Fig. 6a) progressively decreases in pyrolysates with increasing temperature, especially for the residues obtained at the 350°C stage and above. At these stages the maximum amount of hydrocarbons is generated (Fig. 1) through the thermal degradation of the vitrinitic structure and the compounds adsorbed into this structure. Because of the almost nil hydrocarbon yield at 250°C, the decrease in S2 in the corresponding pyrolysate ( Fig. 6a) cannot be due to thermal extraction. It could be rather interpreted (as in the case of the evolution of the volatile matter content) as a result of processes involving chain reactions and/or aromatisation of hydroaromatics. Such reactions affect the hydrogen transfer processes and thus hydrocarbon potential (S2 peak). For pyrolysates obtained at 400°C and above this stage, the evolutionary trend of S2 is similar in both series of vitrinites ( Fig. 6a). However, below 400°C the behaviour observed is clearly influenced by the different hydrogenation rate of the initial coals (vitrinites).
Fig. 5. (a) van Krevelen type diagram showing the evolution of the atomic ratios for the perhydrous sample. (b) Comparison of the atomic ratio H/C values for the pyrolysates derived from the two series of coals (perhydrous and non-perhydrous, data for non-perhydrous vitrinite were taken from Jimenez et al. [23]).
The increase in the S1 peak (Fig. 6b) up to 350°C is probably due to the release/transformation of the impregnating substances. Heating produces a weakening of the strong interactions between these substances and the vitrinite matrix and also favours their mobilisation. As a result, although the impregnating substances cannot be totally expelled as oils, they can be more easily removed at lower temperature. At the same time, the transformation of some of the heavy substances initially present into lighter compounds cannot be discarded as an explanation of the increase in the S1 values up to the 350°C stage. The change in the nature of the impregnating substances is supported by the total loss of fluorescence properties at this stage.
Fig. 6. (a) Evolution of the Rock–Eval parameters S2 for the pyrolysates derived from the two series of coals (perhydrous and non-perhydrous, data for non-perhydrous vitrinite were taken from Jimenez et al. [23]). (b) Values of the S1 Rock–Eval parameter at different pyrolysis stages for the perhydrous vitrinite.
As expected, Tmax values increase as the pyrolysis temperature increases (Table 3). This
increase starts between 300 and 325°C, so that it occurs at a higher temperature than in the non-impregnated coal series (Table 3). For the perhydrous vitrinite, the strongest modifications of this parameter take place in the 375–400°C and 450–500°C temperature ranges, which indicates that at these temperatures the thermostability of the organic structures undergoes major modifications. On the other hand, the thermostability of the pyrolysates is higher in the case of those from non-perhydrous vitrinite as shown by the higher Tmax values
at the same stages of pyrolysis (Table 3). However, differences in Tmax between the two series
Table 3. Tmax values for the perhydrous vitrinite and its pyrolysatesa
3.3.2. Definition of the pyrolysis stages through the analysis of changes in
functional groups inferred from a FTIR study
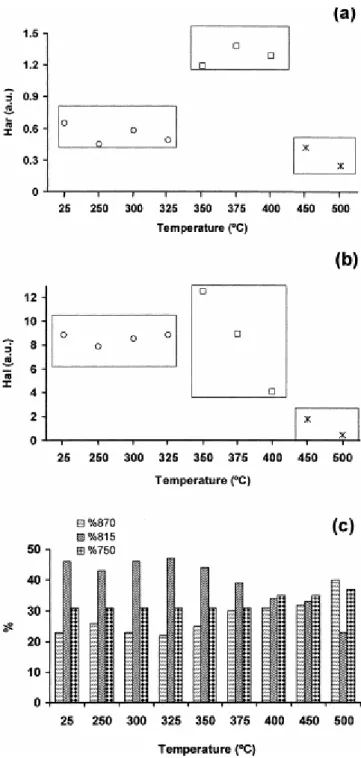
Fig. 7 shows the most significant FTIR spectra for the pyrolysates from the perhydrous vitrinite. Results from a semi-quantitative analysis (aliphatic and hydrogen concentration, and the distribution of the aromatic hydrogen) are depicted in Fig. 8a–c.
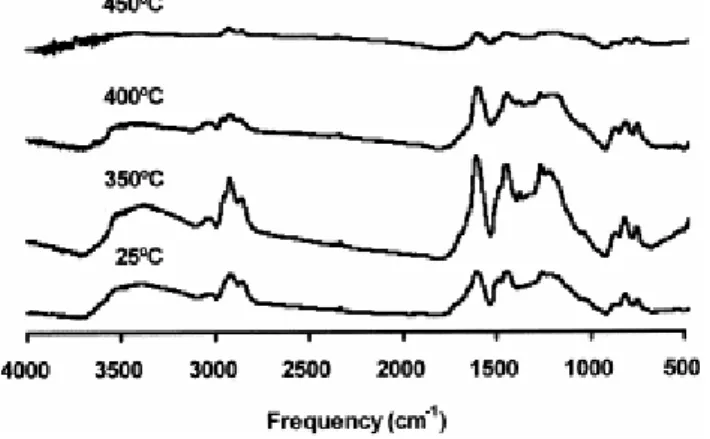
Fig. 7. FTIR spectra of the raw perhydrous coal and their pyrolysates for the most significant stages of temperature (350, 400 and 450°C).
On the basis of the FTIR results, three different stages of pyrolysis temperatures (25–325, 350–400 and 450–500°C) can be distinguished. In the first temperature range (25–325°C) no change in functional groups was found in agreement with the evolution of the elemental composition (Fig. 5). Although other results indicate that the degradation of the vitrinitic structure has already started, this process is not massive as reflected in the unchanged bulk chemical composition ( Fig. 5a and Fig. 8).
Fig. 8. Semi-quantitative FTIR data for raw perhydrous coal and their pyrolysates. (a) Aromatic hydrogen concentration (integrated area between 3100 and 3000 cm−1, aromatic C---H stretching modes); (b) aliphatic
hydrogen concentration (integrated area in the 3000–2700 cm−1, aliphatic C---H stretching modes); (c) aromatic
hydrogen distribution (relative intensities of the aromatic bands between 900 and 700 cm−1, aromatic C---H
out-of-plane bending modes).
Above the first range of temperatures the transformations induced in the vitrinite structure are strong as reflected in the FTIR analysis by the lack of an aromatic band at 1500 cm−1 in the spectrum of the pyrolysate from the 350°C stage (Fig. 7). This band is present in the spectrum of the oil produced at this temperature indicating its highly phenolic nature [14 and 17]. At the same time, the spectrum of the pyrolysate at 350°C shows an overall increase in intensity. This is attributed to changes in the physical structure of the vitrinite (soft and melted appearance) detected at this stage through SEM observations ( Plate 1c).
The FTIR spectra of the pyrolysates between 350 and 400°C (Fig. 7) show a decrease in the broad band centred at 3400 cm−1 (OH groups in phenolic structures) and in the aliphatic stretching modes (3000–2700 cm−1). However, the concentration of aromatic hydrogen (Fig. 8a) does not undergo significant changes although the relative intensity of the 870 cm−1 mode due to isolated aromatic C---H groups and that of the 750 cm−1 mode (four adjacent aromatic C---H groups) increases (see %870 and %750 in Fig. 8c). By contrast, the relative intensity of the 815 cm−1 band due to two and/or three adjacent aromatic C---H groups decreases (%815 in Fig. 8c). These results suggest a competition between desubstitution (increase in aromatic hydrogen) and condensation (decrease in aromatic hydrogen) [39, 40, 41, 42, 43 and 44]. This is confirmed through changes in the distribution of aromatic hydrogen ( Fig. 8c). Thus, the increase in the relative intensity of the 870 cm−1 can be ascribed to the formation of polycyclic aromatic systems [45] whereas the increase in %750 indicates a decrease in the degree of substitution of the aromatic rings.
For the 450 and 500°C stages the FTIR spectrum of the pyrolysates shows a decrease in intensity (Fig. 7) which is a result of the restructuring of the aromatic framework leading to an alignment of the aromatic structures. The decrease in the intensity of the aromatic C---H stretching modes ( Fig. 8a) does not reflect a decrease in the concentration of the aromatic hydrogen as a result of condensation reactions as previously reported [41] or as occurs during natural coalification to the anthracite rank [43 and 44]. The lack of variation in the distribution of the aromatic hydrogen ( Fig. 8c) confirms this view. The concentration of the aromatic and aliphatic hydrogen in this range of temperatures (450–500°C) does not significantly vary ( Fig. 8a and b). However, a drastic change in the relative intensity of the aromatic bands between 900 and 700 cm−1 is observed (Fig. 8c). A noticeable increase in the %870 ( Fig. 8c) indicates a cross-linking and condensation of the aromatic framework. The increase in cross-linking explains why, although some alignment of the aromatic structures takes place in the 400–450°C range of temperatures, the pyrolysates do not develop anisotropic characteristics. The preponderance of the process of aromatic condensation between 450 and 500°C, confirms the contribution of this process to the gas generated at these temperatures ( Fig. 1) and to the decrease in volatile matter content in the corresponding pyrolysates ( Fig. 4).
3.3.3. Composition and structural study of the extractable fraction (from
the raw sample and pyrolysate at 250°C) and of oils produced during the
pyrolysis process (300–500°C temperature range)
In this work, the assignment of the 1H-NMR and 13C-NMR spectra was carried out according to the literature [46, 47, 48, 49, 50, 51 and 52]. In Fig. 9, the chromatograms and 1H-NMR spectra of the soluble organic fractions from the perhydrous raw vitrinite and its pyrolysate at 250°C are depicted. Table 4 and Table 5 show the identification of the major compounds present in the volatile fraction and the 1H-NMR quantitative data, respectively.
Fig. 9. (a) Gas chromatograms and (b) 1H-NMR spectra of the soluble fractions from the raw perhydrous coal
and its pyrolysate at 250°C.
Table 4. Major compounds in the soluble fractions identified by GC/MS (raw perhydrous vitrinite and in its pyrolysate at 250°C) and in the oils generated between 300 and 500°Ca
Table 5. Quantitative 1H-NMR data for soluble organic fractions (raw perhydrous vitrinite, 25°C, and its
pyrolysate at 250°C) and the oils produced between the 300 and 500°C stages of pyrolysisa
Soluble fractions (from the raw vitrnite and its pyrolysate at 250°C) show the same qualitative composition and some differences in the quantitative analysis. Chromatographic results show a higher degree of substitution in the naphthalene derivatives for the 250°C pyrolysate extract (Fig. 10a). The relative contribution of naphthalene derivatives with respect to phenanthrene and dibenzofurane derivatives is also lower in this extract than in the raw sample extract (Fig. 10b). However, the distribution of alkyl derivatives of naphthalene and phenanthrene is the same in both cases ( Fig. 10c and d). This result indicates that the differences in the proportion of the compounds present in the volatile fraction of the extracts are more likely to be due to the composition of the absorbed substances than to the thermal transformations of these
compounds. Thus, pyrolysis causes a weakening of the forces of interaction between the impregnating substances in the vitrinite and the vitrinite matrix itself and in consequence these substances can be extracted.
Fig. 10. Semi-quantitative GC data for the soluble fractions of the raw perhydrous coal and its pyrolysate at 250°C. (a) Contribution of naphthalene and C1–C3 alkyl naphthalenes to the total amount of naphthalene derivatives in the volatile fraction. (b) Ratio of naphthalene derivatives to phenanthrene and dibenzofuran derivatives. (c) Distribution of the C1 and C2 naphthalenes. (d) Distribution of the C1 phenanthrenes.
The aromatic hydrogen is higher in the extract of the 250°C pyrolysate than in that of the raw vitrinite (Table 5) and significant changes in the aliphatic 1.1–2.1 and 2.1–4.3 ppm regions can be observed ( Fig. 9b and Table 5). Fig. 9b shows a clear decrease in the signal at δ=1.28 ppm due to CH2 groups in relatively long chain n-alkyl aromatics [53 and 54]. Thus, the
overall decrease in the contribution of protons between 1.1 and 2.1 ppm is due to the decrease in the relative contribution of the protons in the 1.1–1.5 ppm range ( Table 5). On the other hand, the relative contribution of protons in the 1.5–2.1 ppm range, which contains the resonances of βCH2 and CH in hydroaromatic structures, increases slightly (Table 5). In the
region due to aliphatic protons in alkyl groups directly bonded to an aromatic ring (2.1–4.3 ppm) most of the signals fall between 2.4 and 3.5 ppm (αCH2, CH). Thus, the increase in the
relative contribution of protons in the 2.1–4.3 ppm range from the raw sample extract to the 250°C pyrolysate extract (Table 5) is due to a higher concentration of αCH2 groups. These
results indicate a decrease in the average aliphatic length with a subsequent increase in aromaticity. This can be rationalised through the cyclisation of aliphatic chains with the formation of hydroaromatic structures, which are further dehydrogenated to aromatics [51]. These results confirm the view that during pyrolysis at 250°C, thermal reactions involving
chain reactions take place, thus explaining the variation in some of the chemical parameters for the 250°C pyrolysate as mentioned above (see Fig. 4 and Fig. 6a).
Fig. 11 show, the 1H-NMR and 13C-NMR spectra of the oils generated in the 325–400°C range of temperatures. The quantitative data deduced from the 1H-NMR of the oils generated in the entire range of temperatures (300–500°C) are given in Table 5. The total amount of aromatic and aliphatic hydrogen does not show significant variation between the analysed oils, it being similar to that obtained for the 250°C pyrolysate extract. However, changes in the shape of these regions indicate that the aromatic and aliphatic protons arise from different types of structures in the 250°C pyrolysate extract and in the oils. The close similitude between the 1H-NMR spectra of the oils generated at 325 and 300°C and those obtained for the 250°C pyrolysate extract (Fig. 9b and Fig. 11a) indicates that thermal extraction with the release of some of the absorbed substances plays an important role during pyrolysis at these temperatures, especially at 300°C. However, this is not the only process taking place at these stages as shown by the differences found in the 2.1–3.5 and 1.5–2.1 ppm regions. Thus, in the first region (2.1–3.5 ppm) the oils display signals between 2.1 and 2.4 ppm ( Fig. 11a) typical of methyl substituents directly attached to the aromatic ring which are not observed in 250°C pyrolysate extract ( Fig. 9b). The presence of these groups seems to be related with the increase in aromatic protons on uncondensed structures (see the broadening between 6.4 and 7.2 ppm in Fig. 11a). The qualitative differences between the spectra of the 250°C pyrolysate extract and the oils are also reflected from the quantitative point of view ( Table 5). On the other hand, the 13C-NMR spectra (Fig. 11b) of the 300 and 325°C oils show clear signals due to phenol derivatives at 149–157 ppm (Car–OH), 110–118 ppm (Car–H ortho to Car–OH), 119–112 ppm (Car–H para to Car–OH) and 122–124 ppm (Car–CH3 ortho to Car–OH). The
presence of phenol derivatives in these oils suggests the beginning of the degradation of the vitrinite phenolic structure between 250 and 300°C although the intensity of such degradation is not sufficient to affect the elemental composition of the pyrolysates at these stages (see Fig. 5).
The presence of phenolic compounds is confirmed in the chromatogram of the oil obtained at 325°C (Fig. 12a and Table 4). The intensity of peak 3 m-, p-cresol and the presence of the aromatic absorption at 1500 cm−1 in the FTIR spectrum of this oil indicate the higher
contribution of para-alkyl substituted phenols reported for the raw perhydrous coal [17]. The other identified compounds are those present in the extracts from the raw sample and 250°C pyrolysate. The contribution of these compounds is high, confirming the view that the release of absorbed substances is also an important process at this temperature. At the 350°C stage and above the nature of the oils is predominantly phenolic ( Fig. 12a). The relative contribution of phenol derivatives increases as the temperature rises, mainly due to the increase in the amount of C1 and C2 alkyl derivatives ( Fig. 12b). The strong modification of the nature of the oils generated above 325°C associated with the mentioned degradation of the phenolic structure is also clearly reflected in the 1H-NMR and 13C-NMR spectra (Fig. 11). At the same time, the spectra also show modifications in the assimilated substances within the vitrinite matrix.
Fig. 12. (a) Gas chromatograms of the oils produced at the 325 and 350°C pyrolysis temperatures. (b) Concentration of phenol derivatives in the volatile fraction of the oils produced between 325 and 500°C. (c) Plot of the total amount of phenol derivatives in the volatile fraction of the generated oils vs. the concentration of methyl derivatives directly bonded to the aromatic ring from the 1H-NMR spectra of the oils.
A sharp decrease in the singlet at δ=1.28 ppm and a broadening in the 1.1–1.5 ppm range can be observed in the 1H-NMR spectrum of the oil generated at 350°C (Fig. 11a). Above 350°C the singlet at 1.28 ppm is almost absent and new signals in the 1.1–1.5 ppm region appear. The contribution of aliphatic protons in α to the aromatic ring (2.1–4.3 ppm) increases and the signals due to CH3 groups directly bonded to the aromatic ring (2.1–2.4 ppm) become more
significant (Fig. 11a and Table 5). The increase in the relative contribution of these methyl groups is closely related to the increase in phenol derivatives in the volatile fraction ( Fig. 12c). The aliphatic region of the 13C-NMR spectrum of the oil obtained at 350°C shows an increase in the number and relative intensity of the signals with respect to that obtained at 325°C. Consequently, the aromaticity factor (fa=Car/Ctotal) decreases from 72% in the oils obtained at 300 and 325°C to a value of 65% for the oil at the 350°C stage. Between 350 and 375°C stage the contribution of aliphatic structures decreases, and, the aromaticity increases (fa=72%). The quantitative analysis also shows a decrease (increase) in the contribution of CH2+CH (CH3) groups to the total amount of aliphatic carbon, from 55% (45%) at the 350°C
stage to 52% (48%) at the 375°C stage. A simplification of the 13C-NMR region due to methyl groups in α to the aromatic ring (18–23 ppm) with a preponderance of the signal at 21 ppm is also observed (Fig. 11b). Above the 375°C stage the 13C-NMR spectra of the generated oils do not show any significant variation either from the qualitative or the quantitative point of view. The results obtained are rationalised through the cracking of the long chain aromatics and the formation of newly substituted aromatic compounds, due to mainly the degradation of the phenolic structure of the vitrinite network. The results obtained also confirm the view that the transformation of the heavy compounds absorbed by the vitrinite matrix to lighter compounds contributes to gas production in the 325–375°C temperature range and to an increase in S1 value up to the 350°C stage of pyrolysis (Fig. 6b). In the aromatic region of the 1H-NMR for the oils obtained above 325°C (Fig. 11a) there is a clear increase in the amount of protons in uncondensed structures (6.4–7.2 ppm). Furthermore, the spectra of the oils obtained at 375°C and above this temperature show two multiplets centred at 6.7 and 7.0 ppm with a multiplicity pattern corresponding to an AA′XX′ spin system. These results, therefore, agree with the predominantly phenolic nature of the oils with a clear preponderance of para-methyl phenol. Similarly, in the 13C-NMR (Fig. 11b) the contribution of signals due to aromatic carbons in phenol derivatives (149–157, 122–124, 119–122 and 110–118 ppm ranges) increases and there is a decrease in the broadening in the aromatic region between 120 and 130 ppm. The 13C-NMR spectra also show that in the oils produced by the perhydrous vitrinite the major sites of alkyl substitution in phenol derivatives are, in agreement with the ligneous nature of the raw material, the two and four positions whereas meta isomers are almost absent. Thus, no signals in the 100–113 ppm range can be observed but the resonances due to Car–H ortho to Car–OH fall between 114 and 118. No significant signals at 139 ppm (Car–CH3 meta to Car–OH) were produced and no quaternary
4. Summary
The results obtained show that the studied coal with its structure affected by assimilation (impregnation) of hydrocarbons or oil-like substances develops a specific evolution pathway during the pyrolysis process. This evolution pathway clearly differs from that followed by non-perhydrous coals with a normal H/C atomic ratio. This is thought to be due to the structural differences in the vitrinite network of the perhydrous and non-perhydrous samples and the presence of absorbed (impregnating) substances in the reacting medium. Although thermal evolution was performed in an open-medium pyrolysis system, the assimilated substances in the vitrinite structure are unambiguously present up to the 400°C stage of temperature. This suggests strong interactions between these compounds and the vitrinite network, which are favoured by the heavy nature and the high polarisability of these compounds. Thermal treatment debilitates the interactions between the absorbed substances and the vitrinite matrix. The increase in temperature also produces modifications in the assimilated substances and some of their heavy compounds are converted into light compounds. The presence of the absorbed substances within the vitrinite matrix in the reacting medium, enhances the hydrogenation processes during pyrolysis relative to the polymerisation and recombination reactions which predominate during the thermal treatment of the non-perhydrous coals.
Although the raw material is a non-coking coal, the coal passes through a relatively plastic phase during the low-temperature pyrolysis process. The softening of the coal and plastic behaviour were favoured by the mobilisation and fluidisation of the compounds assimilated by the vitrinite structure. However, the modifications to the nature of these substances as result of the increase in temperature and cross-linking in the final stages of the thermal treatment, do not allow sufficient orientation of the aromatic layers and in consequence, the vitrinite at these stages of evolution still shows an isotropic behaviour.
On the basis of the structural and chemical changes observed during the thermal evolution of the perhydrous coal studied, the following three phases can be distinguished.
4.1. Stage I (25–235°C)
Pyrolysis at 250°C does not supply sufficient energy to degrade the structure of the coal (huminite/vitrinite) but it does affect the hydrocarbons assimilated by this structure. Thus, processes of cyclisation and aromatisation involving chain reactions were found at this step of pyrolysis. For the 300 and 325°C range of temperatures, the thermal degradation of vitrinite with the release of some of the absorbed substances plays an important role although the extent of the degradation is not sufficient to affect the bulk of the elemental composition or functional groups. In this phase, the conditions of pressure and temperature are still not adequate for causing a massive expulsion of the generated hydrocarbons. The hydrocarbons are therefore retained inside the vitrinite structure, occupying its porosity, until they are expelled out of the system.
4.2. Stage II (350–400°C)
In this phase, the massive breakdown of the vitrinite network produces strong modifications in the physico-chemical structure. The structural and textural homogenisation of the vitrinite is complete at the 375°C stage, but the perhydrous character of the raw material still remains
in this stage and at 400°C. The generated oils show a mainly phenolic nature with a clear preponderance of p-alkyl substituted phenol derivatives. Nevertheless, the oil produced at 350°C also shows a noticeable contribution of the substances assimilated into the vitrinite structure, but strongly modified by the conversion of some of the heavy compounds into lighter ones. At the end of this stage when the influence of the substances assimilated by the vitrinite structure has considerable decreased a significant increase in the thermostability of the pyrolysates takes place. Structural differences in the pyrolysate obtained at the 400°C stage with respect to the corresponding pyrolysate of the non-perhydrous coal, seem to be the factor responsible for the higher energy required to produce the condensation reactions in solid residues with the additional increase in temperature.
4.3. Stage III (450–500°C)
The rapid increase in reflectance and the development of a highly porous structures in pyrolysates are typical of this phase of pyrolysis. At 450°C a restructuring of the aromatic framework and the production of some alignment of the aromatic structures take place but the reorientation of the aromatic layers is not sufficient to produce anisotropy. Furthermore, the rise in pyrolysis temperature (500°C stage) increase the degree of cross-linking and condensation in the pyrolysate.
Acknowledgements
Financial support for this work was provided through a contract with the European Community (No. 7220/EC-769). The authors thank Professor F. López Ortiz (from the University of Almería, Spain) for the NMR analyses. Dr A. Jiménez (from the University of Oviedo, Spain) and J.R. Montes (from INCAR — CSIC, Spain) are also thanked for some experimental analyses as well as the preparation of the samples.
References
1. H. Fang and C. Jianyu. J. Petrol. Geol. 15 (1992), p. 419.
2. M.G. Fowler, T. Gentzis, F. Goodarzi and A.E. Foscolos. Org. Geochem. 17 (1991), p. 805. 3. W.A. Hartgers, J.S.S. Damsté, J.W. de Leeuw, Y. Ling and G.R. Dyrkacz. Energy Fuels 8 (1994), p. 1055.
4. B.A. Stankiewicz, M.A. Kruge and M. Mastalerz. Org. Geochem. 24 (1996), p. 531.
5. J.C. Quick. In: P.K. Mukhopadhyay and W.G. Dow, Editors, Vitrinite Reflectance as a
Maturity parameter. Applications and Limitations. ACS Symposium Series No. 570, American
Chemical Society, Washington, DC (1994), p. 64. 6. A.C. Hutton and A.C. Cook. Fuel 59 (1980), p. 711.
7. W.D. Kalkreuth. Bull. Can. Petrol. Geol. 30 (1982), p. 112. 8. L.C. Price and C.E. Barker. J. Petrol. Geol. 8 (1985), p. 59.
9. D.G. Murchison, J. Pearson and A.C. Raymond. Bull. Soc. Geol. France 162 (1991), p. 183.
10. M. Mastalerz, K.R. Wilks and R.M. Bustin. Org. Geochem. 20 (1993), p. 555.
11. T. Gentzis and F. Gooddarzi. In: P.K. Mukhopadhyay and W.G. Dow, Editors, Vitrinite
Reflectance as a Maturity parameter. Applications and Limitations. ACS Symposium Series No. 570, American Chemical Society, Washington, DC (1994), p. 93.
12. H.I. Petersen and H. Vosgerau. Int. J. Coal Geol. 41 (1999), p. 257. 13. M. Teichmüller. Int. J. Coal Geol. 20 (1992), p. 1.
14. I. Suárez-Ruiz, M.J. Iglesias, A. Jiménez, F. Laggoun-Défarge and J.G. Prado. In: P.K. Mukhopadhyay and W.G. Dow, Editors, Vitrinite Reflectance as a Maturity Parameter.
Applications and Limitations. ACS Symposium Series No. 570, American Chemical Society,
Washington, DC (1994), p. 76.
15. M.J. Iglesias, A. Jiménez, F. Laggoun-Défarge and I. Suárez-Ruiz. Energy Fuels 9 (1995), p. 458.
16. A. Jiménez, M.J. Iglesias, F. Laggoun-Défarge and I. Suárez-Ruiz. Chem. Geol. 150 (1998), p. 197.
17. M.J. Iglesias, A. Jiménez, J.C. del Río and I. Suárez-Ruiz. Org. Geochem. 31 12 (2000), p. 1285.
18. S. Creaney, D.E. Pearson and L.G. Marconi. Fuel 59 (1980), p. 438.
19. B.-P. Perrusel, F. Laggoun-Défarge, I. Suárez-Ruiz, A. Jiménez, M.J. Iglesias and J.-N. Rouzaud. In: B.Q. Li and Z.Y. Liu, Editors, Prospects for Coal Science in the 21st Century, Sanxi Science 6 Technology Press, Taiyuan, P.R. China (1999), p. 145.
20. R. Sakurovs and L.J. Lynch. Fuel 72 (1993), p. 743.
21. M.A. Diez, A. Domínguez, C. Barriocanal, R. Alvarez, C.G. Blanco, M.D. Casal and C.S. Canga. J. Chromatogr. A 823 (1998), p. 527.
22. R. Moliner, I. Suelves and M.J. Lázaro. Energy Fuels 12 (1998), p. 963.
23. A. Jiménez, M.J. Iglesias, F. Laggoun-Défarge and I. Suàerz-Ruiz. J. Anal. Appl. Pyrol.
50 (1999), p. 117.
24. I. Suárez-Ruiz, L. Martinez, Ph. Bertrand, J.G. Prado and J.R. Disnar. Int. J. Coal Geol.
25 (1994), p. 47.
25. J. Espitalié, G. Deroo, F. Marquis, Rev. Inst. Fr. Petrol. 40/5 (1985) 563, 40/6 755. 26. J. Espitalié, G. Deroo and F. Marquis. Rev. Inst. Fr. Petrol. 784 4171 (1986), p. 73.
27. P.R. Solomon, D.G. Hamblen and R.M. Carangelo. In: E.L. Fuller, Editor, Coal and Coal
Products, ACS Symposium Series No. 205, American Chemical Society, Washington, DC
(1982), pp. 77–131.
28. P. Painter, M. Starsinic and M. Coleman. In: J.R. Ferraro and L. Basile, Editors, Fourier
Transform Infrared Spectroscopy 4, Academic Press, Orlando, FL (1985), pp. 169–241.
29. P.G. Rouxhet, P.L. Robin and G. Nicaise. In: B. Duran, Editor, Kerogen: Insoluble
Organic Matter from Sedimentary Rocks, Editions Technip, Paris (1980), p. 163.
30. C.G. Blanco, J.G. Prado, M.D. Guillen and A.G. Borrego. Org. Geochem. 18 (1992), p. 313. Abstract
31. L. Mansuy, P. Landais and O. Ruau. Energy Fuels 9 (1995), p. 691.
32. L. Mansuy and P. Landais. Energy Fuels 9 (1995), p. 809. 33. D.W. van Krevelen. Coal, Elsevier, Amsterdam (1993).
34. B.K. Mazumdar. Fuel Process. Tech. 19 (1988), p. 179. 35. S. Fulii and H. Tsuboi. Fuel 46 (1967), p. 361.
36. Y. Toda. Fuel 52 (1973), p. 99.
37. IUPAC. Manual of symbols and terminology, Appendix 2, Pt. 1, Colloid and Surface Chemistry, Pure Appl. Chem., 31 (1972) 578.
38. M. Nishioka and J.W. Larsen. Energy Fuels 2 (1998), p. 351.
39. M.A. Serio, D.G. Hamblen, J.R. Marham and P.R. Solomon. Energy Fuels 1 (1987), p. 138.
40. A.M. Vasallo, Y.L. Liu, L.S.K. Pang and M.A. Wilson. Fuel 70 (1991), p. 635. 41. P. Landais and L. Gérard. Int. J. Coal Geol. 30 (1996), p. 285.
42. M. Monthioux and P. Landais. Energy Fuels 2 (1998), p. 794. 43. J.K. Brown, J. Chem. Soc. London (1955) 744.
44. M.A. Wilson, R.J. Pugmire, J. Karas, L.B. Alemany, W.R. Woolfenden, D.M. Grant and P.H. Given. Anal. Chem. 56 (1984), p. 933.
45. J.V. Ibarra, E. Muñoz and R. Moliner. Org. Geochem. 24 (1996), p. 725. 46. C.E. Snape, W.R. Ladner and K.D. Bartle. Anal. Chem. 51 (1979), p. 2189.
47. K.D. Bartle, W.R. Ladner, T.G. Martin, C.E. Snape and D.F. Williams. Fuel 58 (1979), p. 413.
48. P.L. Gupta, P.V. Dogra, P.K. Kuchhal and P. Kumar. Fuel 65 (1986), p. 515. 49. L.R. Rudnick and L.G. Galya. Energy Fuels 5 (1991), p. 733.
50. G. Dosseh, B. Rousseau, A.H. Fuchs, Fuel 70 (1991) 641.
51. Z. Benkhedda, P. Landais, J. Kister, J.-M. Dereppe and M. Monthioux. Energy Fuels 6 (1992), p. 166.
52. J. Keeler, R.T. Clowes, A.L. Davis, E.D. Laue, in: T.L. James, N. Oppenheimer (Eds.), Methods in Enzymology, vol. 239, 1994 Academic Press, New York, p. 145.
53. J. Thiel and H. Wachowska. Fuel 68 (1989), p. 758. 54. W.H. Calkins and R.J. Tyler. Fuel 63 (1984), p. 1119