HAL Id: insu-02165141
https://hal-insu.archives-ouvertes.fr/insu-02165141
Submitted on 25 Jun 2019
HAL is a multi-disciplinary open access
archive for the deposit and dissemination of
sci-entific research documents, whether they are
pub-lished or not. The documents may come from
teaching and research institutions in France or
abroad, or from public or private research centers.
L’archive ouverte pluridisciplinaire HAL, est
destinée au dépôt et à la diffusion de documents
scientifiques de niveau recherche, publiés ou non,
émanant des établissements d’enseignement et de
recherche français ou étrangers, des laboratoires
publics ou privés.
Seismic imaging of the 1999 Izmit (Turkey) Rupture
inferred from the near-fault recordings
Michel Bouchon, Nafi Toksöz, Hayrullah Karabulut, Marie-Paule Bouin,
Michel Dietrich, Mustafa Aktar, Margaret Edie
To cite this version:
Michel Bouchon, Nafi Toksöz, Hayrullah Karabulut, Marie-Paule Bouin, Michel Dietrich, et
al..
Seismic imaging of the 1999 Izmit (Turkey) Rupture inferred from the near-fault
record-ings.
Geophysical Research Letters, American Geophysical Union, 2000, 27 (18), pp.3013-3016.
�10.1029/2000GL011761�. �insu-02165141�
GEOPHYSICAL RESEARCH LETTERS, VOL. 27, NO. 18, PAGES 3013-3016, SEPTEMBER 15, 2000
Seismic Imaging of the 1999 Izmit (Turkey) Rupture
Inferred from the Near-Fault Recordings
1 Nail Toks6z
2 Hayrullah
Karabulut,
ø Marie-Paule
Bouin,
4
Michel Bouchon,
,
3,• and Margaret Edie
2
• Mustafa Aktar,
Michel Dietrich,
Abstract.
We use near-fault accelerograms to infer the space-time history of rupture on the fault during the Izmit earth- quake. The records show that the ground displacement and velocity near the fault were surprisingly simple. Rupture propagated toward the west at a velocity of
about 3 km/s, and toward the east at a remarkably high average velocity of 4.7 km/s over a distance of about 45 km before decelerating to about 3.1 km/s on the east-
ern segment. Slip on the fault is particularly large down to a depth of 20 km on the central portion of the fault where it reaches about 7 m. Slip is large also below 10 km on the eastern fault segment, and this may have contributed to the loading of shear stress on the Diizce fault. On the western fault segment, large slip seems confined to shallow depths.
is located very close to ARC, and the ground velocities there display waveforms and amplitudes similar to those at ARC. The digital records at ARC are, however, of much better quality than the analog records at GBZ, and, for this reason, we shall use ARC as our modeling station. The other station that we did not use is YPT because records there are more complicated and have a longer duration than records at ARC and SKR, located further from the epicenter. This complexity suggests that at this station the records are more affected by the shallow crustal structure below the site or between the station and the fault.
Ground velocity at the westernmost site (ARC), lo-
cated 50 km from the epicenter and about 10 km from
Introduction
The Izmit earthquake of August 17 1999 broke a long segment of the North Anatolian fault zone. Its surface
rupture runs nearly east-west and extends over at least
120 km. Surface slip is almost pure right-lateral strike- slip and ranges, over most of the surface break, between
1.5 m and 5 .-n [ToksSz et ai., 1999].
Ground motion near the fault
Six accelerometer stations installed and operated by Bo•azigi University and by the General Directorate of Disaster Affairs recorded the earthquake ground mo- tion at close distance from the fault. We shall use in this study the records obtained at four of these sta- tions, which are displayed in Figures i and 2. They are records of the ground velocity and are obtained by integrating the accelerograms. The four correspond-
ing stations (ARC, IZT, SKR, DZC) are distributed rather uniformly along the line of rupture (Figure 3a). Of the two stations that we did not use, one (GBZ)
•Universitd Joseph Fourier, Grenoble, France
2Massachusetts Institute of Technology, Cambridge, Mas- sachusetts
3Bogaziq;i University, Kandilli Observatory, Istanbul
4Institut de Physique du Globe, Paris
$Tiibitak, Marmara Research Center, Gebze, Turkey
Copyright 2000 by the American Geophysical Union. Paper number 2000GL011761. 0094-8276/00/2000GL011761505.00 ARC a time(s) o 5 •o •5 2o z• 3o • •oo
displacement
•
•-
/
SKR
•
C
P S
b
I l
time(s} _ 10 15 2o 25 3o 35•
141
cm
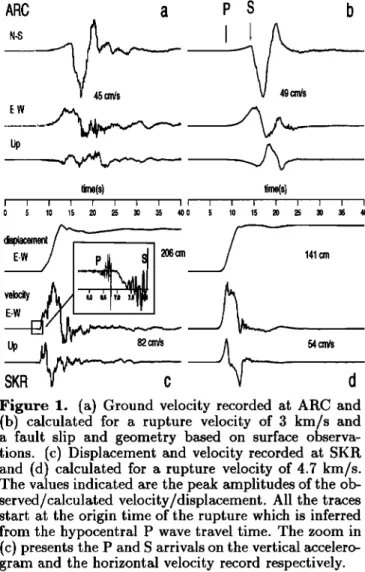
Figure 1. (a) Ground velocity recorded at ARC and (b) calculated for a rupture velocity of 3 km/s and
a fault slip and geometry based on surface observa-
tions. (c) Displacement and velocity recorded at SKR and (d) calculated for a rupture velocity of 4.7 km/s.
The values indicated are the peak amplitudes of the ob-
served/calculated velocity/displacement. All the traces
start at the origin time of the rupture which is inferred from the hypocentral P wave travel time. The zoom in
(c) presents the P and S arrivals on the vertical accelero-
gram and the horizontal velocity record respectively. 3013
3014 BOUCHON ET AL.' SEISMIC IMAGING OF THE IZMIT RUPTURE i i i i i i i i i i o 5 lO
DZC time(s)
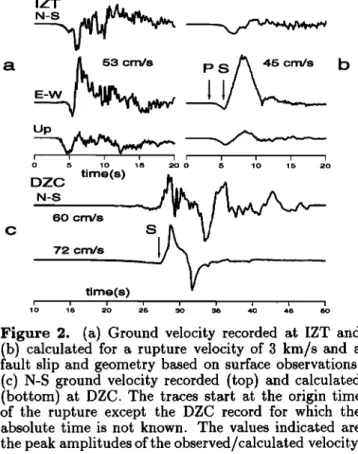
60 cm/s c time(s) 20 40Figure 2. (a) Ground velocity recorded at IZT and
(b) calculated
for a rupture velocity
of 3 km/s and a
fault slip and geometry based on surface observations.
(c) N-S ground velocity recorded (top) and calculated (bottom) at DZC. The traces start at the origin time
of the rupture except the DZC record for which the
absolute time is not known. The values indicated are
the peak amplitudes of the observed/calculated velocity.
the fault, are displayed in Figure la. The records there are surprisingly simple. The largest motion is transverse
to the fault (N-S) with the peak amplitude of the pulse
directed toward the south. This is what is expected at this location for a right-lateral strike-slip fault prop- agating westward toward the station, based on previ-
ous experience [1966 Parkfield (Aki, 1968); 1979 Coyote Lake (Bouchon, 1982); 1979 Imperial Valley (Archuleta, 1982)]. The simplicity of the transverse pulse, made-up
mostly of SH-waves, indicates that the propagation of the waves, from the fault to the station, was not signif- icantly affected by near-surface sediments which would otherwise have produced a more complex waveform.
In order to further understand these records, we
model the earthquake as a rupture which starts at the
hypocenter and propagates radially on the fault. The fault geometry considered is made-up of several seg- ments which follow the surface breaks and are vertically
dipping from the surface to 20 km (Figure 3a). Slip is
assumed to be horizontal and constant with depth but varies along the fault strike according to the values mea- sured at the surface. The upper crust is chosen to be
uniform with P and S wave velocities of 6 km/s and 3.46 km/s, respectively. Below 16 km, these velocities increase to 6.3 km/s and 3.64 km/s. The crust is 32
km thick and P and S velocities below the Moho are
8 km/s and 4.6 km/s, respectively. The rupture veloc- ity is uniform and equal to 3 km/s. Slip on the fault
is assumed to grow as a ramp function starting at the arrival of the rupture front and stopping 3 s later. The calculation is performed using the discrete wavenumber
method [Bouchon, 1981] where the fault is represented
by 10800 point double-couple sources distributed on the fault surface at 500 m spacing.
The results of the calculation are shown in Figure lb. The calculated ground velocity explains remarkably well the one which took place during the earthquake. The
N-S motion starts with the arrival of the P-wave, which
in the near-field displays a component of motion trans- verse to the traveling direction. The motion is reversed at the arrival of the S-wave and the maximum of the pulse corresponds to the passage of the rupture front close to the station. As expected the first motion is down and toward the east, but the presence of a trans- verse component to the P wave adds a slight northerly motion. A second integration of the velocity records, not shown here, yields a static displacement of the sta- tion of 51 cm in the N105øE direction.
The ground velocity at SKR is displayed in Figure lc. At this station, located 34 km due east of the epi- center, the N-S component was not working. The other records there are, however, most remarkable, the dou-
ble integration of the E-W acceleration (upper trace in Figure lc) yielding a simple displacement waveform
dominated by a static displacement of the station of 2 m toward the east. The timing of the P and S wave arrivals at SKR can be seen on the enlarged picture of the beginning of the E-W velocity record displayed in Figure lc. Also shown on this picture is the arrival of the P wave on the vertical accelerogram, where it is the easiest to identify. The measured S minus P time of about 1.8 s is much shorter than the one expected
(about 4.5 s) for an hypocentral distance of 38 km. As shown by Ellsworth and Celebi [1999], this implies
that the rupture propagated at a supershear velocity be- tween the hypocenter and SKR and yields an average
rupture velocity of 4.7 km/s on this part of the fault.
These records provide the first direct measurement of a supershear rupture velocity. They confirm previous indirect inferrences of supershear velocity made most
notably by Archuleta [1984] for the 1979 Imperial Val-
ley earthquake. The good agreement of the recorded waveforms with the ones calculated for the fault model
previously described and a rupture velocity of 4.7 km/s (Figure ld) confirms the high value obtained. Simu-
lations made with sub-shear or shear rupture velocities show a slow amplitude build-up of the E-W and vertical pulses between the P and S arrivals, similar to the ones observed at ARC, inconsistent with the sharp beginning of the observed pulses.
Ground acceleration at the other two stations (IZT and DZC) were triggered analog recordings. For this
reason, the quality of the records is not as good as at SKR and ARC and the integration process is less stable. These recordings nevertheless provide impor- tant information on the rupture history of the earth-
quake. The one at IZT (Figure 2a) is obtained only a
few kilometers away from the epicenter. The first mo- tion is a dilatation, indicating that the epicenter lies
BOUCHON ET AL.: SEISMIC IMAGING OF THE IZMIT RUPTURE 3015 o o 29 ø 30' 30 ø 00' 30 ø 30' 31 ø 00' I I i I -30 -20 -10 0 -50 -40 10 -50 -40 -30 -20 - 10 0 10 , ,, I i I 2O 3O 40 50 60 70 80 70 6.0 4.0 3O 20 30 40 50 60 70 80 E .,• (3) ,, ..c: 10 •, 4 • !• :• 40 • • ß ' . • • •o , 20 I I I I I I I i I I • ' ' -50 -40 -30 -20 -10 0 10 20 30 40 50 60 70 80
distance along fault (kin)
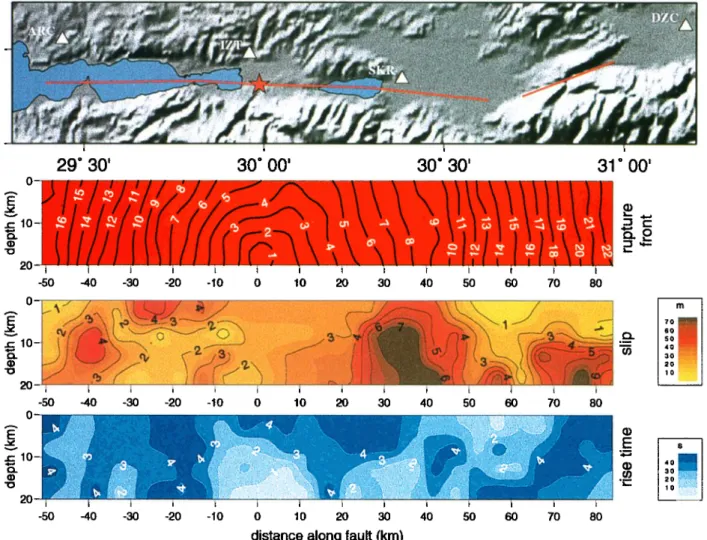
Figure 3. (a: Top) Map of the surface
rupture
of the Izmit earthquake
(red line). The star indicates
the location
of the epicenter
and the triangles
are the recording
stations.
(b: Middle and bottom) Images
of the rupture
front,
slip, and rise time on the fault. The rupture
front is shown
at 1 s intervals
from the beginning
of rupture.
slightly east of the station. The S wave arrives 2.3 s after the beginning of the record which, if one assumes that the instrument was triggered by the first ground vibration, yields an hypocentral depth of 17 kin. This station thus confirms with precision the location of the epicenter and the depth of nucleation. It also shows that rupture propagated upward from the hypocenter at an average velocity not exceeding the crustal shear wave velocity. The ground velocity calculated with the previously-described fault model and a rupture velocity
of 3 km/s (Figure 2b) provides a reasonably good fit
to the first few seconds of motion, except that the time build-up of the calculated pulses is less steep than the observed one. This suggests that the slip rise time in the hypocentral area was shorter than the 3 s used in the simulation.
The ground accelerations at DZC were also analog records. Furthermore, the large epicentral distance of
the station, 100 kin (Figure 3a), does not insure that the
instrument was triggered by the first P arrival. Never- theless these records also provide useful information on the rupture history of the earthquake. Because of the station location, about 20 kin beyond the eastern end of
the surface rupture, the N-S ground motion, more trans- verse to the fault, is expected to be dominant there and
to be the easiest one to interpret in terms of fault rup-
ture. This N-S ground velocity is displayed in Figure 2c. A comparison with the calculation done with a rupture
velocity of 4 km/s is also shown and allows the clear
identification of the S arrival. With the uncertainty on the triggering time, its timing is not precisely known.
The earliest possibility (23.4 s) is obtained when assum-
ing that the instrument triggered on the first arrival.
The latest one (27.6 s) is inferred by adding to the S ar-
rival time at SKR, the shear wave travel time between
SKR and DZC. The true S arrival time lies between
these two values. The time span between the north-
ern and southern velocity peaks carries information on the apparent duration of fault rupturing as seen from
DZC. The average rupture velocity of 4 km/s used in
the model clearly underestimates this duration.
Seismic imaging of the rupture
In order to infer in more details the space and time
3016 BOUCHON ET AL.: SEISMIC IMAGING OF THE IZMIT RUPTURE sion scheme to the data. We shall use here a scheme
based on simulated annealing to sample the space of possible model parameters and to determine, in this space, the set of parameters which best fit the ground velocities recorded at ARC, IZT, SKR, and DZC. The method of simulated annealing has been used quite suc- cessfully by previous authors to infer the source charac-
teristics of earthquakes [Hartzell and Liu, 1995; Cour- boulex et al., 1996; Ihml4, 1996] and we refer to these
studies for a description of the algorithm.
The fault geometry was shown in Figure 3a. The fault is discretized into 108 sub-elements of 5x5 km, each element being represented by 25 double-couple point sources. The slip, rise time, and rupture velocity of each element constitute the space of model parameters. At first, this space is uniformly sampled. Causality of the rupture is required, implying that the rupture front cannot reach a sub-element before having reached the one below it and the neighboring one closer to the epi- center. Slip in all the uppermost fault elements located on land is set at the value measured at the surface. Elsewhere slip is allowed to vary between 0 and 8 m. Rise time may vary between 0.25 s and 5 s. Average rupture velocities on the westward, central, and east- ern fault segments are allowed to vary between 2 and
6 km/s. Local rupture time occurs within a I s time
window centered on the average rupture velocity. Be-
cause the absolute time is not known at DZC, the S
wave arrival time there is allowed to vary uniformly in the range of possible values previously discussed. The best fit is determined by the minimization of the cost function:
4 N
S - E y•.[Cj(i)
- Oj(i)l
2
(1)
j=l i=1
where Cj (i) and Oj (i) are respectively
the calculated
and observed ground velocities at station j and time i. N is taken equal to 64 points representing 30 s of signal except at IZT where the first 12 s of signal only are considered. No filtering is applied to the data.
The results obtained are presented in Figure 3b. Suc- cessive positions of the rupture front, displayed at 1 s intervals, show the supershear propagation of rupture over about 45 km of the fault. Beyond this distance,
rupture decelerates to about. 3.1 km/s. The westward
propagation of rupture from the hypocenter takes place
at an average rupture velocity of 3 km/s. The largest
slip occurs between 25 and 45 km east of the epicenter where it reaches about 7 m. Slip is large also below
10 km on the eastern fault segment (about 5 m), and
this may have contibuted to the loading of shear stress on the Diizce fault. West of the epicenter, slip is large between distances of 10 and 30 km, which is the region around G51ciik, the hardest hit area during the earth- quake. There, large slip of about 4 to 5 m is confined
to shallow depths. The rise time which represents the duration of slipping locally on the fault is generally of the order of 2 to 4 s, except in the hypocentral area
where it is the shortest (about I s).
Acknowledgments. We are most thankful to the sci- entists, engineers, and technicians at Bo•aziqi University in Istanbul and at the General Directorate of Disaster Affairs
in Ankara who are in charge of the strong motion stations
whose recordings are the basis of the present study. We thank Mustafa Erdik, C•cile Cornou, Robert Guiguet, Ay-
bige Aidnci, Henri Haessler, Rolando Armijo, Cemil G'firbiiz,
Sadi Kueli, G'findiiz Horasan, Armando Cisternas, Bertrand Meyer, Jean-Bernard de Chabalier, Pierre-Yves Bard, and Jean-Robert Grasso for their help and discussions in the course of this work. We also thank Jid Zahradnik for his
comments. This study was partly financed by CNRS and
ANDRA through the GdR FORPRO.
References
Aid, K., Seismic displacement near a fault, J. Geophys. Res., 73, 5359-5376, 1968.
Archuleta, R.J., Analysis of near-source static and dynamic measurements from the 1979 Imperial Valley earthquake, Bull. Seisraol. Soc. Am., 712, 1927-1956, 1982.
Archuleta, R.J., A faulting model for the 1979 Imperial Val-
ley earthquake, J. Geophys. Res., 89, 4559-4585, 1984. Bouchon, M., A simple method to calculate Green's func-
tions in elastic layered media, Bull. Seisin. Soc. Am., 71, 959-971, 1981.
Bouchon, M., The rupture mechanism of the Coyote Lake
earthquake of 6 August 1979 inferred from near-field data,
Bull. Seisin. Soc. Am., 712, 745-757, 1982.
Courboulex, F., J. Videux, A. Deschamps, D. Gibert, and A.
Zollo, Source investigation of a small event using empirical Green's functions and simulated annealing, Geophys. J.
Int., 1œ5,, 768-780, 1996.
Ellsworth, W.L., and M. Celebi, Near field displacement
time histories of the M 7.4 Kocaeli (Izmit), Turkey, earth- quake of August 17, 1999, (abstract), Eos trans. AGU,
80, Fall Meeting supp., 648, 1999.
Hartzell, S., and P. Liu, Determination of earthquake source parameters using a hybrid global search algorithm, Bull. Seisin. Soc. Am., 85, 516-524, 1995.
Ihml•, P.F., Monte Carlo slip inversion in the frequency do-
main: Application to the 1992 Nicaragua slow earthquake,
Geophys. Res. Lett., 123,, 913-916, 1996.
ToksSz, M.N., R.E. Reilinger, C.G. Doll, A.A. BarIra, and
N. Yalcin, Izmit (Turkey) earthquake of 17 August 1999:
First Report, Seisin. Res. Lett., 70, 669-679, 1999.
M. Bouchon and M. Dietrich, Laboratoire de G4ophysique Interne et Tectonophysique, BP 53, 38041 Grenoble, France
(e-mail: Michel. Bouchon•ujf-grenoble.fr)
N. ToksSz and M. Edie, Earth Resources Laboratory,
MIT, 42 Carleton St., Cambridge MA 02142
H. Karabulut and M. Aktar, Kandilli Observatory, 81220
(•engelkSy, Istanbul
M.P. Bouin, IPGP, 4 Place Jussieu, 75252 Paris
(Received May 8, 2000; revised June 28, 2000;