HAL Id: hal-00318306
https://hal.archives-ouvertes.fr/hal-00318306
Submitted on 8 May 2007
HAL is a multi-disciplinary open access
archive for the deposit and dissemination of
sci-entific research documents, whether they are
pub-lished or not. The documents may come from
teaching and research institutions in France or
abroad, or from public or private research centers.
L’archive ouverte pluridisciplinaire HAL, est
destinée au dépôt et à la diffusion de documents
scientifiques de niveau recherche, publiés ou non,
émanant des établissements d’enseignement et de
recherche français ou étrangers, des laboratoires
publics ou privés.
Day-to-day correlation of equatorial electrojet at two
stations separated by 2000 km
R. G. Rastogi, H. Chandra, D. Chakrabarty, K. Kitamura, K. Yumoto
To cite this version:
R. G. Rastogi, H. Chandra, D. Chakrabarty, K. Kitamura, K. Yumoto. Day-to-day correlation of
equa-torial electrojet at two stations separated by 2000 km. Annales Geophysicae, European Geosciences
Union, 2007, 25 (4), pp.875-880. �hal-00318306�
© European Geosciences Union 2007
Geophysicae
Day-to-day correlation of equatorial electrojet at two stations
separated by 2000 km
R. G. Rastogi1, H. Chandra1, D. Chakrabarty1, K. Kitamura2, and K. Yumoto3
1Physical Research Laboratory, Ahmedabad 380009, India
2National Institute of Information and Communications Technology, Koganei, Tokyo, Japan 3Space Environment Research Center, Kyushu University, Fukuoka, Japan
Received: 20 July 2006 – Revised: 20 February 2007 – Accepted: 20 March 2007 – Published: 8 May 2007
Abstract. Day-to-day fluctuations of the daily range of the
geomagnetic field H at the equatorial electrojet stations An-con (ANC, 77.0◦W) and Sao Luis (SLZ, 44.2◦W) are de-scribed for the period January–June 1993. The H field started increasing between midnight and sunrise, reaching a peak shortly before noon. The daily range of H was maximum during March and April and minimum during June. Regard-less of the month, the range in H was significantly larger at ANC than at SLZ. The 27-day running mean of the range of H varied from 80 nT to 125 nT at SLZ and from 105 nT to 180 nT at ANC. The day-to-day values of the range of H showed very faithful variations at the two stations. The deviations of the daily range of H from its 27-day running mean values showed good correlation between the two tions. Some large storm-time effects were seen at both sta-tions. The correlation was still significant, when data were corrected for Dst index values. It is suggested that the range in H at the two electrojet stations, separated by more than 2000 km, are affected by some common sources other than the ring current, which need to be identified. Spectral analy-sis of the range of H shows remarkable similarity at the two stations, with a dominant period of 15 days at both stations.
Keywords. Ionosphere (Electric fields and currents;
Equa-torial ionosphere; Ionosphere-atmosphere interactions)
1 Introduction
The daily variations of the Earth’s magnetic field at the ground stations were suggested by Stewart (1882) as due to the movement of the conducting upper atmosphere across the vertical component of the Earth’s magnetic field aris-ing due to the solar heataris-ing of the atmosphere. Chapman (1919) suggested that the regular tidal movement of the
at-Correspondence to: H. Chandra
mosphere across the Earth’s magnetic field generates a regu-lar pattern of electric field in the upper atmosphere, which causes currents that produce regular magnetic field varia-tions at the ground. The discovery of the enhancement in the daily variation of the horizontal field, H, within a narrow belt of latitudes over the equator (Egedal, 1947), was explained by Chapman (1951) as due to an eastward current in the E-region of the ionosphere with a latitude belt of ±3◦centered over the dip equator. This phenomenon, known as equatorial electrojet (EEJ), could not be explained by assuming an en-hancement of either the electric field or the electron density over the dip equator. Cowling and Borger (1948) suggested that under the situation of orthogonal magnetic and electric fields over the dip equator, a vertical Hall polarization field would be generated, which would result in an abnormal in-crease in the electric conductivity over the magnetic equa-tor. Thus, the same Sq electric field at low latitudes outside the electrojet belt can cause a larger current over the mag-netic equator due to increased electric conductivity (Baker and Martyn, 1953).
The equatorial electrojet depends both on the maximum electron density of the E-region, NmE, as well as the electric field E. Rastogi (1993) showed that the solar cycle variation of the daily range of H, RH at Huancayo and Kodaikanal de-pend mostly on the corresponding variation of NmE, with lit-tle effect from any variation of the electric field. The seasonal variation of RH after correction due to the variation of NmE depends on the corresponding variations in the electric field. The daily variation of RH depends on the product of NmE and E. The equatorial electrojet is affected by a temporary increase in the ionization during solar flares, increasing 1H during normal and decreasing it during counter-electrojet pe-riods (Rastogi, 1999, and references therein). Slowly vary-ing, as well as rapidly changing parameters of solar wind cause an imposition of the electric field on the equatorial ionosphere, thus triggering changes in the equatorial elec-trojet (Rastogi, 2006).
876 R. G. Rastogi et al.: Correlation of equatorial electrojet at two stations separated by 2000 km
Fig. 1a. Monthly mean variations of the daily range in H for five
international quiet days at ANC and SLZ for the months January to June 1993.
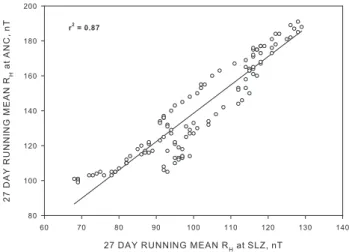
Fig. 1b. Mass plot of the 27-day running mean values of the daily
range in H at ANC plotted against values at SLZ.
Soon after the discovery of EEJ, measurements of H at the equatorial stations were made in India (Pramanik and Yagna Narayan, 1952) and in Nigeria (Onwumechilli, 1959). Estab-lishment of additional electrojet stations during IGY enabled Rastogi (1962) to identify a significant longitudinal variation in the strength of the electrojet with a maximum at 75◦W and a minimum along 75◦E longitudes. Kane (1982) de-scribed the comparison of mean daily variations of H, D and Z at Huancayo (12◦S, 75◦W, dip 1.9◦)and Eusebio (4◦S, 39◦W, dip −3.5◦). Recently, Doumouya et al. (2003) have described the local time and longitude dependence of EEJ at a number of stations operating during IEEY. No major efforts seem to have been made on the day-to-day variations of the range in H (RH)at two electrojet stations. In this paper we compare the day-to-day variations of RH and the range in H (pointing to magnetic north) at Ancon in Peru and Sao Luis in Brazil, during the period January to June 1993. The ge-ographic coordinates and the geomagnetic parameters of the two stations for March 1993 are listed in Table 1. The two stations are separated by 33◦in longitude. The inclination is 1.21◦N at Ancon and 0.25◦S at Sao Luis.
Table 1. Geographic and Geomagnetic parameters of stations: March 1993.
Station code ANC SLZ Geog. Lat. Deg. −12.08 −2.60
Geog. Long. Deg. −77.02 −44.20 Geom. Lat. Deg. 1.55 0.47 Geom. Long. Deg. 354.55 29.63 Declination Deg. 1.75 −20.34 Inclination Deg. 1.21 −0.25 X nT 26 680 25 114 Y nT 815 −9368 Z nT 563 −118 H nT 26 692 26 783 F nT 26 697 26 783 2 Results
The data were first cleaned up for gaps and sudden changes in the base level. Only complete day series were taken for further analysis. Daily variations of the H component were averaged over the five quietest days of each of the months in this period for both the stations. The Sq-H variations are taken as the daily variations of the deviations of H with re-spect to 0.5h local time value. The quiet day mean Sq-H vari-ations at ANC and SLZ for each month are shown in Fig. 1a. During any of the months, the daily range in H was larger at ANC than at SLZ. Further, as expected of an equatorial sta-tion, the daily range in H at any of the stations was largest in the equinoctial months of March and lowest during the local winter month of June.
To obtain a better estimate of the relation between the daily ranges in H at the two stations, 27-day running averages were computed and the mass plot of the running mean values of the daily range in H at the two stations are shown in Fig. 1b. The daily range in H varied from 80 to 125 nT at SLZ and from 105 to 180 nT at ANC. Thus, the changes were 45 nT at SLZ and 75 nT at ANC. The regression line for the linear fit and the correlation coefficient are also indicated in the figure (also provided in Table 2). A linear relation between the val-ues of the daily range in H at the two stations is clearly seen. The slope is 1.83 and the intercept on the y-axis is −46 nT. The correlation coefficient is 0.87 (r2=0.76). A high corre-lation between the 27-day running mean values at the two stations is expected as the fluctuations like day-to-day varia-tions will be removed in the running mean.
Figure 2a shows day-to-day variations of the daily range in H at ANC and SLZ for the period January–June 1993. The day number of the year is also marked in the figure. The fluc-tuations in the daily range of H are similar at the two stations. For Ancon the daily range in H varies mostly from 100 nT to more than 200 nT during March–April and from 50 nT to 150 nT during the other months. For Sao Luis most of the
Table 2. Regression and correlation coefficients of fluctuations in RHat SLZ and ANC.
Parameter Intercept nT Slope Correlation coefficient −r 27-day running mean of RHat SLZ and ANC −45 1.83 0.87
RHat SLZ and at ANC 60 0.77 0.65
Deviations from running mean of RHat SLZ and at ANC 4 0.63 0.67
Deviations from running mean of RHat SLZ and ANC after removing Dst 10 0.48 0.5
After removing a few points with large negative values on disturbed days
Parameter Intercept nT Slope Correlation coefficient −r 27-day running mean of RHat SLZ and ANC −24 1.6 0.93
RHat SLZ and at ANC 48 0.88 0.63 Deviations from running mean of RHat SLZ and at ANC −1 0.58 0.45
Fig. 2a. Day-to-day variations of the daily ranges of H at ANC and
SLZ for the period January to June 1993.
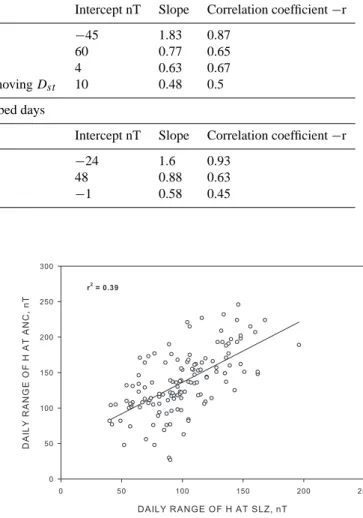
values range from 50 nT to 150 nT. There are few negative or close to zero values, which are on geomagnetic disturbed periods. The mass plot of the daily range of H at ANC versus the daily range of H at SLZ is shown in Fig. 2b. The regres-sion line for the linear fit and the correlation coefficient are also indicated in the figure. Significant correlation (.65) is seen in day-to-day variations of the daily range in H at the two stations that are separated by a distance over 2000 km. The slope is 0.77 and the intercept 60 nT. It is to be noted that the correlation improves if the few points with very low values at one station and values high at the other station are removed. Rastogi (2005) compared the day-to-day fluctua-tions in the daily range of H at Tirunelveli in India and Bac-Lieu in Vietnam, two stations close to the dip equator but separated by 28◦in longitudes, and found similar variations. The 27-day running mean values were subtracted from the individual values and deviations obtained. This will remove the seasonal variation. The day-to- day variations of the de-viations in the range in H at the two stations are shown in Fig. 3a. The values at the two stations are also shown in Fig. 3b as a mass plot along with the regression line for best linear fit and the correlation. Smaller values of the range in
Fig. 2b. Mass plot of the daily range of H at ANC plotted against
the values at SLZ.
H are negative here after subtracting the running mean. Sig-nificant correlation (0.67) is seen between the daily ranges in H at the two stations after subtracting the 27-day running mean. A few points with large deviations in the range H seem to be due to disturbed days. To remove the disturbance ring current effect, the Dstindices were subtracted corresponding to the two stations. Mass plots of the daily ranges in H after subtracting the 27-day running mean and Dst index values at the two stations are shown in Fig. 4. Good correlation (0.5) between the values of the daily range in H at the two stations after subtracting the 27-day running mean and disturbance index is still seen.
Thus, the daily ranges in H at the two equatorial stations separated by more than 2000 km show good correlation af-ter subtracting the mean (27-day running mean) ionospheric current (Sq) and the ring current (Dst). This suggests that there is a source of electric field over the equatorial iono-sphere that is of a global scale rather than local extent. The day-to-day fluctuations in the daily range of H could be
878 R. G. Rastogi et al.: Correlation of equatorial electrojet at two stations separated by 2000 km
Fig. 3a. Day-to-day variations of the daily ranges of H at ANC and
SLZ after removing the 27-day running mean plotted for the period January to June 1993.
due to the day-to-day changes in the electric field caused by changes in the neutral winds. Planetary waves of peri-ods 2 d, 5 d, 10 d and 15 d have been identified in neutral winds in the upper mesosphere. Kovalam et al. (1999) re-ported peaks at 6.5 d, 3.5 d and 2.5 d from the power spectral studies of winds (86–92 km) from the MF-spaced receiver measurements at Pontianak (0◦N, 109◦E) and Christmas Is-land (2◦N, 157◦W). Cross-spectral studies of the winds at the two locations also provided the direction of propagation of planetary waves from the phase differences. Harmonic analysis using band-pass filtering of hourly data showed am-plitudes of 3.5 d and 6.5 d waves up to 30 m/s. Similar stud-ies from Tirunelveli (8.7◦N, 77.8◦E) showed 5.3d, 3.5d and quasi 2-D waves (Gurubaran et al., 2001; Sridharan et al., 2002). Periodicities ranging from 2 days to about 20 days have been reported in equatorial electrojet (Ramkumar et al., 2006, and references therein). Signatures of planetary waves have been observed in several ionospheric parame-ters. Forbes and Leveroni (1992) observed a quasi-16-day oscillation in equatorial E and F region parameters. The ef-fects were interpreted in terms of electric fields induced by an ionospheric wind dynamo, and were attributed due to the up-ward penetration of a free Rossby mode excited in the strato-sphere. Parish et al. (1994) reported oscillations with a pe-riodicity in the range of 2–35 days from hourly 1H values. They argued that spectral peaks near 16 days might be due to the combined action of direct high-energy solar radiations and planetary waves propagating up from the lower atmo-sphere.
The time series of the daily ranges of H at the two sta-tions after subtracting the 27-d running means were subjected to spectral analysis to obtain frequency components. Since there were a few gaps in the time series the method of Schulz and Stattegger (1997) was employed, which can handle un-evenly sampled data. Normalized periodograms are obtained from the harmonic analysis and the spectral power contained in each spectral element is normalized with respect to the to-tal power contained in all spectral elements. Figure 5 shows the normalized periodograms for the two stations. Power (in fraction) is plotted against the period. Dotted lines show the 95% confidence level. A dominant period of 15 d is seen at both the stations. Smaller peaks at 3–4 d, 5.5 d and 7–9 d are also seen.
Fig. 3b. Mass plot of the daily range of H at ANC after removing
the 27-day running mean plotted against the values at SLZ.
Fig. 4. Mass plot of the daily range of H at ANC after removing
both the 27-day running mean and Dstplotted against similar values
at SLZ.
3 Summary and conclusion
Day-to-day fluctuations of the daily range of the northward geomagnetic field H at the equatorial electrojet stations An-con and Sao Luis for the period January–June 1993 show the range in H significantly larger at ANC than at SLZ during any of the months. The daily range of H was maximum dur-ing March and April and minimum durdur-ing June. The day-to-day values of the range of H showed similar variations (correlation of 0.65) at the two stations. The deviations of the daily range of H from its 27-day running mean values also showed good correlation (0.67) between the two sta-tions. The correlation was still significant (0.5), when data were corrected for Dst index values. It is suggested that the range in H at the two electrojet stations separated by more than 2000 km are affected by some common sources other
Fig. 5. Normalized periodograms for the de-trended (27-d) time
series of the range of H at Ancon and Sao Luis (dashed line shows the 95% confidence limit).
than the ring current, which need to be identified. The day-to-day variations of the equatorial electrojet could also be due to extraterrestrial sources, like solar ionization radiation, solar wind velocity (Bhargava and Yacob, 1971) or due to in-terplanetary magnetic field strength and orientation (Rastogi and Chandra, 1974).
Spectral analysis of the range of H shows remarkable sim-ilarity at the two stations, with a dominant period of 15 days at both the stations. Smaller peaks at 3–4 d, 5.5 d and 7–9 d are also seen though below the confidence limit.
It is concluded that similar day-to-day variation of equa-torial electrojet current at stations with varying separation be studied and the sources of such variations be sought in plan-etary waves, solar radiation and solar wind parameters.
Acknowledgements. Two of the authors (RGR and HC) would like
to thank Director, Physical Research Laboratory for the facilities provided.
Topical Editor M. Pinnock thanks K. N. Iyer and R. M. Thomas for their help in evaluating this paper.
References
Baker, W. G. and Martyn, D. F.: Electric currents in the ionosphere. The conductivity, Phil. Trans. R. Soc. Lond., A 246, 281–294, 1953.
Bhargava, B. N and Yacob, A.: Depression in the low-latitude hor-izontal intensity due to quiet-time ring current, PAGEOPH, 92, 165–169, 1971.
Chapman, S.: The solar and lunar diurnal variations of the earth’s magnetism, Phil. Tras. Roy. Soc. Lond., A218, 1–118, 1919. Chapman, S.: The equatorial electrojet as detected from the
ab-normal electric current distribution above Huancayo, Peru and elsewhere, Arch. Meterol. Geophys. Bioklimatol, A 4, 368–390, 1951.
Cowling, T. G. and Borger, R.: Electrical conductivity of the iono-spheric D region, Nature, 162, 143–143, 1948.
Doumouya, V., Cohen, Y., Arora, B. R., and Yumuto, K.: Local time and longitude dependence of the equatorial electrojet magnetic effects, J. Atmos. Terr. Phys., 65, 1265–1282, 2003.
Egedal, J.: The magnetic diurnal variation of the horizontal force near the magnetic equator, Terr. Magn. Atmos. Electr., 52, 449– 451, 1947.
Gurubaran, S., Sridharan, S., Ramkumar, T. K., and Rajaram, R.: The mesospheric quasi-2-day wave over Tirunelveli (8.7◦N), J. Atmos. Solar Terr. Phys., 63, 975–985, 2001.
Forbes, J. M. and Leveroni, S.: Quasi-16d oscillation in the iono-sphere, Geophys. Res. Lett., 19, 981–984, 1992.
Kane, R. P. and Trivedi, N. B.: Comparison of equatorial electrojet characteristics at Huancayo and Euselio (Fortelaza) in the south American region, J. Atmos. Terr. Phys., 44, 785–792, 1982. Kovalam, S., Vincent, R. A., Reid, I. M., Tsuda, T., Nakamura,
T., Ohnishi, K., and Wiryosumarto, H.: Longitudinal variations in planetary wave activity in the equatorial mesosphere, Earth Planet Space, 51, 665–674, 1999.
Onwumechili, C. A.: A study of the equatorial electrojet – 1 An experimental study, J. Atmos. Terr. Phys., 13, 222–234, 1959. Parish, H. F., Forbes, J. M., and Kamalabadi, F.: Planetary wave and
solar emission signatures in the equatorial electrojet, J. Geophys. Res., 99, 355–368, 1994.
Pranamik, S. K. and Yegna Narayanan: Diurnal magnetic varia-tion in equatorial regions, Ind. J Meteorol. Geophys., 3, 212–216, 1952.
Ramkumar, T. K., Bhawanikumar, Y., Narayan Rao, Gurubaran, S., Narendra Babu, A., Ghosh, A. K., and Rajaram, R.: Observa-tional evidences on the influences of tropical lower atmospheric
∼20 day oscillation on the ionospheric equatorial electrojet, J.
Atmos. Solar Terr. Phys., 68, 523–538, 2006.
Rastogi, R. G.: Longitudinal variation in the equatorial electrojet, J. Atmos. Terr. Phys., 24, 1031–1040, 1962.
Rastogi, R. G.: Geomagnetic field variations at low latitudes and ionospheric electric field, J. Atmos. Terr. Phys., 55, 1375–1381, 1993.
Rastogi, R. G.: Equatorial electrojet at a aloes pair of stations, Curr. Sci., 91, 272–273, 2005.
Rastogi, R. G. and Chandra, H.: Interplanetary magnetic field and the equatorial ionosphere, J. Atmos. Terr. Phys., 36, 377–379, 1974.
Rastogi, R. G., Pathan, B. M., Rao, D. R. K., Sastry, T. S., and Sas-tri, J. H.: Solar flare effects on the geomagnetic elements during normal and counter electrojet periods, Earth Planet Space, 51,
880 R. G. Rastogi et al.: Correlation of equatorial electrojet at two stations separated by 2000 km
947–957, 1999.
Rastogi, R. G.: Magnetic storm effects at equatorial electrojet sta-tions, EPS, 58, 1–13, 2006.
Schulz, M. and Stattegger, K.: Spectrum: Spectral analysis of un-evenly spaced paleoclimatic time series, Comput. Geosci., 23, 929–945, 1997.
Sridharan, S., Gurubaran, S., and Rajaram, R.: Radar observa-tions of the 3.5-day ultra-fast Kelvin wave in the low-latitude mesopause region, J. Atmos. Solar Terr. Phys., 64, 1241–1250, 2002.
Stewart, B.: Terrestrial Magnetism, in Encyclopedia Brittanica, 9th edition, 1882.