HAL Id: hal-00318846
https://hal.archives-ouvertes.fr/hal-00318846
Submitted on 14 Oct 2005
HAL is a multi-disciplinary open access
archive for the deposit and dissemination of
sci-entific research documents, whether they are
pub-lished or not. The documents may come from
teaching and research institutions in France or
abroad, or from public or private research centers.
L’archive ouverte pluridisciplinaire HAL, est
destinée au dépôt et à la diffusion de documents
scientifiques de niveau recherche, publiés ou non,
émanant des établissements d’enseignement et de
recherche français ou étrangers, des laboratoires
publics ou privés.
Manifestation of solar activity in the global topside ion
composition ? a study based on satellite data
V. Truhlik, L. Trisková, J. Smilauer
To cite this version:
V. Truhlik, L. Trisková, J. Smilauer. Manifestation of solar activity in the global topside ion
compo-sition ? a study based on satellite data. Annales Geophysicae, European Geosciences Union, 2005, 23
(7), pp.2511-2517. �hal-00318846�
SRef-ID: 1432-0576/ag/2005-23-2511 © European Geosciences Union 2005
Annales
Geophysicae
Manifestation of solar activity in the global topside ion composition
– a study based on satellite data
V. Truhl´ık, L. Tˇr´ıskov´a, and J. ˇSmilauer
Institute of Atmospheric Physics, Acad. Sci. Czech Rep., Boˇcn´ı II., 14131 Praha 4−Sporilov, Czech Republic Received: 6 February 2005 – Revised: 8 July 2005 – Accepted: 22 July 2005 – Published: 14 October 2005
Abstract. The solar cycle variation of the most important
parameters characterizing the ion composition in the top-side ionosphere is studied. For this purpose data from the ACTIVE mission (the IK-24 satellite) for the maximum of solar cycle 22 (aver F10.7∼200), complemented by data available from the Atmosphere Explorer (AE) satellites, for the minimum of solar cycle 21 (average F10.7∼85), were processed. OGO-6 data from the low maximum of solar cy-cle 20 (average F10.7∼150) were used for medium solar ac-tivity conditions. The results for the equinox from the re-cently developed empirical model of ion composition are an-alyzed and presented, and typical vertical profiles from so-lar maxima and minima are shown. It was found that the logarithm of the O+, H+, He+, and N+densities in the top-side ionosphere at a fixed altitude, latitude, and local time is, in the first approximation, a linear function of solar activity characterized by the daily F10.7. On the other hand, the up-per transition height is generally a non linear function of the daily F10.7, the deviation from linear dependence increases with latitude.
Keywords. Ionosphere (Plasma temperature and density;
Ion chemistry and composition; Modeling and forecasting)
1 Introduction
Different ion species in the topside ionosphere are produced by photo ionization and chemical reactions in this region or result from transport processes. The most important ions are O+, H+, He+, and N+. Their fractions strongly depend on various geophysical parameters, such as latitude, altitude, lo-cal time, season and solar and geomagnetic activity. Some minor ions as O++ and N++ in the upper part and NO+, O+2 and N+2 in the lower part of the topside ionosphere are also present. An example of the ion composition of the outer ionosphere as measured on board the satellite during the ACTIVE mission is shown in Fig. 1.
Correspondence to: V. Truhl´ık
Many experimental and theoretical studies during the last three decades have revealed the most important features of the ion composition in the topside ionosphere. John-son (1966) showed a vertical profile of ion composition up to the altitude of 1200 km for day and solar minimum based on rocket and satellite data. Taylor et al. (1970) studied latitudi-nal variations in the distribution of the primary ions obtained from OGO-2 and OGO-4 satellites in the upper ionosphere during the period of rising solar activity (1965–1968). They have found the existence of the high-latitude light ion trough, a deep trough in He+near the dipole equator, and the He+
winter bulge. Using ion mass spectrometer data from the OGO-6 satellite, the distribution of prominent and trace ions and the occurrence of the light ion troughs was pointed out by Taylor (1973). The geomagnetic vs. local time distribu-tion characteristics of the ionic constituents (O+, H+, and He+) from the ISS-b satellite was investigated in Matuura et al. (1981). K¨ohlein (1989) proposed an empirical model of atomic ion densities up to 4000 km altitude for quiet geo-physical conditions during low and medium solar activity. Hoegy et al. (1991) compared their database (based on satel-lite measurements made during 70’s and 80’s) with results from several empirical and theoretical models for lower mid-latitudes, daytime and low and medium solar activity. They have noted that H+and He+decrease with increasing solar
activity, whereas N+, O+increase. Heelis et al. (1990), for
the first time, reported a possible dominance of He+at
mid-latitudes for solar maximum. Gonzalez et al. (1992) have dealt with seasonal variation of concentrations of light ions in the equatorial ionosphere during solar minimum. They have found a discrepancy in densities from the ion mass spectrom-eter and the retarding potential analyzer on board the Atmo-sphere Explorer E satellite. Craven et al. (1995) have com-pared a theoretically modeled (the FLIP model) and mea-sured ion densities (the Atmosphere Explorer data) in the mid-latitude ionosphere up to 1400 km for low solar activity conditions. West et al. (1997) have dealt with the solar activ-ity variations in the composition of the low-latitude topside ionosphere based on DMSP F10 data. The effects of neutral winds and of the EUV solar flux in the behavior of the upper
2512 V. Truhl´ık et al.: Manifestation of solar activity in the global topside ion composition
Fig. 1. Example of ion composition between 500 and 2500 km as
measured by the ion mass spectrometer on board the IK-24 satel-lite (ACTIVE mission) including minor ions. ALT-altitude, CHI-solar zenith angle, MLT-magnetic local time, L-McIlwain parame-ter, INL-invariant latitude, UT-Universal Time, mol-molecular ions (N2, NO+), 15 April 1990.
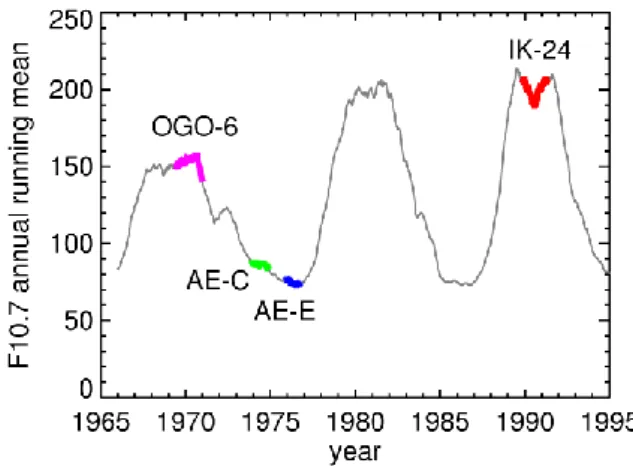
Fig. 2. Periods of data used from OGO-6, AE-C, AE-E, and IK-24
satellites with corresponding solar activity.
transition level at low mid-latitudes under low and moderate solar activity is the subject of the paper by MacPherson et al. (1998), based on the Incoherent Scatter data from Arecibo and the SUPIM model. A statistical analysis of the depen-dence of the topside ion density on the solar flux from ISS-b at 1100 km during solar maximum is given by Iwamoto et al. (2000). They have confirmed that the H+density has a negative correlation with the solar flux F10.7 while O+has a positive correlation. Gonzalez et al. (2004) have analyzed the general solar cycle variability of the nighttime He+layer near the autumnal equinox over Arecibo.
In spite of this, variation of the ion composition with solar activity is not fully understood, especially as regards to its quantitative description and global distribution for the solar maximum. Long series of data records, covering various so-lar activity levels at different latitude, altitude and local time ranges, needed to describe the ion composition response to the EUV flux, are rare so far.
A new global empirical model of the relative ion compo-sition in the outer ionosphere is used in this study, further on referred to as the TTS (Truhl´ık, Tˇr´ıskov´a, ˇSmilauer) model. It was introduced in Tˇr´ıskov´a et al. (2003) and validated in Truhl´ık et al. (2003); Truhl´ık et al. (2004). To obtain abso-lute ion densities the TTS model has been complemented by a recently developed model of the electron density, also for the region of the topside ionosphere (Tˇr´ıskov´a et al., 2005)1 Special attention is paid to the manifestation of solar activity in the densities of ion species at a fixed point. Vertical pro-files of ion densities and the upper transition level are also presented.
2 Data description
Our database of thermal plasma parameters contains the re-sults of many available satellite ion mass spectrometer (IMS) measurements covering the period from the end of the 1960’s to the beginning of the nineties. But for this study only data from three typical solar activity periods were chosen (Fig. 2, and Table 1).
In recent years, it has been demonstrated by using different instruments on board a number of satellites (e.g. Atmosphere Explorer and OGO series) that the relative ion composition for low and medium solar activity was measured essentially correctly (e.g. Grebowsky et al., 1970; Hoffman et al., 1969), in spite of some differences in absolute ion densities, which occurred especially on AE-E (e.g. Gonzalez et al., 1992). For high solar activity, however, only ion densities in the altitude range from ∼500 km up to ∼3000 km measured on board the IK-24 satellite by a Bennett ion mass spectrometer (BIMS) were available. Unfortunately, a huge data-base from RPA measurements on board the DMSP satellites covers fixed al-titude and fixed local time only, and RPA measurements do not provide information as detailed as ion mass spectrome-ters (e.g. this technique is not capable of detecting N+ and distinguishing reliably between H+and He+in the topside). The IK-24 ion mass spectrometer data, on the other hand, could only be validated recently by comparing it with newly processed results of measurements made on board the same spacecraft, using the Retarding Potential Analyser (RPA) method (Truhl´ık et al., 2004). A good agreement of the IMS with the RPA probe data was found, which speaks in favour of both measurements being correct, because the procedures for determining the ion densities are independent: correc-tion of the discriminacorrec-tion of ions by atomic weight for the spectrometer, and calculation of the ion densities from the volt-ampere characteristics for the RPA method.
1Tˇr´ıskov´a, L., Truhl´ık, V., and ˇSmilauer J.: An empirical
top-side electron density model for calculation of absolute ion densities in IRI, Adv. Space Res., accepted, 2005.
Table 1. Characteristics of the data used.
Satellite Average F10.7 Time period Altitude (km) Latitude (deg) LT (h) OGO-6 150 June 1969–December 1971 400–1100 ±83 0–24 AE-C 85 December 1973–November 1974 130–4300 ±68 0–24 AE-E 75 December 1975–October 1976 130–2400 ±20 0–24 IK-24 200 October 1989–November 1991 500–2500 ±83 0–24
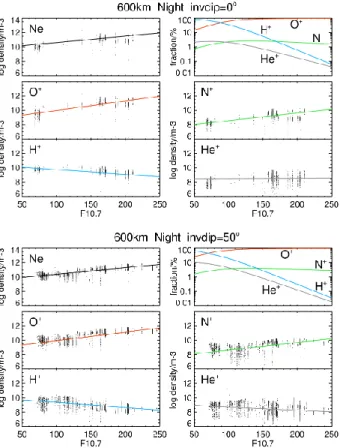
Fig. 3. Dependence of the logarithm of the individual ion densities,
of the electron (=total ion) density, and of the relative ion densi-ties on the solar activity level characterized by the actual day val-ues of the F10.7 index. Example for equinox, equator±15◦, mid-latitudes 50◦±15◦, altitude of 600±80 km, and daytime 13±3 h MLT. Points-measured values, lines-values calculated from the models (TTS relative ion density and electron density models).
3 Ion density dependence on solar activity
In Figs. 3 through 6, densities of the main ions vs. solar ac-tivity are plotted, and raw data from all satellites listed in Table 1 without any modification are presented. The val-ues calculated from the TTS model are plotted, together with the data evaluated from the satellite mass spectrometer mea-surements. It is evident that, in the first approximation, the dependence of the logarithm of ion densities on the solar ac-tivity index F10.7 is linear.
Fig. 4. Dependence of the logarithm of the individual ion densities,
of the electron (=total ion) density, and of the relative ion densi-ties on the solar activity level characterized by the actual day val-ues of the F10.7 index. Example for equinox, equator±15◦, mid-latitudes 50◦±15◦, altitude of 600±80 km, and nighttime 0±3 h MLT. Points-measured values, lines-values calculated from the models (TTS relative ion density and electron density models).
Examples for equinoxial day and night, and altitudes of 600 and 850 km, together with interpolated densities calcu-lated from the TTS model, are shown. The TTS model is a relative one. Absolute density values are obtained by com-bining this model with the recently created model of the top-side electron density in the altitude range of 400 to 2500 km, which can be considered with sufficient accuracy to be equal to the total density of ions (Tˇr´ıskov´a et al., 2005). Magnetic local time (MLT) and latitude were chosen as the main co-ordinates. The longitudinal variation can be reduced to a
2514 V. Truhl´ık et al.: Manifestation of solar activity in the global topside ion composition
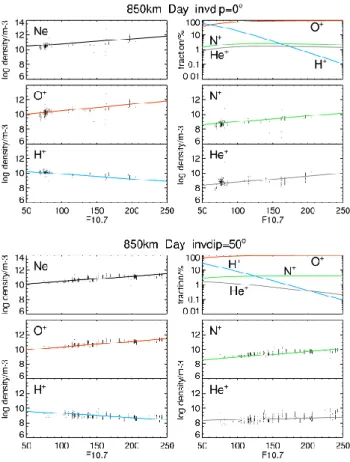
Fig. 5. Dependence of the logarithm of the individual ion densities,
of the electron (=total ion) density, and of the relative ion densi-ties on the solar activity level characterized by the actual day val-ues of the F10.7 index. Example for equinox, equator±15◦, mid-latitudes 50◦±15◦, altitude of 850±90 km, and daytime 13±3 h MLT. Points-measured values, lines-values calculated from the models (TTS relative ion density and electron density models).
second-order effect, if the latitudinal coordinate takes into ac-count the real configuration of the geomagnetic field. There-fore, a new coordinate (invdip) was introduced by Truhl´ık et al. (2001). Invdip is close to the dip latitude (diplat) near the equator and becomes closer to the invariant latitude (invl) at higher latitudes. The agreement of the calculated and mea-sured dependence is satisfactory and can be considered as another validation of the TTS model.
In the left upper part of the figures the measured and mod-eled electron (total ion) density are shown, and the relative ion density dependence on the F10.7 index is presented in the right upper panel. The relative densities of the individual components have a considerably nonlinear dependence on solar activity, especially near the upper transition height (see also Fig. 9). From plots of relative ion densities trends in all ion species can be easily seen. The density of the O+ions at both altitudes studied increases with solar activity both dur-ing the day and at night, with the greatest increase occurrdur-ing for 50◦ invdip at 850 km at night. The N+ ions follow the changes of the O+density. The H+ density decreases with increasing F10.7, with the greatest change occurring at an
Fig. 6. Dependence of the logarithm of the individual ion densities,
of the electron (=total ion) density, and of the relative ion densi-ties on the solar activity level characterized by the actual day val-ues of the F10.7 index. Example for equinox, equator±15◦, mid-latitudes 50◦±15◦, altitude of 850±90 km, and nighttime 0±3 h MLT. Points-measured values, lines-values calculated from the models (TTS relative ion density and electron density models).
altitude of 600 km above the equator in the daytime and al-most no change at the altitude of 850 km above the equator at night. The He+density showed no change in most cases, only at 600 km at night did a little decrease occur, but at the altitude of 850 km over the equator the He+density shows a sharp increase with solar activity during daytime hours. It is also apparent that during the daytime and during the high so-lar activity, the He+density is larger than H+. It can even re-sult in the dominance of He+ions. Such cases have been de-scribed before (Heelis et al., 1990; Shultchishin et al., 1996; Gonzalez et al., 2004) for low mid-latitudes and in (Heelis et al. (1981) and Erschova et al. (1998) for high latitudes. In the following paragraph we will address the solar activity de-pendence of the vertical profiles of the relative and absolute ion composition.
4 Vertical profiles
Figures 7 and 8 present examples of vertical profiles of rel-ative and absolute ion densities, respectively, as calculated
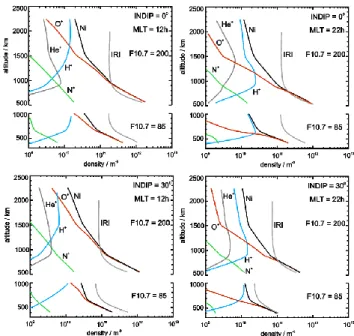
Fig. 7. Examples of equinoxial vertical profiles of the relative ion
densities calculated from the TTS model for high (F10.7=200) and low solar activity (F10.7=85) and for two local times (12 h and 22 h) and two latitudes (0◦and 30◦).
from the TTS model. This model consists of submodels for three altitude levels for low solar activity and for four altitude levels for high solar activity and uses an interpola-tion scheme for intermediate altitudes, days of the year, and solar activities. Different model altitude levels for the solar maximum and minimum were chosen with respect to differ-ent thermal plasma distributions (characterized by the scale height, upper transition height, etc.) depending on solar ac-tivity. The electron density from the IRI 2001 model is also shown for comparison. As shown elsewhere (e.g. Bilitza, 2004; Tˇr´ıskov´a et al., 2002), the IRI model overestimates the electron density substantially in the upper topside.
To calculate the relative ion density for a given day of the year and a given solar activity level, linear interpolation be-tween the submodels is used. The Booker (1977) formalism is employed to establish the vertical profiles. This approach assumes that the altitudinal profile of the electron/ion den-sity can be divided into several subsections such that in ev-ery subsection, the altitude gradient is nearly constant, which is called the skeleton profile. The derivative of the skeleton function can be represented by a sum of the Epstein functions (Bilitza, 1990). Through integration, we obtain the resulting density in terms of the “Booker function”. The vertical pro-files of the densities based on Booker’s formalism are satis-factory in the first approximation. Sometimes, however, they may display non-physical behavior, for example, discontinu-ity in the first derivative (visible smoothed edges) at the al-titudes of the individual sub-models. Therefore, one should look for other functions.
Examples of profiles for the equinoxes, daytime and night-time at the equator and at lower middle latitudes, at the night-time
Fig. 8. Equinoxial daytime and nighttime vertical profiles of
abso-lute densities for the four main ions as derived from the proposed
Nemodel and from the relative ion composition TTS model. The
total ion density Nifollowing from our model and the IRI (Bilitza,
1990) values are shown.
Fig. 9. Dependence of the logarithm of the individual ion densities,
of the electron (=total ion) density, and of the relative ion densities on the solar activity level characterized by the actual day values of the F10.7 indes. Example for equinox, mid-latitudes 27◦±15◦, al-titude of 1300±90 km, and nighttime 3±1 h MLT. Points-measured values, lines-values calculated from the models (TTS relative ion density and electron density models).
of high and low solar activity, are shown. During low solar activity He+ remains a minor ion with values significantly below H+. During high solar activity He+ becomes a ma-jor ion and can become the dominating ion (Heelis al., 1990; Shultchishin et al., 1996; Gonzalez et al., 2004). At mid-dle latitudes, below 1000 km, there are systematically more helium than hydrogen ions in the daytime during the solar maximum. This fact has not yet been taken into account in
2516 V. Truhl´ık et al.: Manifestation of solar activity in the global topside ion composition
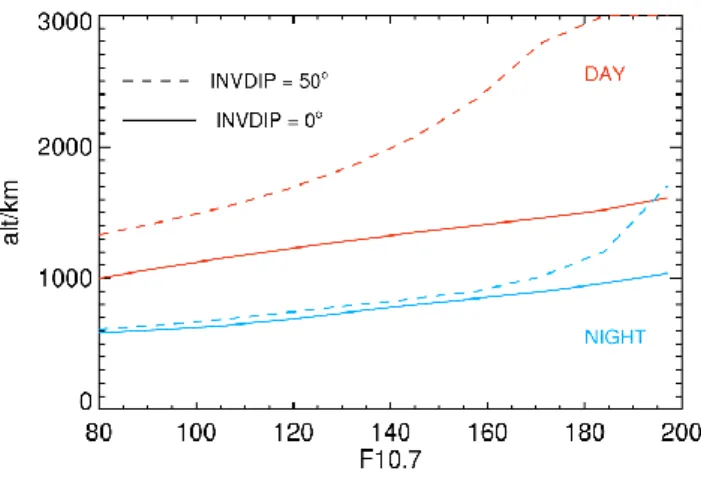
Fig. 10. Solar activity dependence of the upper transition height
where n(O+)+n(N+)=n(H+)+n(He+) for equator and mid-latitudes as follows from the TTS model.
existing empirical models (e.g. the IRI model assumes a con-stant ratio: H+/He+=9). Whereas the relative densities of O+, H+and He+display variations of several orders of mag-nitude in the altitude range in question, the relative density of N+varies within a few percent, regardless of the time of day, or of the level of solar activity.
4.1 Upper transition height
The upper transition height HT is defined in this study as the
level where the sum of densities of O+ and N+equals the sum of densities of light ions (H+and He+). Of course, the contribution of N+is very small. For high solar activity the upper transition level at a given point, at a given local time, lies much higher than for low solar activity (e.g. MacPherson et al., 1998; Tˇr´ıskova et al., 1998; Tˇr´ıskov´a et al., 2003). An example of the dependence of HT on solar activity is shown
in Fig. 10, where the variation of HT at the equator and at the
latitude of 50◦invdip for F10.7=80 through 200 is shown for daytime and nighttime.
In Figs. 3 through 6 (lower panels) the transition of O+ to H+prevalence is clearly seen for night hours, during the day the upper transition height is situated higher than 600 or 850 km. At the equator the transition occurs for higher F10.7 than at middle latitudes.
The importance of the He+ions increases with solar
activ-ity and the He+density can be equal to or even higher than
that of O+and/or H+. An example of such a situation
(fol-lowing from the TTS model and supported by the experimen-tal data) is given in Fig. 9. At the altitude of 1300 km during the night (MLT=3h) and at low mid-latitudes the densities of O+, H+and He+are equal for F10.7=230. At this particular local time and latitude the relative N+ behaves similarly to He+rather than O+. This could be caused by the importance of the chemical reaction of the relatively abundant He+with N2producing N+(Adams and Smith, 1976) at low altitudes
and transporting it upwards.
5 Discussion and summary
Our database comprising the ion composition and electron density at altitudes from 400 to 3000 km made it possible to study the manifestation of solar activity in the densities of the individual ion species for different latitudes and local times. The paper deals with the equinox period - the behavior of the major ion densities in the topside ionosphere at solstices will be the subject of further studies.
For the first time, the behavior of the densities of the four most important ions in the outer ionosphere has been shown over such a large range of solar activity. The density of ions with medium atomic weight always increases with increas-ing solar activity. The reason is an increase in the F2 layer density (almost O+ only) and also the increase in the ion temperature and corresponding scale height. Unlike the O+ density, the density of H+ decreases with increasing solar activity, or it remains almost constant. To explain this we remind the reader of the well-known fact that H+in the top-side ionosphere is formed by the following charge-exchange reaction:
H++O O++H
(e.g. Lemaire and Gringauz, 1998). During the night we can neglect the transport of ions and the time derivative of n(H+) in the topside ionosphere and for the H+density it approxi-mately holds: n(H+) = 9 8 n(H ) n(O)n(O + ).
Using the MSIS 86 model (Hedin et al., 1987) we find that the ratio n(H)/n(O) decreases by about 2-3 orders of magni-tude from solar minimum to solar maximum. From Figs. 3 through 6 it follows that n(O+)rises by about 1–2 orders of magnitude only. The combined effect is a decrease in H+by
as much as 2 orders of magnitude.
The logarithm of the absolute density of the main ions (O+, H+, He+, N+)at a given altitude, latitude, local time, and season (equinoxes in our case) is, in the first approxima-tion, a linear function of the solar activity characterized by the F10.7 index (see the lower panels of Figs. 3 through 6 and Fig. 9).
The presented results also confirm the importance of the increasing He+ density with increasing solar activity. Un-der high solar activity at altitudes below 1000 km, the He+ density is regularly up to one order higher than that of H+ during the day (Figs. 7 and 8). Above 1000 km sometimes the amounts of O+, H+, and He+may be equal. This fact has not yet been reflected in the existing empirical models (IRI and K¨ohnlein, 1989).
For representation of vertical profiles of the individual ion densities other functions than that corresponding to the Booker’s formalism should be determined. The best would be such that would physically describe the vertical distribu-tion of ion densities.
Acknowledgements. We are grateful to NSSDC and to the
experi-ment PIs J. H. Hoffmann, H. C. Brinton, and H. Taylor Jr. for pro-viding the AE-C, AE-E, and OGO-6 data. This research was partly supported by Grant No. 205/02/P037 of the Grant Agency of the Czech Republic, by Grant No. 205/03/0953 of the Grant Agency of the Czech Republic and by Joint Grant ME651 of the Grant Agency of the Ministry of Education of the Czech Republic and the US Na-tional Science Foundation No.0245457.
Topical Editor M. Pinnock thanks D. Bilitza and M. K. Goel for their help in evaluating this paper.
References
Adams, N. G. and Smith, D.: Production distributions for some ion-molecule reactions, J. Phys., B9, 1439–1452, 1976.
Bilitza D.: International Reference Ionosphere 1990, National Space Science Data Center, NSSDC 90-22, 71-76, Greenbelt, MD, 1990.
Bilitza, D.: A correction for the IRI topside electron density model based on Alouette/ISIS topside sounder data, Adv. Space Res., 33(6), 838–843, 2004.
Booker, H. G.: Fitting of multiregion ionospheric profiles of elec-tron density by a single analytic function of height, J. Atmos. Terr. Phys., 39, 619–623, 1977.
Craven, P. D., Comfort, R. H. , Richards, P. G, and Grebowsky, J. M.: Comparison of modeled N+, O+, H+, and He+in the mid-latitude ionosphere with mean densities and temperatures from Atmosphere Explorer, J. Geophys. Res., 100, 257-268, 1995. Ershova, V. A., Kochnev, V. A., Roste, O. Z. , Shultchishin, Y. A. ,
ˇSmilauer, J., and Tˇr´ıskov´a, L.: He+
ion dominance in the high-latitude upper ionosphere as observed in “Active” experiment, Adv. Space Res., 22(6), 1381–1384, 1998.
Gonzalez, S. A., Fejer, B. G., Heelis, R. A., and Hanson, W. B.: Ion composition of the topside equatorial ionosphere during solar minimum, J. Geophys. Res., 97, 4299–4303, 1992.
Gonzalez, S. A., Sulzer, M. P. , Nicolls, M. J., and Kerr, R. B.: Solar cycle variability of nighttime topside helium ion concentrations over Arecibo, J. Geophys. Res., 109, A07302, doi:10.1029/2003JA010100, 2004.
Grebowsky, J. M., Rahman N. K., and Tylor, H. A., Jr.: Compari-son of coincident 0G0-3 and 0G0-4 Hydrogen ion composition measurements, Planet. Space Sci. 18, 965-976, 1970.
Hedin, A. E.: MSIS 86 thermospheric model, J. Geophys. Res., 92, 4649–4662, 1987.
Heelis. R. A., Murphy J. A., and Hanson W. B.: A feature of be-haviour of He+in the nightside high-latitude ionosphere during equinox, J. Geophys. Res., 86, 59–64, 1981.
Heelis, R. A., Hanson, W. B., and Bailey, G. J.: Distribution of He+at middle and equatorial latitudes during solar maximum, J. Geophys. Res., 95, 10 313–10 320, 1990.
Hoegy W. R., Grebowsky J. M., and Brace L. H.: Ionospheric Ion Composition from Satellite Measurements Made During 1970– 1980: Altitude Profiles. Adv. Space Res., 11(10), 173–182, 1991. Hoffman, J. H., Johnson, C. Y., Holmes, J. C., and Young, J. M.: Daytime mid-latitude ion composition measurements, J. Geo-phys. Res., 74, 6281–6290, 1969.
Iwamoto, I., Sagawa, E., and Watanabe, S.: Dependence of the top-side ion composition on the solar flux and its implication to IRI model, Adv. Space Res., 25(1), 197–200, 2000.
Johnson, C. Y.: Ionospheric composition and density from 90 to 1200 km at solar minimum, J. Geophys. Res., 71, 1, 330–332, 1966.
K¨ohnlein, W.: A model of the terrestrial ionosphere in the altitude interval 50–4000 km: I. Atomic Ions (H+, He+, N+,O+). Earth, Moon, and Planets, 45, 53–100, 1989.
Lemaire J. F. and Gringauz, K. I.: The Earth’s plasmasphere. Cam-bridge, 1998.
MacPherson, B., Gonzalez, S. A., Bailey, G. J., Moffett, R. J., and Sulzer, M. P.: The effects of meridional neutral winds on the O+
−H+ transition altitude over Arecibo, J. Geophys. Res., 103, 29 183–29 198, 1998.
Matuura, N., Kotaki, M., Miyazaki, S., Sagawa, E., and Iwamoto, I.: ISS-b experimental results on global distributions of ionospheric parameters and thunderstorm activity, Acta Astronautica, 8, 527, 1981.
Shultchishin, Y. A., Afonin, V. V., Grechnev, K. V., Ershova, V. A., Kochnev, V. A., Roste, O. Z., Smirnova, N. F., and ˇSmilauer, J.: Intercosmos-24: Helium ion predominance at low and mid-latitudes during equinox in the 22nd solar activity cycle, Adv. Space Res., 18(3), 15B18, 1996.
Taylor, Jr., H. A., Mayr, H. G., and Brinton, H. C.: Observations of hydrogen and helium ions during a period of rising solar activity, Space Research, vol X, 663–678, 1970.
Taylor, H. A.: Parametric description of thermospheric ion compo-sition results, J. Geophys. Res., 78, 315–319, 1973.
Tˇr´ıskov´a, L., Truhl´ık, V., ˇSmilauer, J., and Shultchishin, Yu. A.: Comparison of O+/H+and O+/(H++ He+)Transition Levels, Adv. Space Res., 22(6), 897, 1998.
Tˇr´ıskov´a, L., Truhl´ık, V.,and ˇSmilauer, J.: On possible improve-ments of outer in composition model in IRI. Adv. Space Res., 29(6), 849–858, 2002.
Tˇr´ıskov´a, L., Truhl´ık, V., and ˇSmilauer, J.: An empirical model of ion composition in the outer ionosphere. Adv. Space Res., 31(3), 653–663, 2003.
Truhl´ık, V., Tˇr´ıskov´a, L., and ˇSmilauer, J.: Improved electron tem-perature model and comparison with satellite data. Adv. Space Res., 27(1), 101–109, 2001.
Truhl´ık, V., Tˇr´ıskov´a, L., and ˇSmilauer, J.: Empirical Modeling of the Upper Transition Height for Low and Middle Latitudes, Adv. Space Res., 27(1), 111–114, 2001.
Truhl´ık, V., Tˇr´ıskov´a, L., ˇSmilauer, J., and Iwamoto, I.: Comparison of a new global empirical ion composition model with available satellite data, Adv. Space Res., 31(3), 665–675, 2003.
Truhl´ık, V., Tˇr´ıskov´a, L., and ˇSmilauer, J.: New advances in empir-ical modelling of ion composition in the outer ionosphere. Adv. Space Res., 33(6), 844–849, 2004.
West K. H., Heelis R. A., and Rich F. J.: Solar activity variations of the low-latitude topside ionosphere, J. Geophys. Res., 102, 295– 305, 1997.