HAL Id: hal-00316631
https://hal.archives-ouvertes.fr/hal-00316631
Submitted on 1 Jan 1999
HAL is a multi-disciplinary open access
archive for the deposit and dissemination of sci-entific research documents, whether they are pub-lished or not. The documents may come from teaching and research institutions in France or abroad, or from public or private research centers.
L’archive ouverte pluridisciplinaire HAL, est destinée au dépôt et à la diffusion de documents scientifiques de niveau recherche, publiés ou non, émanant des établissements d’enseignement et de recherche français ou étrangers, des laboratoires publics ou privés.
Very low zonally asymmetric ozone values in March
1997 above the North Atlantic-European region, induced
by dynamic processes
G. Entzian, D. Peters
To cite this version:
G. Entzian, D. Peters. Very low zonally asymmetric ozone values in March 1997 above the North Atlantic-European region, induced by dynamic processes. Annales Geophysicae, European Geosciences Union, 1999, 17 (7), pp.933-940. �hal-00316631�
Very low zonally asymmetric ozone values in March 1997 above the
North Atlantic-European region, induced by dynamic processes
G. Entzian, D. Peters
Institut fuÈr AtmosphaÈrenphysik an der UniversitaÈt Rostock, D-18225 KuÈhlungsborn, Mecklenburg-Vorpommern, Germany E-mail: [email protected]
Received: 15 September 1998 / Revised: 25 January 1999 / Accepted: 26 January 1999
Abstract. The total ozone distribution in March 1997 showed very low values in the North Atlantic-European region, even lower than in the years before. A spatial pattern correlation between the zonally asymmetric part of total ozone and that of the 300 hPa surface geopo-tential of the Northern Hemisphere was applied to examine the spatial structure of the low ozone values and its dynamic dependence. A trend analysis in the North Atlantic-European region was carried out to determine to what extent the low March 1997 ozone values are related to the decadal change of meteorolog-ical parameters in the lower stratosphere, observed since the 1980s, in comparison to the interannual variability. The conclusion is that the very low ozone values above the North Atlantic-European region in March 1997 were mainly induced by dynamic processes, namely their decadal change as well as their interannual variability. Key words. Meteorology and atmospheric dynamics (climatology; middle atmosphere dynamics).
1 Introduction
From observations by European ground-based ozone stations (Ozone Data for the World) it is known that total ozone values were very low above Europe during March 1997, comparable to the ozone values in the years after the Pinatubo eruption in 1991. The mean total ozone distribution according to Adeos TOMS observations in March 1997 (available from NASA) shows values down to 310 Dobson Units (DU) above the North Atlantic-European region in mid-latitudes, equivalent to a 20% reduction of normal values. These
values are lower than in any previous year during the period of TOMS-measurements on Nimbus 7 from 1979±92. Because of the measuring gap between 1993 and 1996 deciding whether these low values are part of the well known negative ozone trend or just a result of interannual variability requires consideration.
Here we will concentrate on the dynamically induced ozone changes because dierent analyses showed that a high degree of temporal and spatial ozone changes in mid-latitudes can be explained by dynamic processes. Dobson et al. (1929) already knew the connection between synoptic conditions and ozone content changes. Schoeberl and Krueger (1983) for instance found an in¯uence of planetary waves of wave number 5 on the ozone distribution in the Southern Hemisphere summer by a linearized transport equation, and in addition Kurzeja (1984) and Wirth (1993) found the in¯uence of ultra-long planetary waves on the spatial ozone distri-bution in winter with a similar transport model.
Covariant patterns of the interannual and intrasea-sonal ozone and geopotential variability were extracted by the SVD method in Greisiger et al. (1998). Using the geopotential in 14 layers between 700 and 2 hPa they were able to assess the vertical contribution to the Northern Hemisphere ozone variability. On dierent time scales from QBO up to long term trends a connection between total ozone and lower stratospheric temperature was found for the Northern and Southern Hemispheres by Randel and Cobb (1994). They found a distinct correlation between the spatial distributions of these two parameters which can be attributed to radiation and dynamic processes.
That a decadal change of the January geopotential during the eighties caused a trend-like change in the ozone distribution for the Northern Hemisphere was shown by Hood and Za (1995) and Peters et al. (1996), applying the mentioned linear transport model on the propagation of ultra-long planetary waves. Moreover Peters et al. (1996) showed that the dynamic in¯uence on the ozone change is best noticeable in the zonally asymmetric part of total ozone via the horizontal and
the vertical advection of ozone in the height region between the tropopause and the ozone layer maximum. This investigation of the in¯uence of long-term changes in meteorological parameters on ozone has been ex-tended by Peters and Entzian (1996b) for the winter months December and February; by McCormack and Hood (1997a) for February and by Graf et al. (1998) for March, here with respect to the long-term trend in lower stratospheric temperature together with GCM experi-ments.
This work deals with the zonally asymmetric part of the ozone and geopotential ®elds. Because the physical connection between wave dynamics and zonally asym-metric ozone distribution is essentially described by the transport model mentioned, it will be sucient here to prove the link in March by a statistical analysis only. The aim of this study is to examine to what extent dynamics are responsible for the observed low total ozone values in the North Atlantic-European region in March 1997 and whether the strong depletion compared to earlier years is explained by a continuation of the decadal changes of the eighties through a change of the conditions for large-scale transport processes in mid-latitudes, up to now found in winter (Peters and Entzian, 1998). The knowledge of trend-like dynamic in¯uences on the ozone density and their spatial distribution is an important condition for the assessment of possible chemical ozone depletion.
In Sect. 2 the data used and the method of analysis are described. In Sect. 3 the results for mid-latitudes, especially in the North Atlantic-European region, are presented and a discussion is given in Sect. 4.
Note, that in March 1997 extremely low ozone values also occurred above the Arctic but these ozone deple-tions in high geographic latitudes are mainly chemically induced (see special issue of Geophys. Res. Lett., vol. 24, 22, 1997) and are not subject of this study.
2 Data
Total ozone values from TOMS measurements are used in the following. Values for March 1997 were taken from TOMS on board the satellite Adeos (NASA, via Internet: http://jwocky.gsf.nasa.gov) and before 1993 from that on board of Nimbus 7 (version 7, McPeters and Beach, 1996). The zonally asymmetric part (distur-bance; later marked by a star) was calculated as the dierence at each grid point between measured value (ozone or geopotential) minus the zonal average in the respective latitude. The spatial distribution of the ozone disturbance is compared with that of geopotential at 300 hPa on a latitude ´ longitude grid of 5° ´ 10°. The 300 hPa surface was chosen because it is a good indicator of upper tropospheric and lower stratospheric dynamics, (e.g. Peters and Entzian, 1996a). The geopo-tential values are taken from the NCEP reanalysis data set (Kalnay et al., 1996; the 1997 data via Internet from NCEP: http//:nic.fb4.noaa.gov:8000).
For later comparisons with the 1997 ozone values we chose the average of the ®ve year period 1988±1992 because these are the nearest Nimbus TOMS measure-ments to those of Adeos TOMS and so guaranteeing comparability. A ®ve year average was chosen to hold the interannual in¯uence as small as possible, at least over the period of comparison.
3 Results
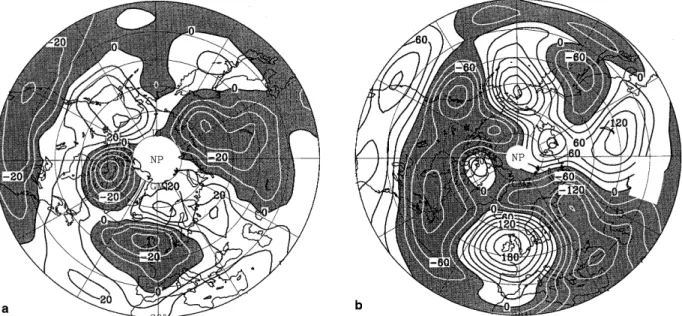
Figure 1 shows the disturbances of (Fig. 1a) total ozone and of (Fig. 1b) geopotential on the 300 hPa surface in March 1997 in the Northern Hemisphere between 30° and 80°N. The strong negative ozone disturbance above the North Atlantic-European region up to )70 DU is clearly recognizable. In the same region the geopotential
Fig. 1a, b. Disturbance, March 1997 a total ozone by Adeos TOMS. DO3* = 10 DU b geopotential (300 hPa), DG* = 50 gpm. Shaded area: negative
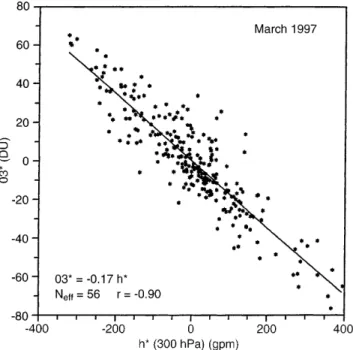
shows distinct positive deviations from the zonal mean, of up to 350 gpm. Also in most of other regions of the Northern Hemisphere there is a distinct anticorrelation between ozone and geopotential disturbance, as was already shown by Peters et al. (1996) for mean January. To get an idea how strong this anticorrelation is, a correlation scatter diagram is given in Fig. 2 of the grid point values of Fig. 1a, b in the latitude band from 30° to 60°N. Values of all 252 grid points are included. The correlation coecient amounts to )0.90, which indicates that about 80% (square of the correlation coecient) of the spatial ozone disturbance distribution can be explained by the spatial distribution of the geopotential. The autocorrelation of the grid point values has to be considered to assess the signi®cance (Taubenheim, 1969). The number of eective independent grid points becomes Ne= 56. With this the given correlation
coecient is signi®cant at a higher level than 99%. The resulting regression coecient amounts to )0.17 DU/ gpm. This statistical result suggests that the spatial structure of the ozone distribution in March 1997 is mainly determined by dynamic processes of the upper troposphere and the lower stratosphere. Note that this is supported by the above mentioned linear transport model. The statistical coecients of Fig. 2 and of
further correlations, not shown in detail but interpreted later, are given in Table 1.
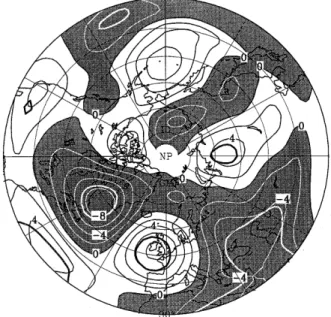
To learn whether ozone and geopotential have also similarly changed in recent years, Fig. 3 represents the March 1997 values minus the average of the ®ve March months 1988±92 for (Fig. 3a) ozone as well as for (Fig. 3b) the geopotential. It can be seen that above the North Atlantic-European region the ozone values are up to 30 DU lower than in the mean of the ®ve earlier March months. Further areas of lower ozone values are Siberia, east Canada and the subtropical part of North America. The distribution of the geopotential dieren-ces shows a very similar structure but of opposite sign. Analogous to Fig. 2 the pattern correlation of the grid point values was also analyzed here (Table 1). It results in a correlation coecient of )0.80; i.e. 60% of the ozone change is explained by the geopotential change between 1997 and the ®ve years mean, 1988±92; consid-ering an Ne= 69, this correlation coecient is also
signi®cant (>99%). Note in this case the regression coecient amounts to )0.16 DU/gpm and is of the same order as March 1997 alone.
Further for the North Atlantic-European region the question is investigated whether the observed strong negative ozone deviation relative to the reference period is in accordance with the assumption of a continuation of the negative decadal change (means temporal linear regression) in the ozone disturbance found for winter months or if this is only the expression of a strong interannual variability. Because there is a gap between 1993 and 1996 in the TOMS total ozone measurements the signi®cant correlation between ozone and geopoten-tial change is useful for examining this question, since geopotential analyses exist continuously. In Fig. 4 the point 50°N, 10°W in the centre of the area of negative ozone disturbance in the Northeast Atlantic from Fig. 3a was selected for this investigation. The temporal behaviour of the ®elds at this point may be considered representative of the whole area. In Fig. 4 monthly means of zonal averaged values (zon), the disturbances (*) and the sum of both (S) for ozone (O3) as well as for the geopotential of 300 hPa (G) are shown.
The 1997 value ®ts well into the negative trend of the ozone sum O3S. Note that this value is not only lower
than the average of 1988±92, as is seen from Fig. 3, but now we can see that it is the lowest value of all years analysed. The distinct negative trend is composed of the well known negative trend of the zonal mean ozone O3zon and the decadal (here negative) change of the
ozone disturbance O3* at this given grid point. In the
Fig. 2. Scatter diagram of the grid point values of Fig. 1a, b for spatial correlation
Table 1. Statistical parameters of the relation of zonally asymmetric ozone and geopotential
Parameter r b [DU/gpm] Ne Sign. %
O3*, G* (March 1997) )0.90 )0.17 56 >99 O3* Di, G* Di )0.80 )0.16 69 >99
b [(DU/y)/(gpm/y)]
O3*Tr, G*Tr (1979±92) )0.62 )0.16 56 >99 r: correlation- and b: linear regression coecients of O3* with G* and O3*-change with G*-change (Di or Tr) for the Northern Hemisphere 30°±60°N, 0°±360°E. Di: 1997 minus (average of 1988±92). Tr: temporal linear regression in the given period. Ne: number of eective independent grid points. Sign:
same way the positive decadal change in geopotential (GS) is composed of a weak but signi®cant positive
decadal change in the zonal mean (Gzon) and a stronger
one in the geopotential disturbance (G*). The
coe-cients of the shown regression lines (ozone: 1979±92 and 1997; geopotential: 1979±97) are given in Table 2. For example the zonal mean ozone trend ()1.8 DU/y) is of the same order as the zonally asymmetric decadal ozone change ()1.6 DU/y) in the North Atlantic-European region. This is nearly the same one to one relation as found by Peters and Entzian (1996) for January in this region (O3zon: )2.7 DU/y; O3*: )2.6 DU/y). The
reversed trends in the decadal changes of ozone and geopotential are obvious.
The interannual variability of G*-values shows a deviation from the mean tendency in 1995 and 1996, but the value in 1997 reverts so that the former tendency is maintained and even exceeds the mean extrapolation. Compared to the whole variance of the geopotential, its change is strongest between 1996 and 1997. By compar-ing G* and O3* it can be recognised that not only the mean tendency in the temporal evolution shows oppo-site inclinations but also the interannual variability is anticorrelated. It is thus consistent with the too high G*-value of 1997 that the O3*-G*-value of 1997 (+) is too low with respect to the mean tendency. Using the signi®cant correlation of the trend-eliminated values of G* and O3*
Fig. 3a, b. Disturbance dierence, March 1997 minus March average 1988±1992, a total ozone, DO3* = 10 DU b geopotential (300 hPa), DG* = 30 gpm. Shaded area: negative
Fig. 4. Monthly mean values of March from 1979±97 for ozone (O3) (TOMS-measurements) and the geopotential (G) of the 300 hPa-level (NCEP-data). The values are given in zonal mean values (zon), the disturbances (*) and the sum of both (S) at 50°N 10°W. O3*: + original values; x in¯uence of geopotential interannual variability eliminated
Table 2. Regression coecients of ozone and geopotential decadal change during 1979±97 at the gridpoint 50°N10°W; b: temporal linear regression coecient. Sign: signi®cance level. For explana-tion of suces see Fig. 4
1979±92, 1997 b [DU/y] Sign. % O3S )3.42 >99 O3zon )1.83 >99 O3* )1.59 >95 1979±97 b [gpm/y] GS 10.31 >99 Gzon 2.15 >95 G* 8.16 >99
the in¯uence of the interannual G*-variability on the O3*-values can be eliminated. The resulting O3* values (x) show less variability around the regression line (the standard deviation is now 8 DU after geopotential variability elimination, in contrast to 11 DU before) and the value of 1997 reduces from )65 DU to )56 DU and now ®ts quite well into the long term tendency. Even if we take into account the remaining standard deviation of 8 DU, this point would agree with the assumption of a trend continuation. So it can be assumed that the low zonally asymmetric part of total ozone above the North Atlantic-European region in March 1997 is mainly due to both to the obviously persistent decadal change in the zonally asymmetric geopotential and to the interannual variability.
4 Discussion
Especially low ozone values above the North Atlantic-European region in the monthly mean of March 1997 are used to examine the dynamically induced variability. Dynamic causes are investigated by a statistical com-parison of the spatial distributions of the zonally asymmetric ozone with that of the zonally asymmetric geopotential on the 300 hPa surface. These results are supported by linear transport model investigations in winter months (Peters et al., 1996; Peters and Entzian, 1998), not applied here.
A continuation of the dynamically induced decadal change in the ozone distribution was assumed because the ozone disturbance above the North Atlantic-Euro-pean region in March 1997 was more strongly negative than in earlier years. This was proved by analysing the dierence between the March 1997 mean and the monthly average of the years 1988±92 for March. (A direct analysis of the temporal regression was not
possible due to the TOMS data gap between 1993 and 1996; Nimbus TOMS ®nished in 1993 and TOMS on Adeos began in 1996). If the continuation of the decadal change really exists then this dierence should have similar spatial structures above the North Atlantic-European region to the decadal ozone change found in the eighties. In Fig. 5 the decadal change is shown for the zonally asymmetric distributions of ozone and geopotential over the period 1979±92. In comparison with Fig. 3 similar areas indeed exist, especially above the North Atlantic, Europe, Siberia and the northwest coast of North America, i.e. this pattern comparison supports the conclusion of a decadal change continua-tion over a large area of the Northern Hemisphere.
However, if the ozone dierence between 1997 and the average of 1988±92 (which represents a seven year period) is recalculated to ozone change per year, then the dierences give higher trends (double or even threefold) than the long-time decadal change. Above Western Europe this dierence is 30 DU (Fig. 3), i.e. because of the seven year period it is about 4 DU/y, but the trend from Fig. 5 reads 1.5 DU/y. This higher trend formally calculated from the dierence can be attributed to interannual variability, increasing the so calculated long term trend in March 1997, as could be shown in Fig. 4 for one geographical point. So it becomes clear that the very low value of the zonally asymmetric ozone above the North Atlantic-European region in March 1997 results from the superposition of the continuing decadal ozone change and an extreme interannual contribution in 1997.
Although the ratio of geopotential to ozone changes in Figs. 3 and 5 is uniform at 0.16 DU/gpm or (DU/y)/ (gpm/y), respectively (see Table 1), this ratio is not constant over the whole Northern Hemisphere. Above Siberia an area of strong ozone decrease can be recognized in Fig. 5 which is not wholly explained by
Fig. 5a, b. Decadal change during March in the period 1979±92 of a ozone disturbance by Nimbus TOMS, DdO3*/dt = 0.5 DU/y b geopotential disturbance, DdG*/dt = 2 gpm/y. Shaded area: negative. Thick encircled areas are signi®cant >95%
the respective area of geopotential increase. Graf et al. (1998) show a distinct cooling in the lower stratosphere in this region. They suggest that heterogeneous chemical processes, induced by the cooling, could have led to an additional ozone depletion. Note that in Fig. 5 in the polar regions near 120°W there is also an area of ozone change not in anticorrelation with the geopotential change. But as mentioned already, the polar region is beyond the scope of this study.
It has to be considered, that the results given here are based on measurements from two dierent TOMS instruments. The TOMS processing team has compared Nimbus TOMS with 30 (McPeters and Labow, 1996) and Adeos TOMS with 45 ground based stations (Krueger et al., 1998). This comparison results in smaller biases of about 0.5% for Nimbus TOMS and about 1.5% higher values than the ground measure-ments for Adeos TOMS, but a dierence of about 2% during March 1997 can be recognised for Adeos TOMS, as shown in their Fig. 5.2.
To get an idea whether there could be a longitude dependent bias (because we looked chie¯y at the Atlantic-European sector) we compared data from both instruments with the European ground based ozone station (Potsdam, 52.37°N; 13.08°E). In Fig. 6 daily total ozone measurements by the Potsdam Dobson spectrophotometer in March 1997 are compared with the interpolation of the total ozone values at the four Adeos TOMS grid points (in our grid point net, see Sect. 2) nearest to Potsdam for each respective day. The curves are quite similar. Averaged over the whole month, Adeos TOMS values are 7.4 DU (i.e. 2.1%) higher than the station values, in good agreement with the zonal mean result for March 1997 from the TOMS processing team. For the comparisons of March 1997 with the average of the ®ve March months 1988±92, measured by Nimbus TOMS, we need the same infor-mation also on this instrument. The mean deviation between Potsdam and Nimbus TOMS is )2.3 DU in the average March 1988±92, i.e. the Nimbus TOMS values
are 0.6% lower than the Potsdam measurements, also in good agreement with the results from the TOMS processing team. So a longitude dierence can be neglected for both instruments. There where we used O3* values, the biases of each instrument will be eliminated and the results from both instruments can be compared without any corrections. But in Fig. 4 we show additionally absolute and zonal mean ozone values. In both these cases the values from 1997 are 2.5% (the dierence of the biases of both instruments to ground based stations) (i.e. about 4±6 DU) too high in respect to the former Nimbus TOMS instrument. This will not change but strengthen the result of very low ozone values above the North Atlantic-European re-gion.
There remains an open question of why this structure of long term ozone and geopotential change is so stable above the North Atlantic-European region, but is less clear in other regions. This fact can be underlined by an extension of the geopotential decadal change of 1979±92 (Fig. 5b) by further ®ve years, 1979±97 (Fig. 7). The same structures can be recognised in the longer period as in the shorter one, moreover the areas of signi®cance have increased. Peters et al. (1996) point to the similarity of this structure to the West Atlantic pattern (Wallace and Gutzler, 1981) which could also be in connection with the well known intensi®ed North Atlantic Oscilla-tion (Hurrell, 1996).
As shown by Peters et al. (1995) and Peters and Waugh (1996) the zonally averaged or regionally enhanced anticyclonic basic wind shear determines the appearance of poleward Rossby wave breaking which is linked to ozone mini-holes. It has not yet been proved wether enhanced baroclinic wave activity undergoes a decadal change, and possibly causing a decadal ozone decrease. Apart from a hint given by McCormack and
Fig. 6. March 1997 daily total ozone measurement at Potsdam (solid) in comparison with Adeos TOMS (dashed) measurements; linear interpolation of four gridpoint values nearest to Potsdam. Quasi-horizontal lines: long-term average of Potsdam values 1964±83 and 1 standard deviation
Fig. 7. Decadal change in the period 1979±97 of geopotential disturbance. Shaded area: negative; DdG*/dt = 2 gpm/y. Thick encircled areas are signi®cant >95%
Hood (1997b) no signi®cant increase in mini-hole frequency has been found (James, 1998).
There is no explanation up to now for the zonally asymmetric geopotential change which has already persisted for 19 y. During March it consists of a geopotential increase above the North Atlantic-Europe-an region on the 300 hPa level with values up to 8 gpm/y. This increase has caused an ozone decrease of 1±2 DU/y above Western Europe. This value is of the same order as the March zonal mean ozone trend, i.e. above Western Europe ozone has decreased twice as fast as in the zonal mean, and this for 19 y already. This is also valid for December and January (Peters and Entzian, 1999). The search for the causes of the long term geopotential change must be an object of further investigation.
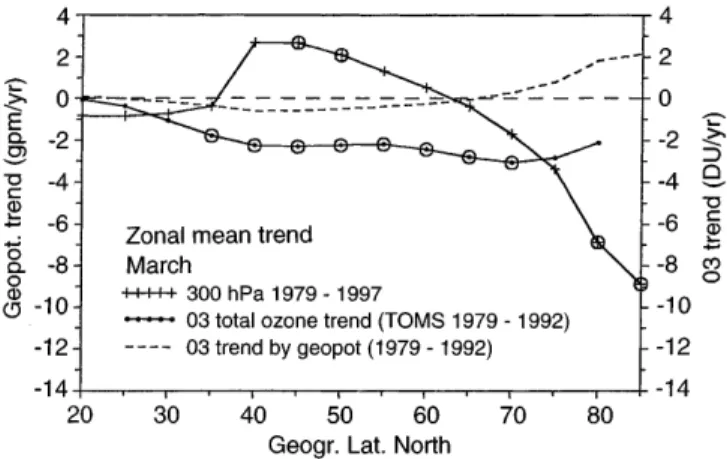
Finally we want to discuss the possible role of the longitude dependent dynamics on the zonally symmetric trend. This trend is shown in Fig. 8 for the geopotential (300 hPa, 1979±97) and for the total ozone (1979±92) in its latitudinal dependence. The ozone trend is negative with values between )2 and )3 DU/y between 20 and 85°N; between 35 and 70°N the values are signi®cant (encircled values >95%). North of 70°N the trend goes back to non signi®cant values of about )2 DU/y. Concerning the geopotential, both the lifting in mid-latitudes by 2.8 m/y and the lowering by 7 m/y in the polar regions are signi®cant.
However, in mid-latitudes the zonally symmetric trend in geopotential became signi®cant only during the last years. So one should ask if the geopotential increase participates in the ozone decrease in the zonally symmetric case. Assuming that the same dynamic process has a projection on the zonal symmetry as well on as the zonal asymmetry, then the regression coe-cient of ±0.16 (DU/y)/(m/y) (see Table 1, last row) will hold for the ratio between ozone and geopotential change, then about 25% of the zonally symmetric ozone trend can be explained dynamically by this relationship between 40 and 55°N. In higher latitudes a positive trend contribution results from the geopotential
de-crease, as shown in the dashed curve in the Fig. 8. However, it remains doubtful, whether the result of the zonally asymmetric ®eld can be transferred to zonal symmetry in such a simple way. Hood et al. (1997), using a similar procedure for February, but including in¯uences of the zonal mean circulation, found a value which dynamically describes up to 50% of the zonally symmetric ozone trend in mean latitudes. However, the remaining part of the zonally symmetric ozone trend may be obviously chemically induced.
Acknowledgements. This project was carried out within the Ger-man Ozone Research Program of the Bundesminister fuÈr Bildung, Wissenschaft, Forschung and Technologie (grant: 01 LO 9402). Support by the NCEP for providing the geopotential data set up to 1997 and by the NASA Ozone Processing Team at Goddard Space Flight Center for making available Nimbus TOMS (version 7) and Adeos TOMS (March 1997) data, is gratefully acknowledged. U. Feister kindly provided the Potsdam re-analysis total ozone data for the years before 1993 and the regular total ozone data since 1993. We are grateful to U. Koehler (Hohenpeissenberg), who stimulated this March investigation, and to S. Guttmann for developing computer programs to handle the data and preparing stereographic ®gures, and to P. James for improving the manuscript.
Topical Editor F. Vial thanks L. L. Hood and another referee for their help in evaluating this paper.
References
Dobson, G. M. B., D. N. Harrison, and J. Lawrence, Measurements of the amount of ozone in the earth's atmosphere and its relation to other geophysical conditions, Proc. R. Soc. London, A. 122, 456±486, 1929.
Greisiger, K. M., D. Peters, G. Entzian, and C.-O. Hinrichs, On the horizontal and vertical structure of the zonally asymmetric intraseasonal and interannual ozone variability in winter, Clim. Dyn., 14, 891±904, 1998.
Graf, H.-F., I. Kirchner, and J. Perlwitz, Changing lower strato-spheric circulation: The role of ozone and greenhouse gases, J. Geophys. Res., 103, D10, 11 251±11 261, 1998.
Granier, C., and G. Brasseur, Impact of heterogeneous chemistry on model predictions of ozone changes, J. Geophys. Res., 97, 18 015±18 033, 1992.
Hood, L. L. and D. A. Za, Lower stratospheric stationary waves and the longitude dependence of ozone trends in winter, J. Geophys. Res., 100, D12, 25 791±25 800, 1995.
Hood, L. L., J. P. McCormack, and K. Labitzke, An investigation of dynamical contributions to midlatitude ozone trends in winter, J. Geophys. Res., 102, D11, 13 079±13 093, 1997. Hurrell, J. W., In¯uence of variations in extratropical wintertime
teleconnections on Northern Hemisphere temperature, Geo-phys. Res. Lett., 23, 665±668, 1996.
James, P. M., A climatology of ozone mini-holes over the northern hemisphere, Int. Journ. Climatol., 18, 1287±1303, 1998. Kalnay, E., M. Kanamitsu, R. Kistler, W. Collins, D. Deaven, L.
Gandin, M. Iredell, S. Saha, G. White, J. Woollen, Y. Zhu, M. Chelliah, W. Ebisuzaki, W. Higgins, J. Janowiak, K. C. Mo, C. Ropelewski, J. Wang, A. Leetmaa, R. Reynolds, R. Jenne, and D. Joseph, The NCEP/NCAR 40-year reanalysis project, Bull. Am. Meteorol. Soc., 77, 3, 437±470, 1996.
Krueger, A., P. K. Bhartia, R. McPeters, J. Herman, C. Wellem-eyer, G. Jaross, C. Seftor, O. Torres, G. Labow, W. Byerly, L. Moy, S. Taylor, T. Swissler, and R. Cebula, ADEOS Total Ozone Mapping Spectrometer (TOMS) Data Products User's Guide, NASA/TP-98-20 6857, Goddard Space Flight Center, Greenbelt, Maryland 20771, 1998.
Kurzeja, R. J., Spatial variability of total ozone at high latitudes in winter, J. Atmos. Sci., 41, 695±697, 1984.
Fig. 8. Zonal symmetric trend values in latitudinal dependence of the Northern Hemisphere for geopotential (300 hPa, 1979±97) and for total ozone (TOMS, 1979±92). Encircled values are signi®cant >95%. Dashed curve: dynamically induced part of the ozone trend under distinct assumptions, see text
McCormack, J. P., and L. L. Hood, Modeling the spatial distribution of total ozone in northern hemisphere winter: 1979±1991, J. Geophys. Res., 102, D12, 13 711±13 717, 1997a. McCormack, J. P., and L. L. Hood, The frequency and size of
ozone ``mini-hole'' events at northern mildlatitude in winter, Geophys. Res. Lett., 24, 2647±2650, 1997b.
McPeters, R., and E. Beach, TOMS version 7-O3 gridded data: 1978±1993; CD-ROM, NASA Goddard Space Flight Center, 1996.
McPeters, R. D., and G. J. Labow, An assessment of the accuracy of 14, 5 years of Nimbus 7 TOMS version 7 ozone data by comparison with the Dobson network, Geophys. Res. Lett., 23, 3695±3698, 1996.
Ozone Data for the World, Atmospheric Environment Service, Department of Environment in co-operation with the WMO, Downsview, Ontario, Canada.
Peters, D., J. Egger, and G. Entzian, Dynamical aspects of ozone mini-hole formation, Meteorol. Atmos. Phys., 55, 205±214, 1995. Peters, D., and D. Waugh, In¯uence of barotropic shear on the poleward advection of upper tropospheric air, J. Atmos. Sci., 53, 3013±3031, 1996.
Peters, D., and G. Entzian, January ozone anomaly over the North Atlantic±European region: Longitude-dependent decadal change in total ozone during 1979±1992, Meteorol. Z., N. F 5, H1, 41±44, 1996.
Peters, D., and G. Entzian, On the longitude-dependent total ozone trend over the Atlantic-European region in boreal winter
month, in Atmospheric Ozone, Ed. R. D. Bojkov, G. Visconti, Proc. XVIII Quadr. Ozone Symp. L'Aquila, Sept. 1996, 69±72, 1998.
Peters, D., G. Entzian, and G. Schmitz, Ozone anomalies over the North Atlantic-European region during January 1979±1992 ± linear modelling of horizontal and vertical ozone transport by ultra-long waves, Beitr. Phys. Atmosp., 69, 477±489, 1996. Peters, D., and G. Entzian, Longitude-dependent decadal changes
of total ozone in boreal winter months during 1979±1992, J. Clim., 12 (4), 1038±1048, 1999.
Randel, W. J., and J. B. Cobb, Coherent variations of monthly mean total ozone and lower stratospheric temperature, J. Geophys. Res., 99, D3, 5433±5447, 1994.
Schoeberl, M. R., and A. J. Krueger, Medium scale disturbances in total ozone during southern hemisphere summer, Bull. Am. Meteorol. Soc. 64, 1358±1365, 1983.
Taubenheim, J., Statistische Auswertung geophysikalischer und meteorologischer Daten, Akadem. Verlagsges. Geest u. Portig K.-G., Leipzig, 1969.
Wallace, J. M., and D. S. Gutzler, Teleconnections in the geopotential height ®eld during the northern hemisphere winter, Mon. Weather. Rev., 109, (4), 784±812, 1981.
Wirth, V., Quasi-stationary waves in total ozone and their correlation with lower stratospheric temperatures, J. Geophys. Res., 98, D5, 8873±8882, 1993.