HAL Id: hal-00296455
https://hal.archives-ouvertes.fr/hal-00296455
Submitted on 25 Feb 2008
HAL is a multi-disciplinary open access
archive for the deposit and dissemination of
sci-entific research documents, whether they are
pub-lished or not. The documents may come from
teaching and research institutions in France or
abroad, or from public or private research centers.
L’archive ouverte pluridisciplinaire HAL, est
destinée au dépôt et à la diffusion de documents
scientifiques de niveau recherche, publiés ou non,
émanant des établissements d’enseignement et de
recherche français ou étrangers, des laboratoires
publics ou privés.
A. Stenke, V. Grewe, S. Pechtl
To cite this version:
A. Stenke, V. Grewe, S. Pechtl. Do supersonic aircraft avoid contrails?. Atmospheric Chemistry and
Physics, European Geosciences Union, 2008, 8 (4), pp.955-967. �hal-00296455�
www.atmos-chem-phys.net/8/955/2008/
© Author(s) 2008. This work is distributed under the Creative Commons Attribution 3.0 License.
Chemistry
and Physics
Do supersonic aircraft avoid contrails?
A. Stenke1, V. Grewe1, and S. Pechtl1,*1Deutsches Zentrum f¨ur Luft- und Raumfahrt, Institut f¨ur Physik der Atmosph¨are, Oberpfaffenhofen, 82230 Wessling,
Germany
*now at: German Patent Office, 80297 M¨unchen, Germany
Received: 22 August 2007 – Published in Atmos. Chem. Phys. Discuss.: 4 September 2007 Revised: 11 January 2008 – Accepted: 24 January 2008 – Published: 25 February 2008
Abstract. The impact of a potential future fleet of
super-sonic aircraft on contrail coverage and contrail radiative forc-ing is investigated by means of simulations with the general circulation model ECHAM4.L39(DLR) including a contrail parameterization. The model simulations consider air traffic inventories of a subsonic fleet and of a combined fleet of sub-and supersonic aircraft for the years 2025 sub-and 2050, respec-tively. In case of the combined fleet, part of the subsonic fleet is replaced by supersonic aircraft. The combined air traf-fic scenario reveals a reduction in contrail cover at subsonic cruise levels (10 to 12 km) in the northern extratropics, espe-cially over the North Atlantic and North Pacific. At super-sonic flight levels (18 to 20 km), contrail formation is mainly restricted to tropical regions. Only in winter is the north-ern extratropical stratosphere above the 100 hPa level cold enough for the formation of contrails. Total contrail cover-age is only marginally affected by the shift in flight altitude. The model simulations indicate a global annual mean contrail cover of 0.372% for the subsonic and 0.366% for the com-bined fleet in 2050. The simulated contrail radiative forcing is most closely correlated to the total contrail cover, although contrails in the tropical lower stratosphere are found to be optically thinner than contrails in the extratropical upper tro-posphere. The global annual mean contrail radiative forcing in 2050 (2025) amounts to 24.7 mW m−2(9.4 mW m−2) for the subsonic fleet and 24.2 mW m−2(9.3 mW m−2) for the combined fleet. A reduction of the supersonic cruise speed from Mach 2.0 to Mach 1.6 leads to a downward shift in contrail cover, but does not affect global mean total contrail cover and contrail radiative forcing. Hence the partial substi-tution of subsonic air traffic leads to a shift of contrail occur-rence from mid to low latitudes, but the resulting change in contrail-induced climate impact is almost negligible.
Correspondence to: A. Stenke
1 Introduction
Contrails are line-shaped ice clouds which form in the wake of jet aircraft. Like natural cirrus clouds, they have an in-fluence on the earth’s climate system. The Special Report on “Aviation and the Global Atmosphere” by the Intergov-ernmental Panel on Climate Change (IPCC, 1999) estimated the global radiative forcing (RF) of contrails in 1992 to be in the range of 0.02 W m−2 which amounts to 40% of the
total RF caused by aviation. Sausen et al. (2005) provided an updated estimate of aviation RF for the year 2000, mainly based on results of the EU project TRADEOFF. These results indicate a global RF of (line-shaped) contrails of 0.01 W m−2 which is approximately a factor of three to four smaller than the IPCC-based estimate scaled to 2000 (0.034 W m−2). Fur-thermore, Stuber and Forster (2007) reported a RF value of 0.002 W m−2for 1992 which currently remarks a lower limit for contrail RF. Recently, the IPCC (2007) provided an esti-mate of the global contrail RF in 2005 of 0.01 W m−2with a range from 0.003 W m−2to 0.03 W m−2.
The above mentioned estimates of contrail RF only con-sider line-shaped contrails. However, line-shaped contrails have been observed to grow to larger cirrus clouds, so called contrail cirrus (e.g. Schumann and Wendling, 1990; Minnis et al., 1998). In the TRADEOFF project, two studies of Zere-fos et al. (2003) and Stordal et al. (2005) showed a statistical correlation between air traffic trends and observed changes in cirrus cloudiness. For Europe, e.g. both studies found an increase in cirrus cover of 1–2% per decade due to air traf-fic. Based on the assumption that the radiative efficiency of cirrus equals that of contrails Stordal et al. (2005) provided a “mean” aviation-induced cirrus RF of 0.03 W m−2with a large uncertainty range from 0.01 to 0.08 W m−2. This new upper bound is significantly higher than former estimates of 0.04 W m−2(IPCC, 1999) and 0.026 W m−2(Minnis et al., 2004). Generally, the impact of aviation on cirrus clouds and the resulting RF is highly uncertain. As an upper estimate,
aircraft-induced cirrus clouds might cause a radiative forcing of the same order of magnitude as all other aircraft effects together (Sausen et al., 2005).
The thermodynamic theory (Schmidt, 1941; Appleman, 1953; Schumann, 1996) describes contrail formation as a function of combustion parameters and ambient meteorolog-ical parameters. Therefore, changes in air traffic density, en-gine technology, global climate and cruise altitude may lead to changes in contrail formation. Subsonic cruise levels are mainly located between 10 and 12 km altitude, while super-sonic aircraft fly at stratospheric levels between 18 and 20 km altitude. This means a significant change in ambient atmo-spheric conditions like temperature and humidity which can be expected to have a significant influence on contrail forma-tion and persistence. The IPCC (1999) provided an estimate for the aviation RF of a combined fleet of sub- and supersonic aircraft (scenario Fa1H) for the year 2050. In the Fa1H sce-nario 11% (in terms of emissions) of the subsonic fleet (sce-nario F1a) have been replaced by supersonic aircraft. How-ever, in IPCC (1999) it was assumed that the occurrence of persistent contrails in the stratosphere is unlikely and that contrail RF from supersonic aircraft can be neglected. Con-sequently, the given global net contrail RF for the combined fleet (Fa1H, 0.089 W m−2) was 11% smaller than the respec-tive value for the subsonic fleet (Fa1, 0.1 W m−2).
Supersonic transport has the potential for a profitable eco-nomic market, if the reduction in cruising time is large enough to compensate for additional costs. Current mar-ket forecasts for business jets see a 60% chance that a su-personic business jet (SSBJ) program will be launched in the next eight years, and a 85% chance by 2020 (Aboulafia, 2007; Wiley, 2007). A demand of 400 SSBJs over the first 20 years of production is predicted. A European consortium of 38 organisations aims to establish the technical feasibil-ity of an environmentally compliant supersonic small size transport aircraft within the EU-project HISAC (“High speed aircraft”, www.hisacproject.com). Apart from technological challenges the two biggest problems that have to be solved are sonic-boom related noise and the high fuel consumption which raises environmental concerns. Currently U.S. federal noise regulations prohibit supersonic flight over land which certainly limits the gain of supersonic air traffic.
The EU-project SCENIC (“Scenario of aircraft emissions and impact studies on chemistry and climate”) investigated the impact of a potential future supersonic fleet on atmo-spheric chemistry and climate. For supersonic transport most RF contributions differ from those of subsonic aircraft (IPCC, 1999; Grewe and Stenke, 2007). For example, NOx
emissions lead to a destruction or production of ozone, and therefore a negative or positive RF depending on the atmo-spheric region. Water vapour emissions are only a minor contributor to RF in the subsonic case, but play a major role for supersonic transport. IPCC (1999) stated that the partial replacement of a subsonic fleet by supersonic aircraft may lead to a 50% higher aircraft-induced RF in 2050 than for a
subsonic fleet. Compared to IPCC (1999) the SCENIC emis-sions datasets (Rogers et al., 20071) consider more realistic scenarios in terms of supersonic aircraft configuration, su-personic routes and market penetration, and susu-personic tech-nology.
In the present paper, we focus on the impact of future su-personic aircraft on contrail cover and the radiative impact of contrails. Our study is based on multi-year simulations with a comprehensive global general circulation model including a thermodynamic parameterization of line-shaped contrails (Ponater et al., 2002). The effect of supersonic aircraft on contrails is evaluated by means of subsonic and combined (sub- and supersonic) aircraft inventories for the years 2025 and 2050, respectively. In view of quantifying the uncertain-ties and designing a “minimum impact scenario”, different supersonic aircraft configurations for 2050 are considered in this study. A comprehensive discussion of the climate impact of potential future supersonic air traffic including the impact of NOx, CO2and water vapour emissions is given in Grewe
et al. (2007).
A description of the applied GCM configuration includ-ing the contrail parameterization and the different air traf-fic inventories is given in the following section. In Sect. 3, we present and discuss the impact of a supersonic fleet on contrail cover (Sect. 3.1) and radiative forcing (Sect. 3.2) in terms of differences between a subsonic and a mixed fleet. The impact of model deficiencies concerning the temperature and humidity distribution on the GCM results are discussed in Sect. 4. Finally, conclusions are presented in Sect. 5.
2 Methodology
2.1 Model description
In this study we applied the spectral general circulation model ECHAM4.L39(DLR) (hereafter E39, Land et al., 1999, 2002), which is a derivate of the climate model ECHAM4 (Roeckner et al., 1996) with an enhanced verti-cal resolution of 39 levels up to the model top centred at 10 hPa. This model version provides an exceptionally high vertical resolution of about 700 m in the tropopause region where air traffic mainly occurs. The spectral horizontal res-olution is T30 with a corresponding Gaussian transform grid of approximately 3.75◦×3.75◦ and a time step of 30 min. Water vapour, cloud water, and trace species are advected by the semi-Lagrangian transport scheme by Williamson and Rasch (1994). Since the advection scheme itself is not mass conserving, a mass fixer has to be applied which is an integral part of the advection scheme in ECHAM4 (Rasch and Williamson, 1990). The model contains state-of-the-art parameterizations of radiation, cumulus convection,
1Rogers, H., Marizy, C., Pascuillo, E., Egelhofer, R., and Pyle, J.: Design options for future European supersonic transport, Atmos. Chem. Phys. Discuss., in preparation, 2007.
cloud formation and precipitation, horizontal diffusion, sur-face fluxes and vertical diffusion, orographic gravity wave drag, and land surface processes (see Roeckner et al., 1996, and references therein).
The model was extended by a contrail parameterization developed by Ponater et al. (2002). The parameterization scheme is based on the thermodynamic theory of contrail formation which depends on ambient temperatures, humid-ity and natural cloudiness. Additionally, the parameterization considers actual air traffic density. The design of the aircraft inventory (see Sect. 2.2) allows the use of flown distances as a metric of air traffic. This parameter is more appropriate to scale contrail coverage than fuel consumption and modifies the global contrail coverage and RF by about 10% (Fichter et al., 2005). The simulated contrails are represented by a fractional grid box coverage, an individual ice water path, effective particle size and optical properties (Ponater et al., 2002).
Results of contrail simulations with the ECHAM4 GCM (Marquart et al., 2003) have been compared with observa-tions of contrail cover over different geographical regions based on NOAA/AVHRR satellite images (Mannstein et al., 1999; Meyer et al., 2007). For Europe, the observed contrail coverage as derived from AVHRR satellite data (Mannstein et al., 1999) is approximately 50% lower than the GCM results. This discrepancy can be reasonably explained by the underestimation of the observed contrail cover through neglecting spreading contrail features. A comparison of AVHRR-observations with the ECHAM4 model results for Asian regions over Thailand and Japan by Meyer et al. (2007) has shown that the derived patterns of the regional contrail cover agree well. Furthermore, the annual cycle of simulated contrails follows the observed seasonal variations, i.e. maxi-mum contrail cover in spring and minimaxi-mum values in autumn (Thailand) and winter (Japan), respectively. Quantitative dif-ferences between model results and observations may largely be explained by the increase in air traffic in these regions be-tween 1992 (reference year for the air traffic inventory used in the GCM simulation) and 1998 (satellite observations). Assuming a linear increase in contrail cover between the two time slice model simulations for 1992 and 2015, the expected value for 1998 from the model data closely matches the ob-served values.
The radiative forcing of contrails is calculated as differ-ence of the short- and longwave radiative fluxes with and without contrails. Consistent with previous contrail RF stud-ies based on the method of Ponater et al. (2002) we use the stratosphere-adjusted radiative forcing at the tropopause as a measure of climate impact from contrails. This is calcu-lated online during a model simulation (Stuber et al., 2001). Furthermore, we use an upgraded version of the longwave radiation scheme with modifications according to R¨ais¨anen (1998) since Marquart and Mayer (2002) found that the long-wave radiative forcing of optically thin clouds is strongly underestimated (up to 70%) in the standard ECHAM4
radi-ation scheme. With the updated radiative transfer scheme, ECHAM4 still shows a systematic deviation from the so-phisticated radiative transfer model LibRadtran of about 25% (Marquart and Mayer, 2002). This systematic deviation is caused by the exclusion of longwave scattering. According to the results of Marquart and Mayer (2002) (their Fig. 2c) the deviation in the LW forcing shows a linear behaviour over a wide range of typical tropospheric and stratospheric conditions. Therefore, we corrected the longwave RF values a posteriori by the 25% offset (Table 3). These values rep-resent our best estimate for the contrail RF from the model simulations.
The impact of supersonic aircraft on contrail formation is investigated on the basis of multiyear model simulations us-ing the above described model configuration and different air traffic inventories for subsonic and mixed fleets for the time slices 2025 and 2050, respectively. After a spin-up time the model has been integrated over 5 annual cycles in a quasi-equilibrium mode representing atmospheric conditions of the years 2025 and 2050 (time slice simulations). The future atmospheric concentrations of greenhouse gases are based on the SRES scenario A2p (IPCC, 2001). The sea surface temperatures are taken from a transient climate simulation with the coupled atmosphere-ocean-model ECHAM4/OPYC (Roeckner et al., 1999).
2.2 Air traffic inventories
The different SCENIC air traffic datasets are discussed in detail in Rogers et al. (2007)1. Here we give a short sum-mary of the main characteristics of the subsonic (S1 and S4) and mixed fleet scenarios (S2 and S5) for the years 2025 and 2050 (Table 1). In the mixed fleet part of the commercial subsonic fleet is replaced by supersonic aircraft. It is as-sumed that the first supersonic flight will be in 2015, i.e. by 2025 only a few supersonic aircraft will be in operation. For the mixed fleet only one supersonic aircraft type is designed. The reference configuration of the supersonic aircraft is iden-tical for 2025 and 2050: 250 passengers, Mach 2.0 with a range of 5500 nm. Beside the base-case mixed fleet scenario five perturbation scenarios (P2 to P6) with different super-sonic configurations have been designed for the year 2050. In this study, only the perturbation scenario P4 (reduced cruise speed) has been considered. The P4 configuration is 250 pas-sengers, Mach 1.6 with a range of 6000 nm.
A set of supersonic flight routes is defined for each con-figuration depending on the characteristics of the selected aircraft and its flight performance. For the SCENIC dataset only supersonic routes with a cruising time reduction of at least 20% of an equivalent subsonic flight time and more than one hour have been considered. Additionally, for each route, the market penetration has been evaluated to determine the percentage of supersonic passengers and the number of su-personic aircraft. The evaluation corresponds to a medium demand where the supersonic market do not exceed 30% on
Table 1. Main characteristics of the SCENIC emission dataset. S4 denotes the subsonic fleet for 2050, S5 the mixed fleet for 2050, and P4 a perturbation scenario for the mixed fleet optimised for a reduced speed (Mach 1.6). Abbreviations: nm = nautical miles (1 nm≈1852.2 m); RPK = Revenue Passenger Kilometre; pax = passenger; Tot = Total Fleet; Super = Supersonic Fleet.
Scenario Aircraft Speed Maximum Cruise RPK Commercial Commercial
Range Altitude Fuel Distance
[number] [Mach] [nm] [kft] [1011pax km] [Tg yr−1] [1010km] Supersonic Characteristics Tot Super Tot Super Tot
S1-Sub 2025 – – – – 75 – 355 – 5.63 S2-Mixed 2025 211 2.0 5500 55–65 75 4.3 370 25 5.70 S4-Sub 2050 – – – – 178.2 – 656 – 11.67 S5-Mixed 2050 501 2.0 5500 55–65 178.4 7.3 700 60 11.84 P4-Speed 2050 544 1.6 6000 47–59 178.4 6.9 682 41 11.76 -90˚ -60˚ -30˚ 0˚ 30˚ 60˚ 90˚ 180˚ -135˚ -90˚ -45˚ 0˚ 45˚ 90˚ 135˚ 180˚ 0.05 0.1 0.5 1 5 10 20 50 100 200 [Gg/yr] 180˚ -135˚ -90˚ -45˚ 0˚ 45˚ 90˚ 135˚ 180˚ -90˚ -60˚ -30˚ 0˚ 30˚ 60˚ 90˚ -100 -50 -30 -10 -5 -1 1 5 10 30 50 100 [Gg/yr]
Fig. 1. Upper panel: Horizontal distribution of the vertically integrated fuel consumption of commercial aircraft considered in the SCENIC subsonic fleet for 2050 (S4) [Gg yr−1]. Lower panel: Difference between the 2050 mixed and subsonic fleet S5-S4 [Gg yr−1].
each route. It should be mentioned that the air traffic inven-tories have been created on the condition of constant revenue
passenger kilometres (RPK) for each time slice, and not of constant fuel consumption (Table 1). All inventories con-sider commercial air traffic (scheduled passenger and cargo, charter), general aviation (executive jet, turboprop, piston, helicopter) and a military fleet (fighter, transport, bomber, trainer, helicopter). The emission datasets are based on mar-ket forecasts for the 2025 and 2050 world air traffic demand giving the total number of passengers and the mass of freight transported on each commercial route. The air traffic inven-tories provide information about the emissions of NOx, CO,
hydrocarbons, soot, particles, the total and commercial fuel consumption, and the commercial distance flown. Concern-ing the propulsion efficiencies, which are needed as input for the contrail parameterization, we use values of 0.4 in 2015 and 0.5 in 2050 as proposed by Gierens et al. (1999). A value of 0.43 in 2025 was determined by linear interpolation.
Figure 1 presents the geographical distribution of the com-mercial fuel consumption for the subsonic fleet in 2050 (S4) showing the main flight routes over the North Atlantic, USA, Europe, Asia and the North Pacific. The difference in fuel consumption between the combined and the subsonic fleet (S5–S4) is displayed in the lower panel of Fig. 1. The com-bined scenario S5 shows an increased fuel consumption over tropical flight routes, but also over the North Atlantic and North Pacific. In the tropics (20◦N–20◦S) the fuel con-sumption in S5 is 6.3 Tg/yr (7.4%) higher than in S4. Over the North Atlantic and North Pacific the increase in fuel consumption amounts to 20 Tg/yr (10.8%) and 11.5 Tg/yr (8.1%), respectively. Over the North Atlantic the increase in fuel consumption is accompanied by a reduction in fuel consumption to the north of this region. A similar pattern is found over the North Pacific. These geographical differences are related to the fact that an individual set of flight routes was defined for each supersonic configuration.
Figure 2 shows the horizontally integrated fuel consump-tion of the subsonic fleet in 2050 (a, scenario S4). The max-imum fuel consumption occurs in the northern mid-latitudes between 10 and 12 km altitude. In order to illustrate the
0 2 4 6 8 10 12 14 16 18 20 Altitude [km] -90˚ -75˚ -60˚ -45˚ -30˚ -15˚ 0˚ 15˚ 30˚ 45˚ 60˚ 75˚ 90˚ Latitude 0.5 1 5 10 50 100 200 500 1000 2000 [10-9 kg s-1 m-2] (a) 0 2 4 6 8 10 12 14 16 18 20 Altitude [km] -90˚ -75˚ -60˚ -45˚ -30˚ -15˚ 0˚ 15˚ 30˚ 45˚ 60˚ 75˚ 90˚ Latitude -500 -400 -300 -200 -100 -1 1 100 200 300 400 500 [10-9 kg s-1 m-2] (b) 0 2 4 6 8 10 12 14 16 18 20 Altitude [km] -90˚ -75˚ -60˚ -45˚ -30˚ -15˚ 0˚ 15˚ 30˚ 45˚ 60˚ 75˚ 90˚ Latitude -500 -400 -300 -200 -100 -1 1 100 200 300 400 500 [10-9 kg s-1 m-2] (c)
Fig. 2. Horizontally integrated fuel consumption [10−9kg s−1m−2]of commercial aircraft considered in the SCENIC subsonic fleet for 2050 (a). Difference between the 2050 mixed and subsonic fleet S5-S4 (b) and between the mixed fleet scenarios P4-S5 (c). The black line indicates a zonal and annual mean tropopause height.
replacement of parts of the subsonic fleet by supersonic air-craft, the difference between the 2050 mixed and subsonic fleet (S5–S4) is displayed in Fig. 2b. The main flight levels of the supersonic fleet are between 18 and 20 km, i.e. above the tropopause. Additionally, the replacement of subsonic by supersonic aircraft leads to a slight increase in fuel consump-tion at subsonic flight levels (around 9 km and 12 km, respec-tively; Fig. 2b) which is caused by supersonics flying in sub-sonic mode over land in order to avoid sub-sonic boom. The increase in fuel consumption below 8 km, i.e. during climb, is related to a higher MTOW (maximum take-off weight) of the supersonic aircraft compared to the subsonic aircraft. The lower supersonic cruise speed of 1.6 Mach instead of 2.0 Mach in the perturbation scenario P4 results in a re-duction of the main cruise altitude of approximately 2 km compared to the base-case mixed scenario S5 (Fig. 2c). It should be mentioned that the emission datasets are based on detailed market forecasts and technical realizations. Further-more, all scenarios are optimised in terms of economical vi-ability, i.e. supersonic routes differ between S5 and P4.
3 Results
In order to estimate the impact of a future fleet of super-sonic aircraft we analyse the differences in contrail cover (Sect. 3.1) and radiative forcing (Sect. 3.2) between the sub-sonic and the combined fleet. The pattern of differences is similar for both years 2025 and 2050, but more pronounced for 2050 since more supersonic aircraft will be in-service. Unless mentioned otherwise, the results shown refer to the year 2050.
3.1 Contrail cover
The contrail cover in the GCM is determined as fractional area covered with contrails within each model grid box. Un-less mentioned otherwise, the shown contrail coverage con-siders both visible and subvisible contrails. Contrails are re-garded as “subvisible” if their optical depth is smaller than 0.02 or if they are disguised by natural cirrus clouds (Ponater et al., 2002). The total contrail cover is calculated by vertical
160˚W120˚W 80˚W 40˚W 0˚ 40˚E 80˚E 120˚E 160˚E 60˚S 30˚S 0˚ 30˚N 60˚N 0.001 0.002 0.005 0.01 0.02 0.05 0.1 0.2 0.5 1 2 5 [%]
160˚W120˚W 80˚W 40˚W 0˚ 40˚E 80˚E 120˚E 160˚E 60˚S 30˚S 0˚ 30˚N 60˚N -3 -1 -0.3 -0.1 -0.03 -0.01 0.01 0.03 0.1 0.3 1 3 [%]
Fig. 3. Annually averaged total contrail cover [%] for the subsonic fleet S4 as simulated by ECHAM4 (left), and differences in total contrail cover [%] between S5 and S4 (right). The displayed differences are significant at the 95% level (t-test).
summation using the principle of maximum-random overlap (e.g. Geleyn and Hollingsworth, 1978).
The left panel of Fig. 3 presents the annual mean geo-graphical distribution of the total contrail cover simulated for the subsonic scenario S4. The total contrail cover shows distinct maxima over the North Atlantic, the North Pacific, the eastern USA, Europe and Japan/East Asia. This struc-ture directly reflects the main flight routes (Fig. 1). Typical mean values within the region of high air traffic density are in the range from 0.5% up to more than 5% (over the USA and Europe). The total contrail cover exhibits some seasonal variations (not shown) which are directly related to seasonal variations of atmospheric conditions, since the air traffic in-ventories do not consider any seasonal cycle. Over the USA, Europe and in tropical regions the total contrail coverage is higher in winter than in summer. In contrast, the contrail cover over the North Atlantic and North Pacific shows a max-imum in summer.
The mixed fleet scenario S5 reveals an increase in total contrail cover over tropical regions (right panel of Fig. 3). The strongest increase is found over Southeast Asia with values up to 0.8%. This pattern of difference directly re-flects the different flight patterns (Fig. 1) of the subsonic and the combined fleet. Except for central Europe and the USA the model results indicate a strong reduction in total contrail cover over the northern extratropics, most pronounced over the North Atlantic. The increase over USA and Europe is caused by supersonic aircraft flying in subsonic mode over land to avoid sonic boom. As the cruise altitude of a su-personic aircraft flying in subsonic mode is about 9–10 km, which is below that of a subsonic aircraft (Fig. 2), slight dif-ferences in contrail occurrence result over land. In contrast, the model results indicate a reduced total contrail cover over the North Atlantic and North Pacific despite an enhanced fuel consumption, because the meteorological conditions at su-personic flight levels are less favourable for contrail forma-tion than at subsonic flight levels. The changes in total con-trail coverage between the two mixed scenarios S5 and P4 are only marginal and therefore not shown.
The zonal mean contrail coverage is presented in Fig. 4 for January and July. For the subsonic scenario S4 the zonal mean contrail cover peaks in northern mid-latitudes at typ-ical flight levels around 200 hPa, i.e. near the zonal mean tropopause. The contrail cover in northern mid-latitudes ex-hibits a distinct annual cycle (Ponater et al., 2002; Meyer et al., 2002; Palikonda et al., 2005): In summer the middle troposphere is often too warm for the formation of contrails, whereas in winter contrails can also form below 300 hPa. The model results for the mixed fleet scenario S5 indicate a sim-ilar pattern at subsonic cruise levels as S4, but additionally a small amount of contrails in the tropics at supersonic cruise levels around 70 hPa. In the northern extratropical strato-sphere above approximately 100 hPa atmospheric conditions are favourable for contrail formation only in winter.
For a detailed inspection the differences in contrail cover between S5 and S4 are displayed in Fig. 5. The depicted differences are statistically significant at the 95% level (t-test). The combined scenario S5 shows a reduced contrail coverage at subsonic cruise levels (200 hPa), especially in northern mid-latitudes with values up to 0.03%. A slight reduction at subsonic cruise levels is also found in tropical regions. Furthermore, the model results for S5 reveal ad-ditional formation of contrails in the lower stratosphere at supersonic cruise levels, with a maximum contrail cover of 0.03% in tropical regions in winter. In summer there is no contrail formation recognisable at supersonic cruise levels in the northern extratropics. Additionally, S5 shows slightly en-hanced contrail cover in northern mid-latitudes at subsonic flight levels which is caused by supersonic aircraft flying in subsonic mode over land. The replacement of subsonic air-craft by supersonic airair-craft leads to a vertical and geograph-ical displacement in contrail coverage.
The reduced cruise speed of Mach 1.6 in the perturba-tion scenario P4 results in lower supersonic cruise levels (Fig. 2) which directly affects the vertical distribution of sim-ulated contrails. In P4 contrails in the tropical lower strato-sphere form at lower altitudes than in S5, around the trop-ical tropopause. At subsonic cruise levels P4 shows small
1000 700 500 300 200 10070 50 30 20 10 90˚S 60˚S 30˚S Eq 30˚N 60˚N 90˚N Pressure [hPa] 90˚S 60˚S 30˚S Eq 30˚N 60˚N 90˚N S4 Jan 1000 700 500 300 200 10070 50 30 20 10 90˚S 60˚S 30˚S Eq 30˚N 60˚N 90˚N Pressure [hPa] 90˚S 60˚S 30˚S Eq 30˚N 60˚N 90˚N S4 Jul 1000 700 500 300 200 10070 50 30 20 10 90˚S 60˚S 30˚S Eq 30˚N 60˚N 90˚N Pressure [hPa] 90˚S 60˚S 30˚S Eq 30˚N 60˚N 90˚N S5 1000 700 500 300 200 10070 50 30 20 10 90˚S 60˚S 30˚S Eq 30˚N 60˚N 90˚N Pressure [hPa] 90˚S 60˚S 30˚S Eq 30˚N 60˚N 90˚N 0.001 0.002 0.005 0.01 0.02 0.05 0.1 0.2 0.5 1 2 5 [%] S5
Fig. 4. Zonally averaged contrail cover [%] for the subsonic fleet S4 and the mixed fleet S5 as simulated by ECHAM4 for January (left) and July (right), respectively. The bold line indicates a zonal mean tropopause as simulated by ECHAM4 for each respective month.
Jan Jul 1000 700 500 300 200 10070 50 30 20 10 90˚S 60˚S 30˚S Eq 30˚N 60˚N 90˚N Pressure [hPa] 90˚S 60˚S 30˚S Eq 30˚N 60˚N 90˚N S5-S4 1000 700 500 300 200 10070 50 30 20 10 90˚S 60˚S 30˚S Eq 30˚N 60˚N 90˚N Pressure [hPa] 90˚S 60˚S 30˚S Eq 30˚N 60˚N 90˚N S5-S4 1000 700 500 300 200 10070 50 30 20 10 90˚S 60˚S 30˚S Eq 30˚N 60˚N 90˚N Pressure [hPa] 90˚S 60˚S 30˚S Eq 30˚N 60˚N 90˚N P4-S5 1000 700 500 300 200 10070 50 30 20 10 90˚S 60˚S 30˚S Eq 30˚N 60˚N 90˚N Pressure [hPa] 90˚S 60˚S 30˚S Eq 30˚N 60˚N 90˚N P4-S5 -3 -1 -0.3 -0.1 -0.03 -0.01 0.01 0.03 0.1 0.3 1 3 [0.1 %]
Fig. 5. Changes in the zonal mean contrail cover [0.1%] between S5 and S4 and between P4 and S5 for January (left) and July (right), respectively. The displayed differences are significant at the 95% level (t-test). The bold line indicates a zonal mean tropopause as simulated by ECHAM4 for each respective month.
modifications compared to S5 which are caused by slightly different flight routes. Generally, the changes in contrail
cov-erage between the subsonic and the mixed fleets directly re-flect the altered flight routes, taking into account the ambient
0 10 20 30 40 50 60 70 80 90 100 accumulated frequency [%] 0.0001 0.0010.001 0.01 0.1 1 optical depth tropics, 70hPa mid-lats, 200hPa
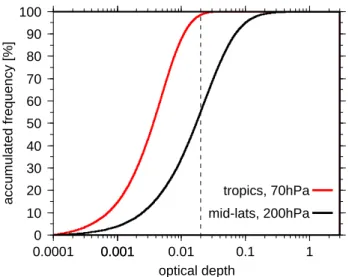
Fig. 6. Frequency distribution of the contrail optical depth as sim-ulated by ECHAM4 for the 2050 mixed fleet scenario S5 and for different geographical regions. Red: tropical lower stratosphere (20◦N–20◦S, 70 hPa), black: northern extratropical upper tropo-sphere (70◦N–40◦N, 200 hPa). The threshold optical depth of 0.02 is indicated by the vertical dashed line.
meteorological conditions of the respective atmospheric re-gion.
Table 2 summarises the annual mean total contrail cover for different geographical regions and the three
scenar-ios S4, S5 and P4. The global mean value for visible
contrails amounts to 0.372% for the subsonic scenario S4 which is significantly higher than the respective value of 0.22% for the 2050 NASA subsonic air traffic inventory (National Aeronautics and Space Administration (NASA) inventories, scenario FESGa; IPCC, 1999) as calculated by Marquart et al. (2003). This difference is related to the different design of the air traffic inventories: For the SCENIC inventory a 30% higher traffic demand has been assumed. Differences in the underlying aircraft technol-ogy are highlighted by the mean NOxemission index which
amounts to 10.85 g(NOx)/kg(fuel) in the SCENIC scenario
and 15.2 g(NOx)/kg(fuel) in the NASA inventory. The
cor-responding fuel consumption in the SCENIC dataset is ap-proximately a factor of 1.4 larger than in the NASA inven-tory (see Table 3 and Fig. 7). Furthermore, the geographical distribution of the flight routes differs between both datasets: In the SCENIC dataset the maximum fuel consumption oc-curs between 11 and 12 km altitude (Fig. 2a), in the NASA inventory between 10 and 11 km. As shown in Fichter et al. (2005) the global mean contrail coverage decreases with a downshift in cruise altitude.
On global average and in extratropical regions (Europe, NAFC) except USA the combined scenarios S5 and P4 re-veal a slight reduction in contrail coverage with a more pro-nounced decrease of visible contrails. For example, the
0 5 10 15 20 25 30 35 40 45 CC (0.01%) / RF (mW/m 2) 0 100 200 300 400 500 600 700 800 Fuel (Tg/yr) 1992 2015 2025 2050 2050 Contrail Cover Radiative Forcing
Fig. 7. Global mean contrail coverage (squares, [0.01%]) and net radiative forcing (crosses, [mW m−2]) as a function of fuel con-sumption [Tg yr−1] for different air traffic inventories. The blue symbols indicate the results from Marquart et al. (2003) for the years 1992, 2015 and 2050. The red symbols mark the results for the SCENIC datasets for the years 2025 and 2050, both for the sub-sonic scenarios (S1 and S4) and the mixed scenarios (S2 and S5, black framed). The black lines show the linear regressions for RF (solid) and contrail cover (dashed), respectively.
global mean contrail coverage in S5 decreases by a factor of 0.984 in terms of visible contrails, but only by a factor of 0.997 in terms of all contrails (visible+subvisible). Over USA supersonic aircraft have to fly in subsonic mode. How-ever, the shift in flight routes over USA between the sub-sonic and the mixed fleet (Fig. 1) does not affect the mean total contrail cover. In tropical regions the mixed fleet sce-narios show a different effect, i.e. an increase in terms of all contrails with an almost constant amount of visible contrails. Generally the model results indicate that the decrease in con-trail coverage in northern extratropics caused by the replace-ment of subsonic aircraft by supersonic aircraft is mainly re-lated to a decrease of visible contrails, whereas the increase in contrail coverage in the tropical stratosphere is associated with an increase in subvisible contrails.
3.2 Radiative forcing
In this section we present the contrail radiative forcing (RF) for the different air traffic inventories. For the RF calcula-tions all contrails (not only the visible contrails) are con-sidered. However, contrails with an optical depth of less than 0.02 are expected to have a negligible impact on radi-ation (less than 8%, Marquart et al., 2003). The following RF values refer to the stratosphere-adjusted radiative forc-ing at the tropopause, which is regarded to be a better met-ric of climate impact than the instantaneous RF at the top of the atmosphere, as used in, e.g. Minnis et al. (1999). We note that determining the contrail RF at the tropopause has
Table 2. Annually averaged total contrail cover (%) for different scenarios and different regions. Values in parentheses refer to “visible” contrails. Western Europe: 40◦–55◦N, 10◦W–20◦E; USA: 28◦–54◦N, 128◦–67◦W; North Atlantic Flight Corridor (NAFC): 28◦–72◦N, 83◦W–15◦E; North Pacific Flight Corridor (NPFC): 20◦–72◦N, 120◦E–120◦W; Thailand: 0◦–25◦N, 90◦–122◦E.
Scenario World Western Europe USA NAFC NPFC Thailand
S4-Sub 0.610 (0.372) 11.84 (6.25) 3.62 (2.66) 3.10 (1.87) 0.83 (0.49) 1.22 (0.84) S5-Mixed 0.608 (0.366) 11.80 (6.22) 3.62 (2.66) 3.01 (1.82) 0.82 (0.48) 1.31 (0.83) P4-Speed 0.606 (0.365) 11.80 (6.22) 3.61 (2.65) 3.02 (1.82) 0.81 (0.48) 1.27 (0.84)
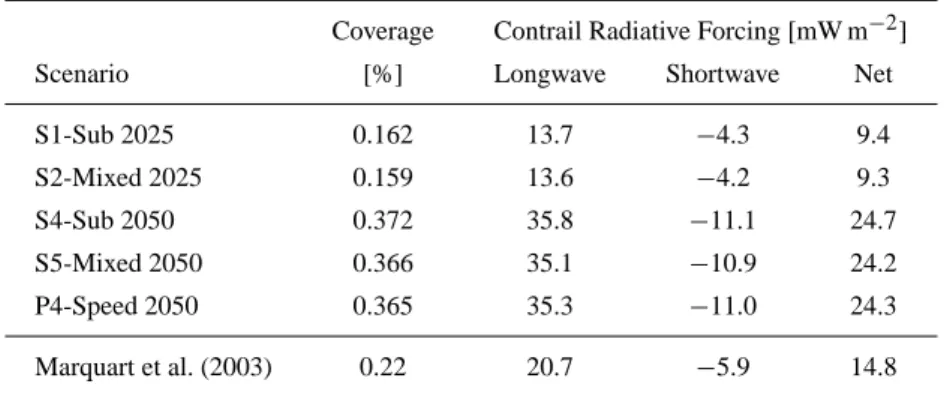
Table 3. Annually and globally averaged total contrail coverage (visible) and contrail radiative forcing components for the different air traffic inventories. The contrail RF applies to line-shaped contrails only. The respective values for 2050 from a study of Marquart et al. (2003) are listed for comparison.
Coverage Contrail Radiative Forcing [mW m−2]
Scenario [%] Longwave Shortwave Net
S1-Sub 2025 0.162 13.7 −4.3 9.4 S2-Mixed 2025 0.159 13.6 −4.2 9.3 S4-Sub 2050 0.372 35.8 −11.1 24.7 S5-Mixed 2050 0.366 35.1 −10.9 24.2 P4-Speed 2050 0.365 35.3 −11.0 24.3 Marquart et al. (2003) 0.22 20.7 −5.9 14.8
conceptual consequences for the shortwave part of the forc-ing: Shortwave absorption contributes positively in case of tropospheric contrails, but negatively in case of stratospheric contrails, because in the former case the absorbed radiation is gained by the troposphere-surface-system. Scattering of con-trails contributes negatively in either case, however. As we shall see, this feature is not relevant for our results as short-wave absorption by contrails is negligible in comparison to shortwave scattering.
In Table 3 the global annual mean radiative forcing com-ponents from contrails are listed for the different air traffic scenarios, along with the total contrail cover. Furthermore, the respective RF values for a 2050 NASA air traffic scenario taken from Marquart et al. (2003) are added for comparison. Considering the changes in air traffic density and climate (in-crease in greenhouse gas concentrations, change in sea sur-face temperatures) between 2025 and 2050, the contrail net RF for a subsonic fleet increases from 9.4 mW m−2in 2025
(S1) to 24.7 mW m−2in 2050 (S4). The mixed fleet scenarios
indicate a slightly smaller contrail net RF of 9.3 mW m−2in 2025 (S2) and 24.2 mW m−2in 2050 (S5), respectively. This means a reduction in net RF for the mixed fleet compared to the subsonic fleet by approximately 2% in 2050, based on the assumption of constant RPK (Table 1). The displayed chances in net RF between the subsonic and mixed fleet sce-narios are statistically significant at the 90% level.
The radiative impact of contrails does not only depend on coverage, but also on their optical properties. Ponater et al. (2002) and Marquart et al. (2003) found that the op-tical depth of contrails increases with decreasing altitude, from the poles towards the equator, and from winter to sum-mer. However, they analysed upper tropospheric contrails exclusively, whose properties are not necessarily valid for the lower stratosphere. Figure 6 extends the analysis presented in Marquart et al. (2003, their Fig. 7) by showing the accu-mulated frequency distributions of the optical depth for con-trails in the tropical lower stratosphere (red line) and in the northern extratropical upper troposphere (black line). The frequency distributions are based on semi-daily values of the model simulation S5 including all years of the simulation. The distribution functions for both regions show remarkable differences: Contrails in the tropical lower stratosphere are optically thinner than contrails in the upper troposphere in northern extratropics. The main fraction of these optically thin contrails in the tropical lower stratosphere are below the threshold optical depth of 0.02, i.e. they are regarded as sub-visible in the model simulations. Atmospheric conditions in the tropical lower stratosphere are significantly drier than in the upper troposphere, i.e. less atmospheric water vapour is available for condensation, which leads to a reduced ice water content within contrails and therefore a reduced opti-cal depth. The change in optiopti-cal properties of contrails in
combination with the change in total contrail cover explains the reduced net RF in the mixed fleet scenario S5 compared to the subsonic scenario S4.
A direct comparison of the present results with previous studies is difficult since the simulated contrails strongly de-pend on the air traffic distribution. Marquart et al. (2003) as-sessed the future development of contrails for a subsonic fleet with the GCM ECHAM4. Their results for 2050 are listed in Table 3. The fuel consumption for the S4 scenario is approx-imately a factor of 1.4 higher than in Marquart et al. (2003). In contrast to Marquart et al. (2003) who used the fuel con-sumption as a weighting factor to calculate the contrail cov-erage, the flown distance was used in the present study which reduces global contrail cover and RF by about 10% (Fichter et al., 2005). This would imply a reduced contrail cover and RF for S4 compared to Marquart et al. (2003). However, the simulated contrail cover and contrail net RF for S4 are a factor of ≈1.7 higher, i.e. the S4 scenario shows a higher contrail coverage per fuel consumption. Part of this devia-tion can be explained by differences in the vertical distribu-tion of air traffic density with the NASA inventory showing the maximum fuel consumption at lower altitudes compared to S4. Fichter et al. (2005) have shown that a downshift in flight altitude by 2000 ft (610 m) results in a decrease in the global mean contrail coverage of 13%. Nevertheless, both studies show a close correlation between global mean con-trail cover and net RF. Taking into account all available re-sults for different years and air traffic scenarios (subsonic and combined fleets) from the present study and from Marquart et al. (2003) the mean contrail net RF per contrail coverage amounts to 63.8±5.7 mW m−2/1%. This value is calculated
from the global mean contrail net RF divided by the global mean total contrail coverage, averaged over all air traffic sce-narios depicted in Fig. 7.
In addition to the contrail net RF of a subsonic fleet IPCC (1999) provided an estimate of 67 mW m−2and 89 mW m−2 for the net contrail RF of the combined fleet scenario Fa1H in 2025 and 2050, respectively. The Fa1H scenario assumes that supersonic aircraft come into service in 2015 with a fi-nal capacity of 1000 aircraft in 2040, continuing operation to 2050 (11% of the subsonic fleet Fa1 in 2050). This super-sonic aircraft cruises with Mach 2.4 at 18–20 km altitude. The combined fleet Fa1H has a total fuel consumption of 557.4 Tg yr−1in 2050 (supersonic part 140 Tg yr−1). How-ever, in IPCC (1999) it was assumed that persistent contrails in the stratosphere are unlikely because of the low humidity values, and, therefore, radiative forcing from contrails from a future fleet of supersonic aircraft can be neglected. There-fore, the reduction in net contrail RF for the Fa1H scenario compared to the subsonic scenario Fa1 directly reflects the percentage of subsonic aircraft replaced by supersonic air-craft, i.e. 11% less subsonic aircraft results in 11% less con-trail RF in 2050.
The assumption made in IPCC (1999) that contrails from supersonic aircraft may be neglected disagrees with the
find-ings of the present study. The replacement of approximately 4% of the subsonic fleet by supersonic aircraft (scenario S5) in terms of the number of transported passengers (RPK) re-sults in a reduction in global mean contrail cover (visible contrails) from 0.372% to 0.366% (Table 3) and a reduced net contrail RF of approximately 2%, respectively. Our study indicates that supersonic aircraft do not completely avoid contrails and contrail radiative forcing.
4 Discussion
When assessing the impact of supersonic aircraft on con-trails by means of GCM simulations the question arises how suitable the applied model tool is for this kind of study. In particular, systematic model biases in the simulated temper-ature and humidity distribution may affect simulated con-trails. The ECHAM4 GCM like many other GCMs (e.g. Gates et al., 1999) exhibits a serious “cold bias” in the ex-tratropical lowermost stratosphere with a maximum temper-ature deviation of about 10 K at the 200 hPa level (Roeckner et al., 1996; Land et al., 1999), i.e. the altitude range where contrails generally form. Furthermore, the model shows a severe “wet bias” in the extratropical lowermost stratosphere (Stenke et al., 2007). Above 100 hPa water vapour concentra-tions are still overestimated by a factor of approximately 1.5 compared to observations (Stenke and Grewe, 2005). Mar-quart et al. (2003) quantified the impact of model biases on the simulation of contrails by offline diagnostic calculations using ECMWF reanalysis (ERA) and ECHAM4 temperature and humidity data as meteorological input. They found that the contrail cover in the northern extratropics is only slightly affected by the cold bias, but is very sensitive to the bias in relative humidity. In contrast, in tropical regions the temper-ature bias is more important for contrail formation than the model errors in the humidity distribution.
In a recent study Stenke et al. (2007) showed that the sim-ulated wet bias in the extratropical lowermost stratosphere is caused by the exceptionally high numerical diffusion of the operational semi-Lagrangian advection scheme. Replacing the semi-Lagrangian scheme by the pure Lagrangian trans-port scheme ATTILA (Reithmeier and Sausen, 2002) results in a significant reduction of the simulated wet bias and, as a consequence, of the simulated cold bias, too. In the follow-ing, the updated model version using the Lagrangian trans-port scheme ATTILA is referred to as E39/ATTILA. In or-der to study the influence of the above mentioned model bi-ases on the formation of contrails in a self-consistent model framework, we additionally performed the model simula-tions S4 (subsonic) and S5 (mixed) with the “unbiased” model version E39/ATTILA. Preliminary results of sensitiv-ity simulations show some remarkable differences between the standard model and E39/ATTILA in terms of contrail coverage and optical properties of contrails. In the present study, the main focus is on the effect of the replacement of
subsonic aircraft by supersonic aircraft. A detailed analysis of the properties of tropospheric contrails in the model ver-sion E39/ATTILA compared to the standard model will not be presented here.
Changes in the zonal mean contrail cover between S5 and S4 for January as simulated with E39/ATTILA are displayed in Fig. 8 for comparison with the standard model E39 (see Fig. 5). E39/ATTILA shows a similar pattern as E39: The mixed scenario S5 indicates a reduced contrail cover at sub-sonic cruise levels which is most pronounced in the northern extratropics, and an increase in contrail cover in the tropical lower stratosphere. Furthermore, E39/ATTILA also shows a slight increase in contrail cover at subsonic cruise levels around 40◦N to 50◦N. Compared to E39, E39/ATTILA does not show contrail occurrence in northern mid-latitudes at su-personic flight levels (≈70 hPa) and the increase in tropi-cal lower stratospheric contrail cover is less pronounced. In E39/ATTILA stratospheric water vapour concentrations are significantly lower than in E39 (Stenke et al., 2007) which results in lower relative humidity. Therefore, meteorological conditions in the tropical lower stratosphere are less suitable for contrail formation in E39/ATTILA. For July, the model version E39/ATTILA again shows a similar difference pat-tern as the standard model E39, but with a slightly weaker maximum in the tropical lower stratosphere (not shown). Compared to the basecase scenario S4 the annual global mean contrail coverage in S5 is reduced by a factor of 0.984 in terms of visible contrails and by a factor of 0.992 in terms of all contrails. These values are in very good agreement with the results of the standard model E39 (Sect. 3.1). This indicates that model biases in the simulated temperature and humidity distribution of the standard model E39 do not affect the main result of this study that the replacement of subsonic aircraft by supersonic aircraft leads to a geographical shift in contrail cover from the northern extratropical subsonic flight levels into the tropical lower stratosphere.
5 Conclusions
The impact of future supersonic aircraft on contrail cover and radiative forcing was investigated by means of model simu-lations with the ECHAM4 GCM including the contrail pa-rameterization by Ponater et al. (2002) with modifications by Marquart and Mayer (2002). This model approach allowed us to simulate contrail coverage, optical properties and ra-diative forcing of contrails in a consistent way with a com-prehensive climate model. The effect of supersonic aircraft was evaluated using SCENIC air traffic inventories for sub-sonic and mixed (sub- and supersub-sonic) fleets for the years 2025 and 2050, respectively (Rogers et al., 20071). In the case of a mixed fleet, subsonic aircraft are replaced by su-personic aircraft. For the SCENIC studies it was considered that the introduction of supersonic aircraft would not increase the global air traffic demand, i.e. that the number of revenue
Pressure [hPa] 1000 700 500 300 200 100 70 50 30 20 10 90˚S 60˚S 30˚S Eq 30˚N 60˚N 90˚N 90˚S 60˚S 30˚S Eq 30˚N 60˚N 90˚N -3.00 -1.00 -0.30 -0.10 -0.03 -0.01 0.01 0.03 0.10 0.30 1.00 3.00 [0.1%]
Fig. 8. Changes in the zonally averaged contrail cover [0.1%] be-tween S5 and S4 as simulated by E39/ATTILA for January. The bold line indicates a zonal mean tropopause. The displayed differ-ences are significant at the 95% level (t-test).
passenger kilometres (RPK) is constant in all scenarios for a given year. This assumption was made in order to provide comparability of the different scenarios. Supersonic air traf-fic and travel demand will depend strongly on the benefits that passengers and industry could obtain. This includes pa-rameters like time saved, ticket price, direct operating costs or aircraft viability. For the SCENIC scenarios a medium demand was assumed where the supersonic market cannot exceed 30% on each route.
The replacement of subsonic aircraft by supersonic aircraft does not avoid contrails in terms of global mean total contrail cover, but it leads to a shift in the geographical distribution of contrails: Fewer contrails in the northern extratropics at subsonic flight levels which is a direct effect of the replace-ment of subsonic aircraft, and increasing contrail coverage in the tropical lower stratosphere, i.e. at supersonic cruise lev-els. This geographical and vertical shift leads to a reduced total contrail cover over Europe, the North Atlantic as well as the North Pacific, and to an increased total contrail cover over Thailand.
Contrails in the tropical lower stratosphere are optically thinner than those in the extratropical upper troposphere. This forms an extension to previous results of Marquart et al. (2003) that the optical depth of subsonic contrails decreases with height. Optically thinner contrails have a reduced net radiative forcing. The contrail net RF in the mixed fleet scenario S5 is approximately 2% (1.6%) lower than in the subsonic fleet scenario S4, relating to a constant number of passenger kilometres (RPK) and a replacement of 4% of the RPK by supersonic aircraft. Reducing the supersonic cruise speed from Mach 2.0 to Mach 1.6 leads to a lower supersonic cruise altitude and therefore a vertical shift in contrail forma-tion. However, the global mean total contrail cover and the radiative impact of supersonic contrails are not affected.
The findings of the present study are in disagreement with the assumption made in IPCC (1999) that contrail RF from supersonic aircraft may be neglected. In the IPCC report per-sistent contrails in the stratosphere were considered to be un-likely because of the low ambient relative humidity. This as-sumption may hold for extratropical regions, but not for the tropical stratosphere.
The results of this study might suggest that supersonic aircraft have a smaller climate impact than subsonic air-craft. However, changes in contrail cover and contrail RF are only one aspect in terms of investigating the climate impact of future supersonic air traffic. Aircraft emissions cover a range of gases and particulate matter, like carbon dioxide (CO2), water vapour (H2O), nitrogen oxides (NOx)
and sulphate aerosols. Compared to the other variables con-trails (−0.5 mW m−2) are a minor contributor to climate
change with respect to supersonic aircraft. The total radia-tive forcing from supersonic aircraft (S5–S4) except con-trails amounts to 22 mW m−2 in 2050, with a contribution of 23 mW m−2from water vapour, 3.3 mW m−2from carbon dioxide, −2.8 mW m−2and −1.6 mW m−2from ozone and methane (Grewe et al., 2007). For supersonic transport most RF contributions show a different behaviour than for sub-sonic transport. In the subsub-sonic case water vapour emissions are negligible, while in the supersonic case stratospheric wa-ter vapour emissions make by far the most important contri-bution to climate change. NOxemissions from subsonic air
traffic lead to a positive RF from ozone changes and a nega-tive RF from methane changes, resulting in a posinega-tive net RF. In the supersonic case, however, also the ozone changes lead to a negative RF, since NOx emissions in the stratosphere
cause an enhanced ozone destruction and the ozone produc-tion via NO2photolysis becomes less important at higher
al-titudes. A direct intercomparison of the climate impact of a subsonic and supersonic aircraft can be found in Grewe and Stenke (2007). This comparison shows that many aspects have to be considered when evaluating the climate impact of future air traffic.
The simulation of contrails with a GCM like ECHAM4 is highly sensitive to systematic model errors in the back-ground temperature and humidity distribution. Uncertainties of the model results for present day and future subsonic fleets have been discussed in Ponater et al. (2002) and Marquart et al. (2003). For the current study it was important to know whether the effect of the replacement of subsonic by super-sonic aircraft is captured correctly. Sensitivity studies with an updated model version E39/ATTILA suggest that the per-sistent model biases in terms of temperature and humidity in the standard model version E39 slightly affect the magnitude, but not the pattern of change itself. Reducing the quantitative uncertainty of the model results requires further evaluation of the simulated contrail properties for the updated model E39/ATTILA by means of detailed comparison with obser-vations.
Acknowledgements. We would like to thank our colleagues
C. Fichter and M. Ponater for their constructive suggestions on this manuscript and many helpful discussions. This study was funded by the European Commission through the SCENIC project under the 5th Framework Programme and through the European FP6 Network of Excellence ECATS. The model simulations have been performed on the NEC SX-6 high performance com-puter of the German Climate Computing Centre (DKRZ), Hamburg.
Edited by: W. Collins
References
Aboulafia, R.: Teal group business aviation overview: Part two, World Aircraft Sales Magazine, Sep 07, 100–114, 2007, http: //www.avbuyer.com/worldaircraftsales/, 2007.
Appleman, H.: The formation of exhaust condensation trails by jet aircraft, B. Am. Meteor. Soc., 34, 14–20, 1953.
Fichter, C., Marquart, S., Sausen, R., and Lee, D.: The impact of cruise altitude on contrails and related radiative forcing, Meteo-rol. Z., pp. 563–572, 2005.
Gates, W. L., Boyle, J. S., Covey, C., Dease, C. G., Doutriaux, C. M., Drach, R. S., Fiorino, M., Glecker, P. J., Hnilo, J. J., Mar-lais, S. M., Phillips, T. J., Potter, G. L., Santer, B. D., Sperber, K. R., Taylor, K. E., and Williams, D. N.: An overview of the re-sults of the Atmospheric Model Intercomparison Project (AMIP I), B. Am. Meteor. Soc., 80, 29–55, 1999.
Geleyn, J. F. and Hollingsworth, A.: An economical analytical method for the computation of the interaction between scattering and line absorption of radiation, Beitr. Phys. Atmos., 52, 1–16, 1978.
Gierens, K., Sausen, R., and Schumann, U.: A diagnostic study of the global distribution of contrails. Part II: Future air traffic scenarios, Theor. Appl. Climatol., 63, 1–9, 1999.
Grewe, V. and Stenke, A.: A strategy for climate evaluation of air-craft technology: An efficient climate impact assessment tool – AirClim, Atmos. Chem. Phys. Discuss., 7, 12 185–12 229, 2007. Grewe, V., Stenke, A., Ponater, M., Sausen, R., Pitari, G., Iachetti, D., Rogers, H., Dessens, O., Pyle, J., Isaksen, I. S. A., Gulstad, L., Søvde, O. A., Marizy, C., and Pascuillo, E.: Climate impact of supersonic air traffic: An approach to optimize a potential future supersonic fleet – Results from the EU-project SCENIC, Atmos. Chem. Phys., 7, 5129–5145, 2007,
http://www.atmos-chem-phys.net/7/5129/2007/.
IPCC: Aviation and the global atmosphere, Intergovernmental Panel on Climate Change, Cambridge University Press, New York, USA, 1999.
IPCC: Climate Change 2001 – The scientific basis, Intergovernmen-tal Panel on Climate Change, Cambridge University Press, New York, USA, 2001.
IPCC: Climate Change 2007 – The physical science basis, Inter-governmental Panel on Climate Change, Cambridge University Press, New York, USA, 2007.
Land, C., Ponater, M., Sausen, R., and Roeckner, E.: The ECHAM4.L39(DLR) atmosphere GCM – Technical descrip-tion and model climatology, DLR Forschungsbericht 1999-31, ISSN 1434-8454, K¨oln, also available via http://www.pa.op.dlr. de/echam/L39.html, 1999.
Land, C., Feichter, J., and Sausen, R.: Impact of vertical resolution on the transport of passive tracers in the ECHAM4 model, Tellus (B), 54, 344–360, 2002.
Mannstein, H., Meyer, R., and Wendling, P.: Operational detection of contrails from NOAA-AVHRR-data, Int. J. Remote Sens., 20, 1641–1660, 1999.
Marquart, S. and Mayer, B.: Towards a reliable GCM estima-tion of contrail radiative forcing, Geophys. Res. Lett., 29, 1179, doi:10.1029/2001GL014075, 2002.
Marquart, S., Ponater, M., Mager, F., and Sausen, R.: Future Devel-opment of Contrails Cover, Optical Depth, and Radiative Forc-ing: Impacts of Increasing Air Traffic and Climate Change, J. Climate, 16, 2890–2904, 2003.
Meyer, R., Mannstein, H., Meerk¨otter, R., Schumann, U., and Wendling, P.: Regional radiative forcing by line-shaped con-trails derived from satellite data, J. Geophys. Res., 107, 4104, doi:10.1029/2001JD000426, 2002.
Meyer, R., Buell, R., Leiter, C., Mannstein, H., Pechtl, S., Oki, T., and Wendling, P.: Contrail observations over Southern and Eastern Asia in NOAA/AVHRR data and comparisons to con-trail simulations in a GCM, Int. J. Remote Sens., 28, 2049–2069, 2007.
Minnis, P., Young, D. F., Garber, D. P., Nguyen, L., Smith Jr., W. L., and Palikonda, R.: Transformation of contrails into cirrus during SUCCESS, Geophys. Res. Lett., 25, 1157–1160, 1998. Minnis, P., Schumann, U., Doelling, D. R., Gierens, K. M., and
Fahey, D. W.: Global distribution of contrail radiative forcing, Geophys. Res. Lett., 26, 1853–1856, 1999.
Minnis, P., Ayers, J. K., Palikonda, R., and Phan, D.: Contrails, cirrus trends, and climate, J. Climate, 17, 1671–1685, 2004. Palikonda, R., Minnis, P., Duda, D. P., and Mannstein, H.: Contrail
coverage derived from 2001 AVHRR data over the continental United States of America and surrounding areas, Meteorol. Z., 14, 525–536, 2005.
Ponater, M., Marquart, S., and Sausen, R.: Contrails in a comprehensive global climate model: Parameterisation and radiative forcing results, J. Geophys. Res., 107, 4164, doi:10.1029/2001JD000429, 2002.
R¨ais¨anen, P.: Effective longwave cloud fraction and maximum-random overlap of clouds: a problem and a solution, Mon. Weather Rev., 126, 3336–3340, 1998.
Rasch, P. J. and Williamson, D. L.: Computational aspects of mois-ture transport in global models of the atmosphere, Q. J. Roy. Me-teor. Soc., 116, 1071–1090, 1990.
Reithmeier, C. and Sausen, R.: ATTILA: atmospheric tracer trans-port in a Lagrangian model, Tellus, 54B, 278–299, 2002. Roeckner, E., Arpe, K., Bengtsson, L., Christoph, M., Claussen,
M., D¨umenil, L., Esch, M., Giorgetta, M., Schlese, U., and Schulzweida, U.: The atmospheric general circulation model ECHAM–4: Model description and simulation of present–day climate, Report No. 218, Max-Planck-Institut f¨ur Meteorologie, Hamburg, 1996.
Roeckner, E., Bengtson, L., Feichter, J., Lelieveld, J., and Rodhe, H.: Transient climate change simulations with a coupled atmosphere-ocean GCM including the tropospheric sulfur cycle, J. Climate, 12, 3004–3032, 1999.
Sausen, R., Isaksen, I., Grewe, V., Hauglustaine, D., Lee, D. S., Myhre, G., K¨ohler, M. O., Pitari, G., Schumann, U., Stordal, F., and Zerefos, C.: Aviation radiative forcing in 2000: An update on IPCC (1999), Meteorol. Z., 14, 555–561, 2005.
Schmidt, E.: Die Entstehung von Eisnebel aus den Auspuffgasen von Flugmotoren, in: Schriften der Deutschen Akademie der Luftfahrtforschung, edited by: Oldenbourg, R., vol. 44, pp. 1– 15, Munich, Germany, 1941.
Schumann, U.: On conditions for contrail formation from aircraft exhausts, Meteorol. Z., 5, 4–24, 1996.
Schumann, U. and Wendling, P.: Determination of contrails from satellite data and observational results, in: Air Traffic and the Environment - Background, Tendencies and Potential Global At-mospheric Effects, edited by: Schumann, U., Lecture Notes in Engineering No. 60, Springer-Verlag, Berlin, Heidelberg, ISBN 3-540-53352-4, 138–153, 1990.
Stenke, A. and Grewe, V.: Simulation of stratospheric water vapor trends: Impact on stratospheric ozone, Atmos. Chem. Phys., 5, 1257–1272, 2005,
http://www.atmos-chem-phys.net/5/1257/2005/.
Stenke, A., Grewe, V., and Ponater, M.: Lagrangian transport of water vapour and cloud water in the ECHAM4 GCM and its impact on the cold bias, Clim. Dynam., published online, doi:10.1007/s00382-007-0347-5, 2007.
Stordal, F., Myhre, G., Stordal, E. J. G., Rossow, W. B., Lee, D. S., Arlander, D. W., and Svendby, T.: Is there a trend in cirrus cloud cover due to air traffic?, Atmos. Chem. Phys., 5, 2155–2162, 2005,
http://www.atmos-chem-phys.net/5/2155/2005/.
Stuber, N. and Forster, P.: The impact of diurnal variations of air traffic on contrail radiative forcing, Atmos. Chem. Phys., 7, 3153–3162, 2007,
http://www.atmos-chem-phys.net/7/3153/2007/.
Stuber, N., Sausen, R., and Ponater, M.: Stratosphere adjusted ra-diative forcing calculations in a comprehensive climate model, Theor. Appl. Climatol., 68, 125–135, 2001.
Wiley, J.: The super-slow emergence of supersonic, Aviation Week, http://www.aviationweek.com, 7 September 2007.
Williamson, D. L. and Rasch, P. J.: Water vapor transport in the NCAR CCM2, Tellus (A), 46, 34–51, 1994.
Zerefos, C. S., Eleftheratos, K., Balis, D. S., Zanis, P., Tselioudis, G., and Meleti, D.: Evidence of impact of aviation on cirrus cloud formation, Atmos. Chem. Phys., 3, 1633–1644, 2003, http://www.atmos-chem-phys.net/3/1633/2003/.

![Fig. 2. Horizontally integrated fuel consumption [10 −9 kg s −1 m −2 ] of commercial aircraft considered in the SCENIC subsonic fleet for 2050 (a)](https://thumb-eu.123doks.com/thumbv2/123doknet/14775452.593476/6.892.159.742.90.602/horizontally-integrated-consumption-commercial-aircraft-considered-scenic-subsonic.webp)
![Fig. 3. Annually averaged total contrail cover [%] for the subsonic fleet S4 as simulated by ECHAM4 (left), and differences in total contrail cover [%] between S5 and S4 (right)](https://thumb-eu.123doks.com/thumbv2/123doknet/14775452.593476/7.892.150.741.95.297/annually-averaged-contrail-subsonic-simulated-echam-differences-contrail.webp)
![Fig. 4. Zonally averaged contrail cover [%] for the subsonic fleet S4 and the mixed fleet S5 as simulated by ECHAM4 for January (left) and July (right), respectively](https://thumb-eu.123doks.com/thumbv2/123doknet/14775452.593476/8.892.196.701.94.468/zonally-averaged-contrail-subsonic-simulated-echam-january-respectively.webp)
![Fig. 8. Changes in the zonally averaged contrail cover [0.1%] be- be-tween S5 and S4 as simulated by E39/ATTILA for January](https://thumb-eu.123doks.com/thumbv2/123doknet/14775452.593476/12.892.469.813.88.346/changes-zonally-averaged-contrail-cover-simulated-attila-january.webp)
