HAL Id: hal-00300841
https://hal.archives-ouvertes.fr/hal-00300841
Submitted on 12 Jun 2002HAL is a multi-disciplinary open access
archive for the deposit and dissemination of sci-entific research documents, whether they are pub-lished or not. The documents may come from teaching and research institutions in France or abroad, or from public or private research centers.
L’archive ouverte pluridisciplinaire HAL, est destinée au dépôt et à la diffusion de documents scientifiques de niveau recherche, publiés ou non, émanant des établissements d’enseignement et de recherche français ou étrangers, des laboratoires publics ou privés.
Twilight tropospheric and stratospheric
photodissociation rates derived from balloon borne
radiation measurements
A. Kylling, T. Danielsen, M. Blumthaler, J. Schreder, B. Johnsen
To cite this version:
A. Kylling, T. Danielsen, M. Blumthaler, J. Schreder, B. Johnsen. Twilight tropospheric and strato-spheric photodissociation rates derived from balloon borne radiation measurements. Atmostrato-spheric Chemistry and Physics Discussions, European Geosciences Union, 2002, 2 (3), pp.715-738. �hal-00300841�
ACPD
2, 715–738, 2002 Tropospheric and stratospheric photodissociation rates A. Kylling et al. Title Page Abstract Introduction Conclusions References Tables Figures J I J I Back CloseFull Screen / Esc
Print Version Interactive Discussion
Atmos. Chem. Phys. Discuss., 2, 715–738, 2002 www.atmos-chem-phys.org/acpd/2/715/
c
European Geophysical Society 2002
Atmospheric Chemistry and Physics Discussions
Twilight tropospheric and stratospheric
photodissociation rates derived from
balloon borne radiation measurements
A. Kylling1, T. Danielsen1, M. Blumthaler2, J. Schreder2, and B. Johnsen3
1
Norwegian Institute for Air Research, Kjeller, Norway
2
Institute of Medical Physics, University of Innsbruck, Innsbruck, Austria
3
Norwegian Radiation Protection Authority, Oslo, Norway
Received: 4 March 2002 – Accepted: 3 June 2002 – Published: 12 June 2002 Correspondence to: A. Kylling (arve.kylling@nilu.no)
ACPD
2, 715–738, 2002 Tropospheric and stratospheric photodissociation rates A. Kylling et al. Title Page Abstract Introduction Conclusions References Tables Figures J I J I Back CloseFull Screen / Esc
Print Version Interactive Discussion
c
EGS 2002
Abstract
A new ligthweight multichannel moderate bandwidth filter instrument designed to be flown on balloons, is described. The instrument measures the radiation field within the short UV (center wavelength at 312 nm) and long UV (center wavelength at 340 nm). The angular and spectral characteristics of the instrument are discussed and the
cali-5
bration procedure outlined. Measurements made during a stratospheric balloon flight at twilight conditions from Gap-Tallard, France, are presented and compared with state-of-the-art radiative transfer model simulations. The model simulations and the mea-surements agree within ±10% (±20%) for solar zenith angles smaller than 93◦ (90◦) for the 340 (312) nm channel. Based on the model simulations of the measured
ra-10
diation, actinic flux spectra are reconstructed. These are used to calculate various photodissociation rates.
1. Introduction
UV and visible radiation plays an important role for the photochemistry of the tropo-sphere and the stratotropo-sphere. In spite of this in situ measurements of the UV radiation
15
field in the troposphere and the stratosphere are relatively rare. Schiller et al.(1994) reported actinic flux measurements in the troposphere and stratosphere from a bal-loon platform. The instrument measured the actinic flux in a single wavelength interval, thus providing no spectral information. Recently airborne measurements have been made of the spectral actinic flux at selected altitudes using spectroradiometers, (see
20
e.g.McElroy,1995;McElroy et al.,1995;Shetter and M ¨uller,1999;Hofzumahaus et al.,
2001).Gao et al.(2001) derived the JNO
2 in the lower stratosphere for low sun using in
situ chemical measurements. FinallyB ¨osch et al. (2001) have reported comparisons of measured proxy JNO
2 with model simulations for large solar zenith angles in the
troposphere and stratosphere.
25
ACPD
2, 715–738, 2002 Tropospheric and stratospheric photodissociation rates A. Kylling et al. Title Page Abstract Introduction Conclusions References Tables Figures J I J I Back CloseFull Screen / Esc
Print Version Interactive Discussion
filter instrument, hereafter named NILU-CUBE, are reported. Measurements were made as the NILU-CUBE was flown on a balloon to an altitude of about 30 km. The measurements are compared with model simulations and subsequent data analysis yields various photodissociation rates.
2. Instrumentation
5
The NILU-CUBE is a twelve channel moderate bandwidth filter instrument. It consists of six heads mounted on the faces of a cube, see Fig.1. Each head measures the irra-diance in two channels. The channels are centered at approximately 312 and 340 nm and have a full width at half maximum (FWHM) of approximately 10 nm. In order to keep the weight and power consumption low, the instrument is not temperature
stabi-10
lized. However, the instrument is very well insulated and the temperature is recorded for each of the six heads. Data are recorded every five seconds and stored in a seper-ate logging unit.
During flight the NILU-CUBE is mounted such that one head faces upwards mea-suring the downwelling radiation. The opposite head measures the upwelling radiation
15
while the remaining four heads point towards the horizon. As the balloon ascends the payload will rotate, hence the signal measured by the four heads pointed towards the horizon will vary considerably.
To check the NILU-CUBE before and after flying a NILU-UV instrument was used. The NILU-UV is a six channel moderate bandwidth filter instrument. It measures the
20
total (direct plus diffuse) downward irradiance at approximately 305, 312, 320, 340, and 380 nm with a FWHM of 10 nm. In addition it has a channel covering photosyn-thetic active radiation (PAR) between 400–700 nm. The 312 and 340 nm channels are identical on the NILU-UV and the NILU-CUBE except for the shape of the teflon di ffu-sors on the respective instruments. The NILU-UV is temperature stabilized. It reported
25
data every second to a computer. In addition to being used to check the stability of the NILU-CUBE before and after flying, the NILU-UV was used during the flight to
moni-ACPD
2, 715–738, 2002 Tropospheric and stratospheric photodissociation rates A. Kylling et al. Title Page Abstract Introduction Conclusions References Tables Figures J I J I Back CloseFull Screen / Esc
Print Version Interactive Discussion
c
EGS 2002
tor the radiation field at the surface. The clocks of the NILU-CUBE and the NILU-UV where synchronized using Global Position System (GPS) receivers prior to the flight. 2.1. Angular response
The radiation quantity of interest for photochemical applications is the actinic flux F
(Madronich,1987) 5 F (λ)= Z φ Z θ I(λ, θ, φ) sin θd θd φ. (1)
Here I is the radiance in direction θ and φ at wavelength λ. The actinic flux represents the total number of photons incident at a point. Ideally an instrument for measurement of the actinic flux should have a relative angular response with unit response for all incoming directions, black line Fig.2. Each head of the NILU-CUBE has a relative
10
angular response similar to a cosine response, red line Fig.2. By combining the signals from each head the response is similar to the blue line Fig.2. Obviously if only the up- and downwelling irradiances are measured the radiation from the horizon is not accounted for. Combining the signal from all heads gives an angular response that overestimates the actinic flux. The magnitude of the overestimate will depend on the
15
behaviour of the radiation field which varies with wavelength, altitude, solar zenith angle and atmospheric composition. This is further discussed below when correcting for the non-ideal angular response of the instrument.
While the angular response of the instrument does not have a unit response for each incoming direction, it is important that each head has similar angular responses. This
20
was investigated in the laboratory by using a 1000 W lamp and rotary stage. In the left plot of Fig.3is shown the deviation from an ideal cosine response for each channel in each head for a given azimuth angle. The azimuth dependence was investigated for both channels in one head and is shown in the middle and right plot of Fig.3. While the angular response is not a perfect cosine response the similarity of the various heads
25
ACPD
2, 715–738, 2002 Tropospheric and stratospheric photodissociation rates A. Kylling et al. Title Page Abstract Introduction Conclusions References Tables Figures J I J I Back CloseFull Screen / Esc
Print Version Interactive Discussion
2.2. Calibration
The calibration procedure for moderate bandwidth filter instruments have been de-scribed byDahlback(1996). The current Ci measured by the instrument in channel i when illuminated by spectral irradiance F (λ) is
Ci = ki
Z∞ 0
Ri(λ)F (λ)d λ. (2)
5
Here Ri is the relative responsivity of the channel. The calibration factors ki for each channel are determined by comparing measurements F (λ) from a well characterized and high-quality spectroradiometer with simultaneous measurements Ci from the filter instrument
ki = R∞ Ci
0 Ri(λ)F (λ)d λ
. (3)
10
The relative spectral response of the NILU-CUBE was measured in the laboratory us-ing a 1000 W Xe-lamp, a light-intensity controller and a calibrated reference radiometer. The relative spectral response is shown in Fig.4. During the Photochemial Acticity and Solar Ultraviolet Radiation (ADMIRA) campaign in August 2000 at Nea Michaniona, Greece (Webb et al.,2002), the NILU-CUBE was colocated with a Bentham DTM300
15
scanning spectroradiometer. Following the procedure outlined above and detailed in
Dahlback(1996), calibration factors were calculated for one of the heads. To minimize
errors due to differences in the cosine responses, measurement made at local noon when the solar zenith angle was about 20◦was utilized. Due to the operational setup during the ADMIRA campaign it was not possible to rotate the NILU-CUBE to obtain
20
calibration factors for the other heads. The calibration factors were transferred to the other heads using relative measurements made by each head against the NILU-UV prior to the flight.
ACPD
2, 715–738, 2002 Tropospheric and stratospheric photodissociation rates A. Kylling et al. Title Page Abstract Introduction Conclusions References Tables Figures J I J I Back CloseFull Screen / Esc
Print Version Interactive Discussion
c
EGS 2002
3. Measurements
The balloon was launched from the airport of Gap-Tallard (44.457◦N, 6.034◦E, 618 m.a.s.l.), France, on 30 June, 2000. The flight started at 17:48:50 UTC. It took about 90 min. to reach the float altitude of approximately 30 450 m.a.s.l. The balloon stayed at the float altitude for 28 min. Altitude information was taken from GPS receivers.
5
Comparison between the NILU-CUBE and the NILU-UV before and after flight revealed no detectable changes in the NILU-CUBE. The NILU-CUBE was last in the payload and about 100 m below the balloon. For all practical purposes the field of view was thus more or less unobstructed for the measurement conditions, e.g. large solar zenith angles, during the flight.
10
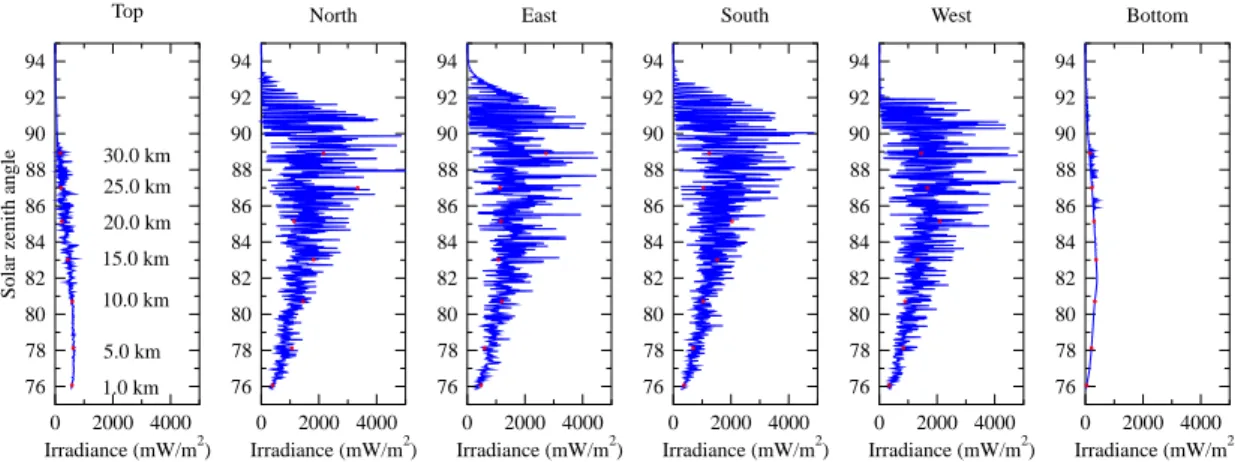
In Figs.5and 6are shown the irradiances measured by the different heads in the 312 and 340 nm channels respectively. The irradiances are shown as a function of the solar zenith angle. During the ascent the solar zenith angle increased from approximately 76◦ to about 89◦when the float altitude was reached. At float altitude the solar zenith angle increased to 94◦before the descent started.
15
The magnitude of the signal in the 340 nm channel is significantly higher than the 312 nm channel. While the maximum in the 312 nm channel is about 80 mW/m2 the maximum in the 340 nm channel gets above 4000 mW/m2. The extraterrestrial flux is approximately 1.45 larger at 340 nm than at 312 nm. Hence, the major cause for the difference in magnitude between the two various channels is ozone absorption that
20
affects the signal in the 312 nm channel but is negligible for the 340 nm channel. A clear ozone layer absorption signature is seen in the 312 nm channel in terms of the decline in the signal between solar zenith angles of 82–86◦(corresponding to altitudes between approx. 12-23 km) and increase between 86–89◦ (approx. 23–30 km). This altitude range is indicated by a black vertical line in the panel for the south sensor in
25
Fig.5. It is also noted that a significantly larger amount of radiation originates close to the horizon than from the zenith. This is obviously due to the large solar zenith angles and the altitude of the instrument. Nevertheless it underlines the importance of
ACPD
2, 715–738, 2002 Tropospheric and stratospheric photodissociation rates A. Kylling et al. Title Page Abstract Introduction Conclusions References Tables Figures J I J I Back CloseFull Screen / Esc
Print Version Interactive Discussion
measuring the radiation from the horizon if the actinic flux is the radiation quantity of interest.
As the balloon ascends the signals in the various heads and channels varies con-siderably. The variations are largest in the horizontally oriented detectors that will be in and out of the direct beam from the sun as the instrument rotated. For the solar
5
zenith angles encountered during the flight neither the balloon nor the rest of the pay-load ever blocked the direct sun. The relative variation in the signal due to rotation is slightly larger in the 340 nm channel than the 312 nm channel. This is due to a some-what larger proportion of the light being diffuse at 312 nm than at 340 nm because of the wavelength dependence of the Rayleigh scattering cross section. The ozone cross
10
section is also larger at 312 nm than at 340 nm. It is noted that the direct contribution to the total actinic flux between 25 and 30 km for the solar zenith angles encountered during the flight, can be up to 90% (80%) at 340 (312) nm.
The up (top) and down (bottom) pointing sensors are only marginally affected by the rotation of the payload. However, evidence of pendulum motion of the payload is seen
15
in these signals. The downpointing sensor varies smoothly with altitude until the solar zenith angle gets large enough to let the sensor see the direct sun as the payload swings. Due to less scattered radiation at 340 nm the variations in both the down and upwelling irradiances are larger than at 312 nm.
As the instrument rotates the horizontal heads mounted opposite of each other will
20
experience maximums and minimums in the radiation field. By combining the signals from all heads the large variations in Figs.5 and 6diminish, see Fig.7, hence, facili-tating further analysis. In the summed signales a clear distinct ozone layer signal is still seen in the 312 nm channel. To further investigate the behaviour of the measured radiation, model simulations were performed.
ACPD
2, 715–738, 2002 Tropospheric and stratospheric photodissociation rates A. Kylling et al. Title Page Abstract Introduction Conclusions References Tables Figures J I J I Back CloseFull Screen / Esc
Print Version Interactive Discussion
c
EGS 2002
4. Simulations
The measurements were simulated by the uvspec model from the libRadtran package (http://www.libradtran.org). The radiative transfer equation was solved by the discrete ordinate algorithm ofStamnes et al.(1988) operating in 16 streams mode with spherical correction as described by Dahlback and Stamnes (1991). The radiative
5
transfer model has compared well with surface UV irradiance measurements (Mayer
et al., 1997; Kylling et al., 1998) and airborne troposheric actinic flux measurements
(Hofzumahaus et al.,2001). Input to the model are the ozone and temperature profiles,
surface albedo and altitude and solar zenith angle information. The atmosphere was divided into 98 layers with about 0.4 km resolution between the surface and 31 km, then
10
2.5 km resolution up to 50 km and 5 km above.
Ozone and temperature profiles were taken from an ozone sonde launched from Observatoire Haute Provence, (OHP), 100 km to the south of Gap-Tallard, on 28 June. The ozone column estimate from the sonde data was 303 DU. For 30 June the Earth Probe/Total Ozone Mapping Spectrometer (EP–TOMS) estimated the total ozone
col-15
umn to be 315 DU. However better agreement between the model and measurement was found using the slightly lower value of 283 DU. Data from EP–TOMS between the 28-30 June indicates that the ozone field was relatively stable during this period. Hence, the profile from the 28th is expected to be representative for the conditions on 30 June. The ozone cross section was taken from Bass and Paur (1985). The
20
ground albedo was set to 0.05 which is representative for the type of surfaces around Gap-Tallard (Feister and Grewe,1995). The Atlas 3 extraterrestrial spectrum shifted to air wavelengths (M. E. VanHoosier, personal communication, 1996) was used and the Earth-Sun distance was corrected for.
No information about aerosols composition and concentration was available for the
25
flight. For the model simulations background aerosol concentrations were assumed. The aerosol extinction profile was taken from the spring-summer background aerosol profile of Shettle (1989). The surface visibility, which for this aerosol model affects
ACPD
2, 715–738, 2002 Tropospheric and stratospheric photodissociation rates A. Kylling et al. Title Page Abstract Introduction Conclusions References Tables Figures J I J I Back CloseFull Screen / Esc
Print Version Interactive Discussion
the aerosol up to altitudes of 2 km, was set to 50 km. The Henyey–Greenstein phase function was used with asymmetry factor from the above spring-summer background aerosol model.
As noted in Sect.2.1, combining the signal from all heads will overestimate the ac-tinic flux. To quantify this overestimate the radiance fields were calculated for 312
5
and 340 nm for all the altitudes and solar zenith angles for which measurements were made. These radiance fields were integrated using the measured angular response of the NILU-CUBE to yield a simulated NILU-CUBE signal. This simulated signal was ratioed with the actinic flux from the same simulations. This ratio is termed the angular response correction factor and is the number with which the NILU-CUBE
measure-10
ments must be divided to get the actinic flux. The angular response correction factor is shown in Fig.8. The angular response factor is nearly constant for the 312 nm chan-nel while it varies considerably with altitude for the 340 nm chanchan-nel. This is due to the radiation field being more isotropic at 312 nm than at 340 nm. The NILU-CUBE data shown in Figs.7 and 9 have all been corrected for using the angular response
15
correction factors shown in Fig.8.
The NILU-CUBE reports data values every 5 s which corresponds to an altitude res-olution of about 50 m. For each altitude an actinic flux spectrum was calculated and convolved with the spectral response for each channel. The resulting simulated actinic fluxes are shown as black lines in Fig.7.
20
The model/measurement ratio as a function of the solar zenith angle is shown in Fig.9. For solar zenith angles up to 90◦ the simulations are within 20% of the surements for the 312 nm channel. For the 340 nm channel the simulations and mea-surements agree to better than 10% for solar zenith angles up to 93◦. Considering the large solar zenith angles, the associated uncertainties in the correctness of the
25
pseudo-spherical approximation used for the model simulations, and the uncertainties in the aerosol optical properties, the results gives confidence in both the behaviour of the instrument and the model simulation.
measure-ACPD
2, 715–738, 2002 Tropospheric and stratospheric photodissociation rates A. Kylling et al. Title Page Abstract Introduction Conclusions References Tables Figures J I J I Back CloseFull Screen / Esc
Print Version Interactive Discussion
c
EGS 2002
ments in the 312 nm channel compared to the 340 nm. These may be attributed to uncertainties in the ozone profile with respect to the actual profile during the flight.
The overall agreement between the measurements and the model simulations is good. And at least for cloudless sky conditions the present results supports the con-clusions ofB ¨osch et al.(2001) that uncertainties in UV and visible actinic fluxes is not
5
a likely factor that may explain the discrepanices between model and measured strato-spheric NO2at large solar zenith angles.
5. Photodissociation rates
Dahlback (1996) showed that it was possible to reconstruct UV irradiance spectra
based on the measured total ozone column and the measured effective cloud optical
10
depth. As shown by e.g. Webb et al. (2002) the ratio of actinic flux spectra to irradi-ance spectra depend on wavelength, solar zenith angle and aerosol amount. However, the same spectral lines are present in both irradiance and actinic flux spectra. Above the radiation measured in the 312 and 340 nm channels by the NILU-CUBE was sim-ulated by a radiative transfer model. The most important input for the simulation was
15
the total ozone column, the ozone profile, solar zenith angle and altitude information. The same input was used to calculate the actinic flux at other wavelengths. Thus, ef-fectively an actinic flux spectrum was reconstructed from the measurements made at two wavelengths. While this approach has not been validated by simultaneous mea-surements by the NILU-CUBE and a spectroradiometer measuring the actinic flux, the
20
model has been validated thoroughly against surface irradiance measurements (Mayer
et al.,1997;Kylling et al.,1998) and airborne actinic flux measurements (Hofzumahaus
et al., 2001). From these measurement/model comparisons there are no indications that if the model is able to reproduce the measurements at one wavelength it will fail at other wavelengths.
25
The reconstructed actinic flux spectra may be used together with the appropriate cross sections and quantum yields to calculate various photodissociation rates of
in-ACPD
2, 715–738, 2002 Tropospheric and stratospheric photodissociation rates A. Kylling et al. Title Page Abstract Introduction Conclusions References Tables Figures J I J I Back CloseFull Screen / Esc
Print Version Interactive Discussion
terest. Examples of the JNO
2 and JO(1D) photodissociation rates as estimated from
the NILU-CUBE measurements are provided in Fig.10. The ozone cross section and quantum yields used to calculate JO(1D) were taken from Bass and Paur (1985) and
Talukdar et al. (1998) respectively, while the NO2 cross section and quantum yields
were taken fromSchneider et al.(1987) andDeMore et al.(1994) respectively.
5
As opposed to earlier figures the photodissociation rates are shown as a function of altitude. Fig.10 includes data from the ascent, the float altitude of approximately 30 km and the descent. It must be kept in mind that as the balloon ascends the solar zenith angle increases. Hence the blue lines in Fig.10 also include solar zenith angle variations. Examples of instantaneous photodissociation rate profiles calculated with
10
the same input data are provided for solar zenith angles of 75◦ and 90◦in Fig.10.
6. Conclusions
A new lightweight multichannel moderate bandwidth filter instrument has been flown on a balloon in the troposphere and stratosphere for solar zenith angles between 76-95◦. After correcting for the angular response the instrument effectively measures the
15
actinic flux at two channels centered at 312 and 340 nm with a bandwidth at FWHM of approximately 10 nm. The measurements have been compared with a state-of-the-art radiative transfer model. Agreement within ±10% (±20%) are found for solar zenith angles smaller than 93◦(90◦) for the 340 (312) nm channel. To the authors knowledge this is the first comparison of a radiative transfer model and UV measurements made
20
at such large solar zenith angles throughout both the troposphere and stratosphere. The agreement between the model and the measurements indicates that the so-called pseudo-spherical approximation is well suited to calculate the actinic flux at large solar zenith angles.
From the simulations actinic flux spectra are reconstructed from which various
pho-25
todissociation rates are calculated. Such photodissociation rates are important for test-ing and verification of radiation schemes used in chemistry models.
ACPD
2, 715–738, 2002 Tropospheric and stratospheric photodissociation rates A. Kylling et al. Title Page Abstract Introduction Conclusions References Tables Figures J I J I Back CloseFull Screen / Esc
Print Version Interactive Discussion
c
EGS 2002
Further development of the instrument include better angular response of input opitcs and comparison of reconstructed actinic flux spectra with measured actinic flux spec-tra. To improve the agreement between simulations and measurements simultaneous measurements are needed of the ozone profile and the aerosol optical properties.
Acknowledgements. This work was performed within the COZUV project funded by the
Nor-5
wegian Research Council. The authors are grateful to F. Goutail for making it possible for us to take part in the flight and for providing us with ozone and altitude information. The excellent support by the CNES ballon team is also kindly acknowledged. The ADMIRA campaign was part of the ADMIRA project funded by the European Commission (contract EVK2-1999-00167).
References
10
Bass, A. M. and Paur, R. J.: The ultraviolet cross–section of ozone, I, The measurements, in Atmospheric Ozone: Proceedings of the Quadrennial Ozone Symposium, edited by C. S. Zerefos and A. Ghazi, pp. 601–606, D. Reidel, Norwell, Mass., 1985. 722,725
B ¨osch, H., Camy-Peyret, C., Chipperfield, M., Fitzenberger, R., Harder, H., Schiller, C., Schnei-der, M., Trautmann, T., and Pfeilsticker, K.: Comparison of measured and modeled
strato-15
spheric UV/visible actinic fluxes at large solar zenith angles, Geophys. Res. Lett., 28, 1179– 1182, 2001. 716,724
Dahlback, A.: Measurements of biologically effective UV doses, total ozone abundances, and cloud effects with multichannel, moderate bandwidth filter instruments, Appl. Opt., 35, 6514– 6521, 1996. 719,724
20
Dahlback, A. and Stamnes, K.: A new spherical model for computing the radiation field available for photolysis and heating at twilight, Planet. Space Sci., 39, 671–683, 1991. 722
DeMore, W. B., Sander, S. P., Golden, D. M., Hampson, R. F., Kurylo, M. J., Howard, C. J., Rav-ishankara, A. R., Kolb, C. E., and Molina, M. J.: Chemical kinetics and photochemical data for use in stratospheric modeling. Evaluation number 11, JPL publication 94–26, 1994. 725
25
Feister, U. and Grewe, R.: Spectral albedo measurements in the UV and visible region over different types of surfaces, Photochem. Photobiol., 62, 736–744, 1995. 722
ACPD
2, 715–738, 2002 Tropospheric and stratospheric photodissociation rates A. Kylling et al. Title Page Abstract Introduction Conclusions References Tables Figures J I J I Back CloseFull Screen / Esc
Print Version Interactive Discussion
D. W., Donnelly, S. G., Neumann, J. A., Stimpfle, R. M., and Bui, T. P.: JNO2at high solar zenith angles in the lower stratosphere, Geophys. Res. Lett., 28, 2405–2408, 2001. 716
Hofzumahaus, A., Kraus, A., Kylling, A., and Zerefos, C.: Solar actinic radiation (280-420 nm) in the cloud-free troposphere between ground and 12 km altitude: Measurements and model results, J. Geophys. Res., accepted , 2001. 716,722,724
5
Kylling, A., Bais, A. F., Blumthaler, M., Schreder, J., Zerefos, C. S., and Kosmidis, E.: The effect of aerosols on solar UV irradiances during the Photochemical Activity and Solar Ultraviolet Radiation campaign, J. Geophys. Res., 103, 26 051–26 060, 1998. 722,724
Madronich, S.: Photodissociation in the atmosphere 1. Actinic flux and the effects of ground reflections and clouds, J. Geophys. Res., 92, 9740–9752, 1987. 718
10
Mayer, B., Seckmeyer, G., and Kylling, A.: Systematic long–term comparison of spectral UV measurements and UVSPEC modeling results, J. Geophys. Res., 102, 8755–8767, 1997. 722,724
McElroy, C. T.: A spectroradiometer for the measurement of direct and scattered solar irradi-ance from on–board the NASA ER–2 high–altitude research aircraft, Geophys. Res. Lett.,
15
22, 1361–1364, 1995. 716
McElroy, C. T., Midwinter, C., Barton, D. V., and Hall, R. B.: A comparison of J–values from the composition and photodissociative flux meausurement with model calculations, Geophys. Res. Lett., 22, 1365–1368, 1995. 716
Schiller, C., Hofzumahaus, A., M ¨uller, M., Klein, E., R ¨oth, E.-P., and Schmidt, U.: Ultraviolet
20
actinic flux in the stratosphere: An overview of balloon-borne measurements during EASOE, 1991/92, Geophys. Res. Lett., 21, 1239–1242, 1994. 716
Schneider, W., Moortgat, G. K., Tyndall, G. S., and Burrows, J. P.: Absorption cross section of NO2in the UV and visible region (200–700 nm) at 298 K, PP, 40, 195–217, 1987. 725 Shetter, R. E. and M ¨uller, M.: Photolysis frequency measurements using actinic flux
spectrora-25
diometry during the PEM–Tropics mission: instrumentation description and some results, J. Geophys. Res., 104, 5647–5661, 1999. 716
Shettle, E. P.: Models of aerosols, clouds and precipitation for atmospheric propagation stud-ies, paper presented at Conference on Atmospheric Propagation in the UV, Visible, IR and MM-Region and Related System Aspects, NATO Adv. Group for Aerosp. Res. and Dev.,
30
Copenhagen, 1989. 722
Stamnes, K., Tsay, S.-C., Wiscombe, W., and Jayaweera, K.: Numerically stable algorithm for discrete–ordinate–method radiative transfer in multiple scattering and emitting layered
ACPD
2, 715–738, 2002 Tropospheric and stratospheric photodissociation rates A. Kylling et al. Title Page Abstract Introduction Conclusions References Tables Figures J I J I Back CloseFull Screen / Esc
Print Version Interactive Discussion
c
EGS 2002
media, Appl. Opt., 27, 2502–2509, 1988. 722
Talukdar, R. K., Longfellow, C. A., Gilles, M. K., and Ravishankara, A. R.: Quantum yields of O(1D) in the photolysis of ozone between 289 and 329 nm as a function of temperature, Geophys. Res. Lett., 25, 143–146, 1998. 725
Webb, A. R., Bais, A. F., Blumthaler, M., Gobbi, G.-P., Kylling, A., Schmitt, R., Thiel, S.,
Barn-5
aba, F., Danielsen, T., Junkermann, W., Kazantzidis, A., Kelly, P., Kift, R., Liberti, G. L., Misslbeck, M., Schallhart, B., Schreder, J., and Topaloglou, C.: Measuring spectral actinic flux and irradiance: Experimental results from the ADMIRA (Actinic Flux Determination from Measurements of Irradiance), J. Atm. Ocean Technol., 19, 1049–1062, 2002. 719,724
ACPD
2, 715–738, 2002 Tropospheric and stratospheric photodissociation rates A. Kylling et al. Title Page Abstract Introduction Conclusions References Tables Figures J I J I Back CloseFull Screen / Esc
Print Version Interactive Discussion
Fig. 1. The NILU-CUBE before being protected by styrofoam. The size is about 18 cm from head to head. The weight, including a seperate data logging unit is less than 4 kg.
ACPD
2, 715–738, 2002 Tropospheric and stratospheric photodissociation rates A. Kylling et al. Title Page Abstract Introduction Conclusions References Tables Figures J I J I Back CloseFull Screen / Esc
Print Version Interactive Discussion
c
EGS 2002
Fig. 2. Polar diagram of the relative angular response (black line) for an ideal actinic flux meter. (Red lines) The relative angular response of each of four NILU-CUBE heads. (Blue line) The effective relative angular response of the NILU-CUBE.
ACPD
2, 715–738, 2002 Tropospheric and stratospheric photodissociation rates A. Kylling et al. Title Page Abstract Introduction Conclusions References Tables Figures J I J I Back CloseFull Screen / Esc
Print Version Interactive Discussion -80 -60 -40 -20 0 20 40 60 80 zenith angle 0.4 0.5 0.6 0.7 0.8 0.9 1.0 (signal-dark)/cos(zenith angle) Bottom channel 17 Bottom channel 16 West channel 14 West channel 13 South channel 11 South channel 10 East channel 8 East channel 7 North channel 5 North channel 4 Top channel 2 Top channel 1 -80 -60 -40 -20 0 20 40 60 80 zenith angle 0.4 0.5 0.6 0.7 0.8 0.9 1.0 (signal-dark)/cos(zenith angle) 312 nm 360 315 270 225 180 135 90 45 0 -80 -60 -40 -20 0 20 40 60 80 zenith angle 0.4 0.5 0.6 0.7 0.8 0.9 1.0 (signal-dark)/cos(zenith angle) 340 nm 360 315 270 225 180 135 90 45 0
Fig. 3. (Left plot) The difference from an ideal cosine response for each channel for a fixed azimuth angle. (Middle plot) The same difference for the 312 nm channel of one head for various azimuth angles. (Right plot) Similar to the middle plot but for the 340 nm channel.
ACPD
2, 715–738, 2002 Tropospheric and stratospheric photodissociation rates A. Kylling et al. Title Page Abstract Introduction Conclusions References Tables Figures J I J I Back CloseFull Screen / Esc
Print Version Interactive Discussion c EGS 2002 290 300 310 320 330 340 350 360 Wavelength 10-5 10-4 10-3 10-2 10-1 100 Relative spectral response Channel 2, 340 nm Channel 1, 312 nm
ACPD
2, 715–738, 2002 Tropospheric and stratospheric photodissociation rates A. Kylling et al. Title Page Abstract Introduction Conclusions References Tables Figures J I J I Back CloseFull Screen / Esc
Print Version Interactive Discussion 0 40 80 120 Irradiance (mW/m2) 76 78 80 82 84 86 88 90 92 94 Solar zenith angle Top 1.0 km 5.0 km 10.0 km 15.0 km 20.0 km 25.0 km 30.0 km 0 40 80 120 Irradiance (mW/m2) 76 78 80 82 84 86 88 90 92 94 North 0 40 80 120 Irradiance (mW/m2) 76 78 80 82 84 86 88 90 92 94 East 0 40 80 120 Irradiance (mW/m2) 76 78 80 82 84 86 88 90 92 94 South 0 40 80 120 Irradiance (mW/m2) 76 78 80 82 84 86 88 90 92 94 West 0 40 80 120 Irradiance (mW/m2) 76 78 80 82 84 86 88 90 92 94 Bottom
Fig. 5. The irradiances during the flight for the 312 nm channel as a function of solar zenith angle as measured by the various heads. The red dots give the measurements at the altitudes given in the panel for the top sensor. The balloon stayed at the float altitude for solar zenith angles between 89◦and 94◦. See Fig.7for solar zenith angle versus altitude. The black vertical line for the south sensor panel indicates the altitude range for which absorption of radiation by the ozone layer is seen. See text for more comments.
ACPD
2, 715–738, 2002 Tropospheric and stratospheric photodissociation rates A. Kylling et al. Title Page Abstract Introduction Conclusions References Tables Figures J I J I Back CloseFull Screen / Esc
Print Version Interactive Discussion c EGS 2002 0 2000 4000 Irradiance (mW/m2) 76 78 80 82 84 86 88 90 92 94 Solar zenith angle Top 1.0 km 5.0 km 10.0 km 15.0 km 20.0 km 25.0 km 30.0 km 0 2000 4000 Irradiance (mW/m2) 76 78 80 82 84 86 88 90 92 94 North 0 2000 4000 Irradiance (mW/m2) 76 78 80 82 84 86 88 90 92 94 East 0 2000 4000 Irradiance (mW/m2) 76 78 80 82 84 86 88 90 92 94 South 0 2000 4000 Irradiance (mW/m2) 76 78 80 82 84 86 88 90 92 94 West 0 2000 4000 Irradiance (mW/m2) 76 78 80 82 84 86 88 90 92 94 Bottom
ACPD
2, 715–738, 2002 Tropospheric and stratospheric photodissociation rates A. Kylling et al. Title Page Abstract Introduction Conclusions References Tables Figures J I J I Back CloseFull Screen / Esc
Print Version Interactive Discussion 0 50 100 150 200 250 Actinic flux (mW/m2) 76 78 80 82 84 86 88 90 92 94 Solar zenith angle 5 10 15 20 25 30 Altitude (km) 0 2000 4000 6000 8000 Actinic flux (mW/m2) 76 78 80 82 84 86 88 90 92 94 5 10 15 20 25 30 Altitude (km)
Fig. 7. The sum of the signal from all heads for each channel as a function of the solar zenith angle (blue line: 312 nm, red line: 340 nm). The green line is the altitude of the instrument. The black lines are model simulations of the measurements.
ACPD
2, 715–738, 2002 Tropospheric and stratospheric photodissociation rates A. Kylling et al. Title Page Abstract Introduction Conclusions References Tables Figures J I J I Back CloseFull Screen / Esc
Print Version Interactive Discussion
c
EGS 2002
1.0 1.1 1.2 1.3 1.4 1.5
Angular response correction 76 78 80 82 84 86 88 90 92 94 Solar zenith angle 5 10Altitude (km)15 20 25 30 340 nm 312 nm
Fig. 8. The angular response correction factors for the two channels as a function of solar zenith angle and thus altitude (green line).
ACPD
2, 715–738, 2002 Tropospheric and stratospheric photodissociation rates A. Kylling et al. Title Page Abstract Introduction Conclusions References Tables Figures J I J I Back CloseFull Screen / Esc
Print Version Interactive Discussion 0.0 0.2 0.4 0.6 0.8 1.0 1.2 1.4 Model/measurement 76 78 80 82 84 86 88 90 92 94 Solar zenith angle 312 nm 0.0 0.2 0.4 0.6 0.8 1.0 1.2 1.4 Model/measurement 76 78 80 82 84 86 88 90 92 94 340 nm
Fig. 9. The ratio of simulations versus measurements as a function of the solar zenith angle for the two channels.
ACPD
2, 715–738, 2002 Tropospheric and stratospheric photodissociation rates A. Kylling et al. Title Page Abstract Introduction Conclusions References Tables Figures J I J I Back CloseFull Screen / Esc
Print Version Interactive Discussion
c
EGS 2002
10-5 2 5 10-4 2 5 10-3 2 5 10-2 2
The J[NO2] photodissociation rate (1/s)
5 10 15 20 25 30 Altitude (km) 10-9 10-8 10-7 10-6 10-5 10-4
The J[O(1D)] photodissociation rate (1/s)
5 10 15 20 25 30 Altitude (km) Fig. 10. The JNO
2 and JO(1D) photodissociation rates as estimated from the NILU-CUBE
mea-surements (blue lines). Also shown are the same photodissociation rates, but for constant solar zenith angles of 75◦(right black lines) and 90◦ (left black lines).