HAL Id: hal-02401572
https://hal.archives-ouvertes.fr/hal-02401572
Submitted on 16 Nov 2020HAL is a multi-disciplinary open access archive for the deposit and dissemination of sci-entific research documents, whether they are pub-lished or not. The documents may come from teaching and research institutions in France or abroad, or from public or private research centers.
L’archive ouverte pluridisciplinaire HAL, est destinée au dépôt et à la diffusion de documents scientifiques de niveau recherche, publiés ou non, émanant des établissements d’enseignement et de recherche français ou étrangers, des laboratoires publics ou privés.
Confocal Volumetric µXRF and Fluorescence Computed
µ-Tomography Reveals Arsenic Three-Dimensional
Distribution within Intact Pteris vittata Fronds
Antony van der Ent, Martin de Jonge, Kathryn Spiers, Dennis Brueckner,
Emmanuelle Montargès-Pelletier, Guillaume Echevarria, Xiaoming Wang, Mei
Lei, Rachel Mak, James Lovett, et al.
To cite this version:
Antony van der Ent, Martin de Jonge, Kathryn Spiers, Dennis Brueckner, Emmanuelle Montargès-Pelletier, et al.. Confocal Volumetric µXRF and Fluorescence Computed µ-Tomography Reveals Arsenic Three-Dimensional Distribution within Intact Pteris vittata Fronds. Environmental Science and Technology, American Chemical Society, 2020, 54 (2), pp.745-757. �10.1021/acs.est.9b03878�. �hal-02401572�
Confocal volumetric µXRF and fluorescence computed
1
µ-tomography reveals arsenic three-dimensional distribution
2
within intact Pteris vittata fronds
3 4
Antony van der Ent1,2*, Martin D. de Jonge3, Kathryn M. Spiers4, Dennis Brueckner4,5,6,
5
Emmanuelle Montargès-Pelletier7, Guillaume Echevarria2, Xiao-Ming Wan8, Mei Lei8,
6
Rachel Mak9, James Lovett10,Hugh H. Harris10*
7 8
1Centre for Mined Land Rehabilitation, Sustainable Minerals Institute,
9
The University of Queensland, Australia. 10
11
2Laboratoire Sols et Environnement, UMR 1120, Université́ de Lorraine, France.
12 13
3Australian Synchrotron, ANSTO, Australia.
14 15
4Photon Science, Deutsches Elektronen-Synchrotron DESY, Germany.
16 17
5Department of Physics, University of Hamburg, Germany.
18 19
6Faculty of Chemistry and Biochemistry, Ruhr-University Bochum, Germany.
20 21
7Laboratoire Interdisciplinaire des Environnements Continentaux, CNRS - Université́ de Lorraine, France.
22 23
8Center for Environmental Remediation, Institute of Geographic Sciences and Natural Resources Research,
24
Chinese Academy of Sciences, China. 25
26
9Department of Chemistry, University of Sydney, Australia.
27 28
10Department of Chemistry, The University of Adelaide, Australia.
29 30 31
ABSTRACT 32
The fern Pteris vittata has been the subject of numerous studies because its extreme arsenic
33
hyperaccumulation characteristics. However, information on the arsenic chemical speciation and
34
distribution across cell types within intact frozen-hydrated Pteris vittata fronds is necessary to better
35
understand the arsenic biotransformation pathways in this unusual fern. While 2D X-ray absorption
36
spectroscopy imaging studies show that different chemical forms of arsenic – As(III) and As(V) –
37
occur across the plant organs, depth-resolved information of arsenic distribution and chemical
38
speciation in different cell types within tissues of Pteris vittata have not been reported. By using a
39
combination of planar and confocal X-ray fluorescence imaging and fluorescence computed
µ-40
tomography, this study reveals the localization of Arsenic in the endodermis and pericycle
41
surrounding the vascular bundles in the rachis and the pinnules of the fern. Arsenic is also
42
accumulated in the vascular bundles connecting into each sporangium, and in some mature sori. The
43
use of 2D X-ray absorption near edge structure imaging allows for deciphering arsenic speciation
44
across the tissues, revealing arsenate in the vascular bundles and arsenite in the endodermis and
45
pericycle. This study demonstrates how different advanced synchrotron X-ray microscopy
46
techniques can be complementary in revealing, at tissue and cellular levels, elemental distribution
47
and chemical speciation in hyperaccumulator plants.
48 49
Keywords: chemical speciation; elemental distribution; hyperaccumulator; fern. 50
51 52
1. INTRODUCTION 53
Hyperaccumulator plants are able to regulate potentially toxic concentrations of trace elements in
54
their living tissues1,2,3. Arsenic hyperaccumulation has been described for a number of pteridophytes
55
(ferns) from the genus Pteris (Pteridaceae), most notably Pteris vittata, which accumulates up to
56
22 600 µg g-1 As4,5 and Pityrogramma calomelanos which accumulates up to 16 400 µg g-1 As6,7 in
57
fronds. Phytoextraction with P. vittata has been successfully applied in the remediation of soil and
58
groundwater As8,9,10. The As hyperaccumulation mechanisms of P. vittata have elicited intensive
59
research11,12,13,14. Arsenic content in P. vittata follows the order of pinnae > stipe > root, with most
60
As distributed in the pinnae (78–96%). The concentration of As in the pinnae decreases from the
61
base to the apex of the fronds, and As concentrations in midribs is much lower than in the pinnae15.
62
The As concentration was relatively high in the midrib compared to the surrounding tissues, and
63
there could be an unloading process of As from midrib to mesophyll tissues16. An interesting finding
64
is that As concentrations in spores were far lower than in the pinnae, indicating that P. vittata tends
65
to keep As away from reproductive organelles15. At the cellular level, energy dispersive X-ray
66
spectroscopy combined to scanning electron microscopy (SEM-EDS) identified that As is primarily
67
distributed within the upper and lower epidermis of the pinna in P. vittata15. Analysis with X-ray
68
fluorescence imaging (µXRF) led to the reporting of even higher As concentration in trichomes
69
compared that prevailing As concentrations in the epidermis17. At the subcellular level, As was
70
mainly stored in the cytoplasmic supernatant fraction, accounting for 78% of As in the pinnae18.
71
Therefore, As compartmentalisation in trichomes and vacuoles was suggested as a detoxification
72
mechanism in P. vittata15,17. Recently, localization of As in the apoplast near the midrib, in fronds of
73
P. vittata was reported19. A similarity between the As and K distribution at both cellular and
74
subcellular level was found15,20, implying that K+ may act as a counterbalance to AsVO43- anions.
75 76
Pteris vittata contains As predominantly as inorganic As species21. Regardless of whether As(III) or
77
As(V) was supplied to the plants, the oxidized form As(V) dominated in the roots while As(III)
78
dominated in the rhizomes and fronds15,21,22,23,24,25, suggesting that the reduction of As(V) to As(III)
79
occurs during As translocation. Furthermore, X-ray absorption spectroscopy indicated that, in the
80
pinnae, As(III) was predominantly coordinated with oxygen22,25. The precise location where As(V) is
81
reduced to As(III) is still unknown. The reduction of As(V) to As(III) was firstly considered to occur
82
in the pinnae as it was found that As in xylem sap was mainly As(V)21,23. It was proposed that As(V)
83
is transported through the vascular tissue from the roots to the fronds, where it is reduced to As(III)
84
and stored at high concentrations25. As(V) is reduced mainly in roots and not in the fronds22,24 and
85
root extracts from the P. vittata were able to reduce As(V) to As(III)26. The reduction of As mainly
occurs in the endodermis of roots27. Arsenic is transported in the xylem sap of P. vittata
87
predominantly (93–98%) as As(III), regardless of whether As(V) or As(III) was supplied to the
88
plants, implying that the roots are the main site of As(V) reduction in P. vittata29. Similar reduction
89
of another metalloid, antimony (Sb), from pentavalent Sb to trivalent Sb has been reported in the
90
roots of P. vittata30. However although clearly As(V) is reduced most effectively in root endodermis
91
and then As(III) is transported most effectively in xylem, the identification of As(V) in other tissues
92
means that not all of it is reduced in the root and the As(III) tris-glutathione [As(SR)3] form found in
93
the surroundings of the vasculature suggests that reduction can occur also outside the root25.
94
Despite all the previously cited publications, no study to date has revealed the As-distribution at the
95
cellular-scale in the P. vittata fronds, and previous data has only shown planar views of As
96
(projected onto a 2D plane). As such no depth information is currently available and the in situ 3D
97
distribution of As needs to be investigated and confirm the 2D visualisation. It is possible that
98
observed differences in As speciation across tissues are due to spatial variations of As in different
99
cell types27,31. Pickering et al.25 examined both the gametophyte generation and the sporophyte
100
generation, and found discrete speckles of arsenate localized in parenchymal cells (possibly in
101
vacuoles) in the gametophytes. Another study on a related As-hyperaccumulating fern
102
(Pityrogramma calomelanos) by Kachenko et al.7 showed substantial tissue-level differentiation in
103
As accumulation but could not reveal As chemical speciation.
104 105
Conventional synchrotron (planar or 2D) µXRF of plant leaves (whole leaves or cross sections) is a
106
projection of all elements in a sample. As such, a planar view of a plant leaf reveals the elements
107
contained in the adaxial and abaxial epidermis and mesophyll together in a 'compressed' projected
108
2D plane. Several methods are available for revealing the detailed 3D elemental distributions
109
relevant to complex biological samples. In this article we employ three complementary approaches to
110
access the 3D elemental distributions: mechanical sectioning to access the distributions within a
111
single plane, X-ray fluorescence µ-computed tomography (XFM-µCT) to determine volumetric
112
distributions from a series of projection images without sample sectioning, and confocal imaging to
113
directly access elemental distributions within targeted regions within the specimen. Although we
114
describe these methods here, a more detailed comparison can be found in de Jonge & Vogt32 and van
115
der Ent et al.33.
116 117
Confocal optics enable a direct-space approach to deliver 3D resolution. A confocal optic confines
118
the field of view of the energy-dispersive detector so that the signal derives from only a small portion
of the illuminated column34,35,36. The probe volume is thereby reduced to a spheroid and elemental
120
distribution is mapped in three dimensions by scanning the specimen through the probe volume. The
121
use of confocal X-ray fluorescence methods for the investigation of biological samples has been
122
limited to date, probably due to the increased X-ray dose associated with the confocal geometry in
123
most situations37. Such an approach was, however, successfully utilized to decipher the distribution
124
and chemical speciation of selenium in zebrafish larvae38.
125 126
Another approach to obtain information on the internal elemental distribution in physically intact
127
samples is X-ray fluorescence µ-computed tomography (XFM-µCT). This technique enables
128
reconstruction of 2D or 3D elemental data from a rotation series of projection images. For typical
129
measurement modalities, µCT requires the measurement of projection images from multiples view
130
around a fixed rotation axis. In order to avoid issues with self-absorption and to simplify the
131
measurement, XFM-µCT is limited to measurements of specimen that are relatively thin in the two
132
dimensions around the rotation axis, such as roots39,40, stems and narrow leaves41 and seeds42,
133
although µCT laminography could be used in flatter objects such as leaves. The confocal approach is
134
more tolerant to self-absorption effects, and especially well-suited to measure depth profiles in
135
extended planar objects such as leaves. Further, the confocal measurement enables direct access to
136
small volumes within a specimen and so is amenable to direct and in situ spectroscopic (XANES)
137
measurements.
138 139
Self-absorption is a combination of two effects that reduce the quantitative nature of reconstructions
140
obtained by XFM-µCT and affect the visualization of element distribution: the absorption of the
141
incident X-ray photons and the re-absorption of the fluorescent X-ray photons (in particular
low-142
energy photons) by the specimen (for a review see Vogt & de Jonge32). Self-absorption is usually
143
dominated by the latter of these effects, and this in turn has a greater impact on the quantitative
144
determinations of the elements with low energy x-ray photons for K-shell emission this corresponds
145
to with lower-Z elements. Self-absorption places a practical upper limit on the specimen dimensions,
146
so that, for example, Ni can be mapped in hydrated biological samples up to ∼800 µm thick with
147
reasonable accuracy (Kα line at 7.47 keV), but this increases up to ∼1500 µm for As (Kα line at
148
10.54 keV) assuming a tolerable limit of 50% self-absorption.
149 150
ray fluorescence microscopy (XFM) beamlines also offer the unique ability to perform in situ
X-151
ray absorption spectroscopy (XAS) to obtain information on the chemical speciation of elements (As
in this case) in plant tissues without preparations and avoiding the possibility for artefacts resulting
153
from those preparations. Moreover, the use of confocal optics allows examination of As chemical
154
speciation at depth in distinct cell types within intact plant tissues and hence elucidation of the
155
spatially resolved chemical speciation and elemental distribution in physically intact samples without
156
the need for destructive sample preparation33,43.
157 158
The complexity of As distribution and chemical speciation requires a range of different
159
methodological approaches to understand the 3D distribution at the cellular level and also for the
160
speciation. This study uses a combination of different synchrotron X-ray methodological approaches
161
to interrogate As distribution and chemical speciation in Pteris vittata tissues, which are summarised
162
in Table 1. To date, depth-resolved information has not been available, and this study aims not only
163
to unravel the As pathway in the As hyperaccumulating fern Pteris vittata, but also to demonstrate
164
how a set of advanced synchrotron X-ray microscopy techniques can be complementary in revealing,
165
at tissue and cellular levels, the distribution and chemical speciation of As in this hyperaccumulator
166
plant.
167 168
2. MATERIALS AND METHODS 169
170
2.1 Cultivation and collection of plant tissues and soils 171
Tissue samples were obtained in one of two ways. Cultured tissue samples were obtained from P.
172
vittata grown in soil at the University of Queensland. The potting mix was spiked with an As(V)
173
solution supplied as Na2HAsO4·7H2O prior to transplanting (dose rate was 1000 mg kg-1 as As). The
174
plants were grown in a greenhouse for two months with an 11-hr daily photoperiod, a photon flux of
175
>370 µmol m-2 s-1, a day-night temperature range of 20–29°C and relative humidity of ~70%. Tissue
176
samples of P. vittata were also collected from a contaminated site in Shimen, Hunan Province in
177
south China. This site is heavily contaminated by As due to realgar ore smelting activities in the past
178
(N29o39’33.88” E111o2’43.1”) with a soil As concentration of 313 µg g-1. The live plants, together
179
with the soil attached to the roots, were transported from Hunan to Beijing, and maintained in the
180
laboratory in Beijing. Tissue samples intended for synchrotron XFM analysis were excised with a
181
razor blade and immediately shock-frozen using the metal mirror freezing technique (n which the
182
sample is rapidly pressed against a block of solid copper cooled by at -196°C liquid N2. The samples
183
were then wrapped in Al-foil and transported in a cryogenic container (at least -190°C) for storage
184
and transport. Samples were also freeze-dried in a freeze-dryer (LABCONCO FreeZone 6) starting at
185
-50°C until room temperature in 48 hours. Slow freeze-drying has been shown to avoid, or at least,
reduce elemental re-distribution and tissue shrinkage44,45 but may cause subcellular migration of
187
dissolved elements to the nearest solid surface. The influence of freeze-drying on element chemical
188
speciation is still contentious and depends on several factors such as the element itself, its chemical
189
speciation and initial oxidation state46,47.
190 191
Some physical cross-sections were prepared from the cultivated P. vittata fronds. After shock
192
freezing (as described earlier), the samples were transferred on dry ice (-80°C) into the
cryo-193
chamber of the microtome (maintained at -30°C) and mounted on a plate by application of chilled
(-194
8°C) polypropylene glycol for physical support. The fronds were then cut to 30 µm sections using a
195
cooled blade (-20 °C), and the sections transferred to pre-cooled 1 mL cryo-containers and
freeze-196
dried.
197 198
2.2 Plant tissue bulk analysis 199
Plant tissue samples for bulk chemical analysis were gathered from the cultured ferns after two
200
months, and from the freeze-dried fern samples from China. The samples were dried at 70°C for five
201
days in a dehydrating oven, subsequently ground and a 200-mg fraction digested using 4 mL
202
concentrated nitric acid (70%) and 1 mL hydrogen peroxide (30%) in a digestion microwave oven
203
(Milestone Start D) for a 45-minute programme. After cooling, the sample was diluted to 30 mL with
204
TDI water. The aliquots were analysed on ICP-AES (Varian Vista Pro II) for P, Mg, Ca, K, S and
205
As.
206 207
2.3 Histochemistry and bright field microscopy 208
Frond samples were fixed in 3% glutaraldehyde (in PBS), sectioned with a vibratome (Leica
209
VT1000s) and stained with Toluidine Blue. The sections (20–40 µm thickness) were then examined
210
and photographed with bright field microscope (Nikon Diskovery Spinning Disk Confocal with
211
Andor Zyla 4.2 camera).
212 213
2.4 Scanning Electron Microscopy with X-ray microanalysis (SEM-EDS) 214
Freeze-dried leaf samples were sputter-coated with carbon (25 nm) and mounted on stubs. The
215
samples were then imaged with Scanning Electron Microscopy (SEM) with X-ray microanalysis
216
(Energy dispersive X ray spectroscopy or EDS) on a JEOL JSM-6610 instrument. Images were
217
obtained for 100–1000 x magnifications at 5–15 kV with lower accelerator energies for imaging with
218
secondary electrons only and higher accelerator energies for imaging using backscattered electrons.
219 220
2.5 X-ray fluorescence microscopy (XFM) 221
The X-ray fluorescence microscopy (XFM) beamline of the Australian Synchrotron employs an
in-222
vacuum undulator to produce a brilliant X-ray beam of 4.1–20 keV with a focus down to 1000 nm. A
223
Si(111) monochromator and a pair of Kirkpatrick-Baez (KB) mirrors deliver a monochromatic
224
focused incident beam onto the specimen48. The P06 beamline of PETRA III (Deutsches
Elektronen-225
Synchrotron; DESY) is also equipped with Si(111) monochromator and KB mirrors49 producing
X-226
ray beam of 5–23 keV with a focus down to 300 nm. Both beamlines are equipped with a Maia
227
detector consisting of a large detector array to maximize the detection of fluorescence signal. The
228
Maia detector allows for high overall count-rates and uses an annular detector geometry, where the
229
beam passes though the detector and strikes the sample at normal incidence50,51. This geometry
230
enables a large solid angle (1.2 steradian) to maximize detected signal and reducing the dose and
231
potential damage to a specimen52. Maia is designed for event-mode data acquisition, where each
232
detected X-ray event is recorded, tagged by detector number in the array, position in the scan and
233
other metadata53. This approach eliminates readout delays and enables short pixel times (typically
234
down to 0.1 ms) and large pixel counts to be achieved for high definition imaging (typically 10–100
235
M pixels). The confocal experiment used a custom-made polycapillary collimating optic (XOS, input
236
focal distance 2.5 mm, input field of view 10.0 µm, transmission efficiency optimized for 17.4 keV
237
radiation) fitted on a Vortex SDD detector (Hitachi Vortex EM-90, 80mm2, minimum energy of 1.6
238
keV, energy resolution 120 eV, operated in 90-degree geometry). The experimental setup at the
239
XFM beamline the Australian Synchrotron, showing both the Maia detector and SDD detector with
240
confocal optic, is shown in Fig 1.
241 242
On the XFM beamline, the confocal µXRF and µXAS experiments used a polycapillary optic fitted
243
on the SDD detector allowing for a depth resolution (dz) of ~10 µm (energy and hence
element-244
dependant), while the beam spot size using the KB mirrors was ~2 µm. The resolution of the
245
polycapillary optic limits the z-resolution (along beam axis) of confocal tomography, while the beam
246
spot size limits the x-y-resolution. Accordingly, samples can be raster imaged with an effective probe
247
volume probe of volume of ~10 × 2 × 2 µm. The scan was carried out in the x-z plane which samples
248
the two smallest dimension of the pinnule - a virtual section – so that the y-axis is not probed, with a
249
1 second per pixel dwell time. The confocal µ-XRF images were recorded using a beam incident
250
energy of 15.8 keV
251 252
The fluorescence 2D XANES imaging at the XFM beamline was performed on a portion of a
frozen-253
hydrated pinnule, spanning the midvein and one margin containing sporangia. The fluorescence 2D
XANES imaging consisted of forming ‘stacks’ of µXRF images by scanning the sample area
255
multiple times at successive incident energies. As such, the sample was raster-scanned over a 2.380 256
×. 1.295 mm window with a 5 µm step size, resulting in a µ-XANES image stack of 477 ×. 260 257
pixels. The sample was scanned over the As K-edge (11 877 eV) at 112 energies from 11 800 to 12 258
100 eV using 2 eV steps across the pre-edge region (11 800 to 11 855 eV), 0.5 eV steps across the 259
XANES region (11 855 to 11 900 eV) and 20 eV across the post-edge region (11 900 to 12 100 eV). 260
The µ-XANES spectra were measured using the Maia detector array with a ~1.7 ms per pixel dwell 261
time. 262
263
Arsenic ‘hotspots’ were identified from the confocal µXRF images as regions of interest for
264
volumetric XANES point measurements. Of particular interest is the reduction of arsenate to arsenite
265
as As species cross from the vascular system to the leaf tissues, so regions were selected in the
266
(tissues listed in decreasing proximity to main vascular system) midvein, endodermis, mesophyll and
267
epidermis as well as regions in the secondary veins (vein bundles and surrounding protective
268
sheaths) and sporangia (reproductive parts of the fern). In order to obtain spatial coordination, first
269
coarse confocal µXRF maps were made of the sample. Volumetric XANES point measurements
270
were acquired using the confocal optic attached to a Vortex SDD detector (as described above) and
271
measured across the As K-edge (11 877 eV) at 100 energies spanning the energy range 11 802 to
272
12 017 eV in 0.25 eV steps with 0.5s dwell.
273 274
Energy calibration at the XFM beamline was achieved using a sample of solid sodium arsenite
275
diluted in boron nitride. The “white line” peak energy of this sample was assumed to be 11874.4 eV.
276 277
The 2D µXRF and single-slice µXRF tomography measurements carried out in the microprobe of
278
P06 at DESY were performed with a beam size of 532 × 444 nm at an incident energy of 14 keV.
279
Considering a minimum step size of 0.5 µm and comparing it to the size of the beam, the resolution
280
of the resulting images can be treated as being equal to the step size. Samples consisted of a
free-281
standing rachis and two pinnule margins, one mounted between Ultralene films for 2D measurements
282
and the other mounted inside a Kapton capillary for tomography. All scans were conducted in
283
continuous-scanning mode to minimize dead-time between the exposures with dwell times between 1
284
ms and 10 ms. In the case of single-slice tomography, the rotation stage was the slow scanning axis
285
and the longer scans of the rachis were divided into eight interlaced sub-scans to account for possible
286
vertical drift of the sample. All the samples were either freeze-dried (rachis) or dehydrated (pinnule
287
margin) and so a cryo-stream was not employed.
2.6 Sample preparation and measurement conditions 289
All frozen-hydrated samples were scanned in using a cryo-stream, whereas the freeze-dried samples
290
were scanned at room temperature (20°C). Individual freeze-dried pinnules were glued to carbon
291
sticks with cyanoacrylate (Fig 1b,c), but larger samples (i.e. the intact ‘fresh/live’ frond) were
292
sandwiched between two sheets of Kapton thin film (4 µm) stretched over a Perspex frame (Fig 1d)
293
magnetically attached to the x-y motion stage at atmospheric temperature (~20°C). The samples were
294
scanned ‘on-the-fly’ with a 1–5 ms per pixel dwell at an incident energy of 15.8 keV. The
frozen-295
hydrated samples were transferred under the N2 cryo-stream (-100°C) and were maintained at dry ice
296
temperature during transfer – as such they were kept under cryogenic conditions from collection
297
through to the completion of measurement.
298 299
2.7 Data analysis 300
The Maia X-ray fluorescence data were analysed using GeoPIXE54,55, and images were generated
301
using the Dynamic Analysis method56,57. Unfortunately, due to a technical error associated with the
302
data writing to the cluster storage the raw data of a number of 2D µXRF elemental maps were
303
irretrievably lost. However, real-time (RT) processing data from GeoPIXE were locally retained, and
304
the corresponding pseudo-elemental maps are included in the Supplementary Information.
305 306
Self-absorption, which can lead to inaccuracy in the determination of elemental concentration by
307
XRM, especially in ‘thicker’ samples, depends on the composition of the material, on the thickness
308
of the sample, on the localisation of the element to be detected and on the element itself (energy of
309
its X-ray fluorescence lines), on the distance between sample and the detector, on the energy of the
310
incident beam. Assuming that fern tissue has a similar composition and density to that of cellulose
311
(C6H10O5) with an average thickness of 300 µm (a pinnule blade is somewhat thinner at ~80 µm
312
whereas a rachis is thicker at ~500 µm) and a density of 1.0 g cm-3 then it is assumed that the As
313
fluorescence (Kalpha line et 10.5 KeV) maximum absorption on escape is ~10%.
314 315
Confocal XRF imaging data were analysed with MAPS. Because the (element-dependant)
316
transmission efficiency of the polycapillary optic is not known, and because of the different
317
geometric orientations of the sample (resulting in varying X-ray flux on the sample), the confocal
318
elemental maps were not quantified with respect to concentrations of particular elements. The
319
concentrations are hence plotted on a relative scale.
320 321
Analysis of the XFM-µCT data was achieved by alignment steps using consistency and
cross-322
correlation methods to correct for horizontal drift in the sinograms followed by a tomographic
323
reconstruction step. The high angular sampling of the rachis allowed reconstruction using a filtered
324
back-projection algorithm. However, the pinnule sinograms were recorded with lower angular
325
sampling and so were reconstructed with a maximum-likelihood expectation-maximization algorithm
326
based on the functions of the scikit-image image processing library.
327 328
Fluorescence-XANES mapping gave a 3D image stack of spatial dimensions (x, y) and an X-ray
329
incident energy-resolved dimension E. Initially, the XANES images were aligned using a
well-330
featured spectator element. Alternatively, one could consider each pixel (x, y) of the 477 × 260-pixel
331
image stack to be associated with a unique XANES spectrum. The energy variation in the
332
fluorescence spectra were identified using principal component analysis (PCA) allowing for up to six
333
principal components, with the calculations performed using the Multivariate ANalysis Tool for
334
Spectromicroscopy (MANTiS, Lerotic). Pixels possessing similar spectra were grouped together by
335
k-means clustering, identifying three distinct clusters associated with the leaf, vein and image
336
background (Figure 10). The cluster associated with the background of the image has been
337
subtracted from composite image in Figure 10.
338 339
3. RESULTS. 340
341
3.1 Bulk chemistry and anatomical features 342
Although P. vittata can reach up to 22 600 µg g-1 As dry weight in its fronds4, the cultured plants
343
display 1354 µg g-1 and field collected plants from China have 8580 µg g-1 As on a dry weight basis
344
(Table 2). The concentration of Ca is relatively high in the pinnae with up to 10 300 µg g-1, whereas
345
the K concentration is extremely high in both the pinnae and rachis ranging from 12 300 to 33 000
346
µg g-1. The concentration of P is exceptionally high, especially in the samples from China with up to
347
62 700 µg g-1 in the pinnae and up to 67 000 µg g-1 in the rachis. Concentrations of Cu, Zn and Fe are
348
unremarkable. Toluidine blue stained P. vittata sections of the rachis (Fig. 2) show the typical
349
anatomy of a pteridophyte with the C-shaped elliptical vascular bundles surrounded by three-cell
350
thick pericycle and endodermis cells. The mesophyll is not differentiated into palisade and spongy
351
parenchyma, and mesophyll is absent from the mid-rib. Scanning Electron Microscopy (SEM)
352
images show details of the sporangium with sporophytes (Fig. 3). Each sorus contains clusters of
353
sporangia protected by the upper indusial flap (‘false indusium’) that is formed by the margins of the
pinnule. The abundant presence of fertile cells is evident with the sporangium showing individual
355
sori enclosed by large annulus cells.
356 357
3.2 Planar elemental imaging, confocal ‘virtual’ and computed tomography slices 358
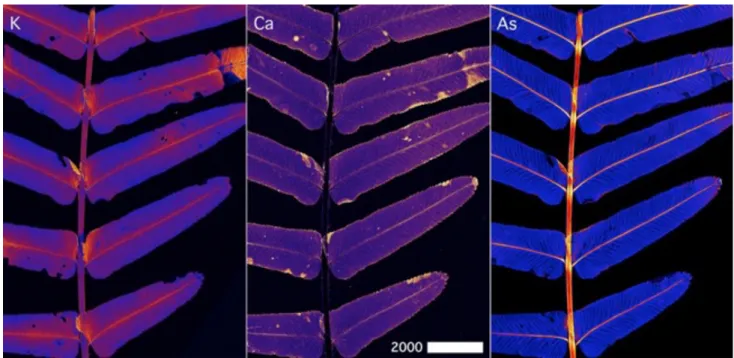
The 2D projection µXRF elemental maps of the live frond (Fig. 4) show substantial enrichment of
359
As in the vascular bundles, particularly in the rachis, but also in the veins of the pinnule. There is a
360
depletion of As in the interveinal areas of the pinnule. The localisation of K is similar except that its
361
concentration in the rachis is higher than the mean As concentration in fronds. In contrast, Ca is
362
depleted in the rachis, but enriched in the veins of the pinnule particularly towards the terminal ends.
363
Calcium is also enriched in damaged (chloric) parts of the fronds, mainly along the margins. These
364
differences are more pronounced in the high-resolution scans of the pinnule apex (Fig. 5), with Ca
365
depleted in the veins but enriched along the pinnule margins. The distribution of As and K are again
366
similar although the distribution of K extends into the lamina. In the freeze-dried pinnule portion
367
towards the terminus (Suppl. Fig. S1 A, B), the distribution of As mirrors that of the frozen-hydrated
368
samples with substantial enrichment in the vascular bundles, especially in the central vein. In fertile
369
pinnules (Suppl. Fig. 1, C, D) strong accumulation of As in the sorus and sporangia is visible.
370
Further detail can be gleaned from scans of the sori (Suppl. Fig. 2). Apart from As enriched in the
371
indusium, the strongest accumulation occurs in the annulus of each sporangium. Some of the
372
individual spores are also rich in As (see top-right panel, Fig. 9), as are hairs in the sorus (for
373
example bottom right panel Fig. 9). Enrichment in the hairs that guard the sporangium at the margin
374
of the fronds has been noted previously25.
375 376
Higher resolution 2D µXRF images (up to 0.5 µm) were collected of the (freeze-dried) pinna margin
377
containing the indusium covering the sporangia, which reveals that As is enriched predominantly in
378
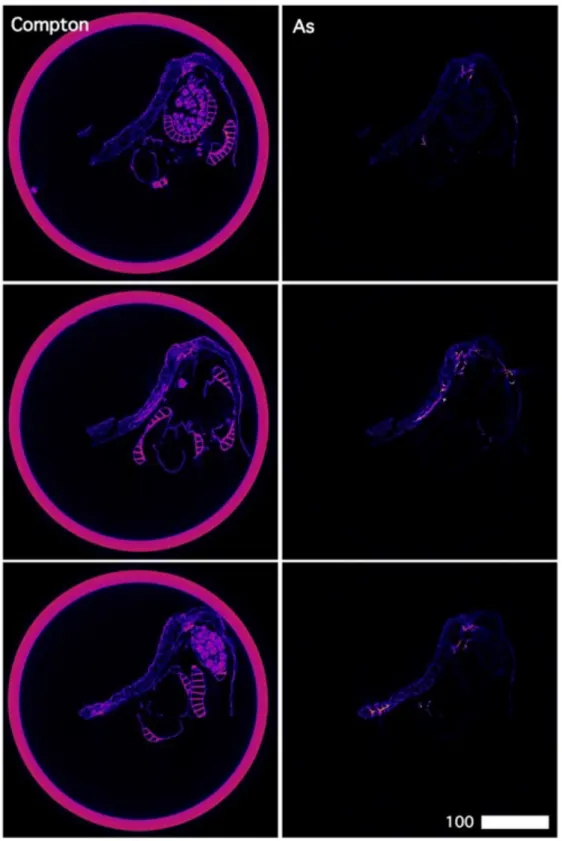
the vascular bundles connecting to the sporangia, but little in the sori themselves (Suppl. Figs. 6, 7,
379
and 8). K is enriched along the indusium edge, and Zn highly localised in the mature sori.
380
Fluorescence computed µ-tomography slices and projections of an intact pinna (Fig. 8 and 9, 0.5 µm
381
pixels) similarly reveal As enrichment in the vascular structures, especially in nodes, but also in
382
some sori.
383 384
Elemental maps of As, Br, Ca and Rb obtained from confocal ‘virtual’ cross-sections of a pinnule are
385
shown in Suppl. Fig. 9. The self-absorption effect as a function of element z is clearly visible from
386
the Ca elemental map with a ‘shadow’ evident behind the thicker midrib. For that reason, we have
387
plotted maps of (high Z) Rb and Br to serve as proxies for K and Cl respectively. The elemental
distribution of Rb is similar to As, which was expected on the basis of the earlier observed
389
similarities between As and K. Arsenic is localised in the adaxial (upper) epidermis extending into
390
the palisade mesophyll. Arsenic is also strongly enriched in the phloem of the (sub)lateral veins.
391
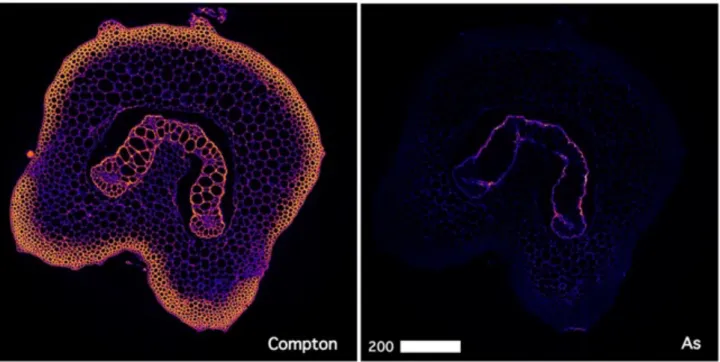
Confocal cross-sections of the central part of the pinnule with the midrib reveal that As is strongly
392
accumulated in the endodermis and pericycle surrounding the phloem (Fig. 6). Arsenic is also
393
strongly enriched in abaxial (lower) epidermal cells of the midrib (but not extending to the lamina).
394
Detailed confocal scans of the pinnule margins show accumulation of As in the indusium as well as
395
in the sporangia, particularly the annulus (Suppl. Fig 10).
396 397
The elemental distribution of As in freeze-dried physical cross-sections scanned in 2D (Suppl. Fig.
398
3–4) also shows strong enrichment in the endodermis and pericycle surrounding the vascular
399
bundles, as well as in the hypodermis extending into the cortex, ostensibly in the apoplastic space
400
between the cells. Again, As is accumulated in the indusium and in the annulus of the sporangia. A
401
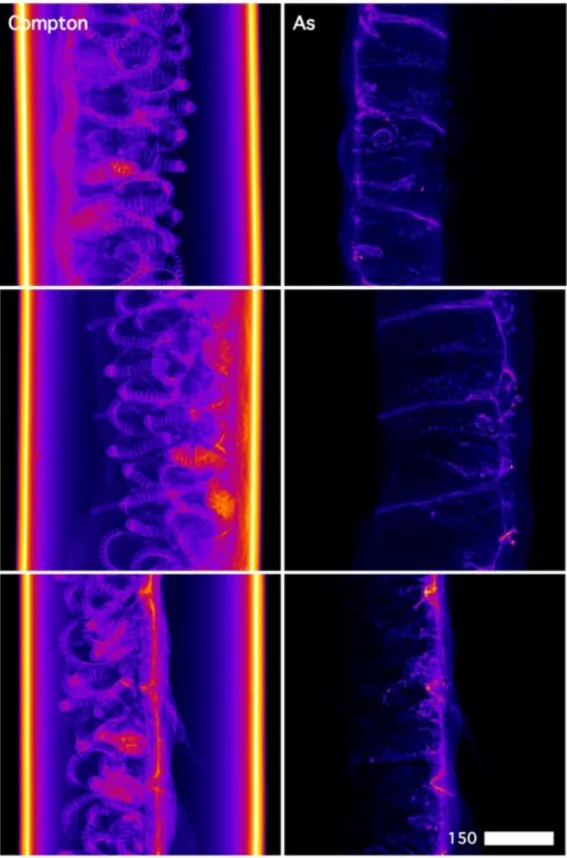
scan of a physically sectioned freeze-dried rachis (Suppl. Fig. 5) shows the accumulation of As in the
402
endodermis and pericycle surrounding the phloem. Fluorescence computed µ-tomography with 0.5
403
µm pixel size was undertaken on a freeze-dried rachis (Fig. 7) and reveals a very similar As
404
enrichment pattern in the endodermis and pericycle surrounding the vascular bundles.
405 406
3.3 XANES imaging and volumetric XANES spot analysis 407
2D XANES imaging was performed on a frozen-hydrated pinnule. In addition, volumetric XANES
408
measurements were acquired from spatial regions of interest in pinnae in both freeze-dried samples
409
recorded at room temperature (Suppl. Figs. 11 and 12) and frozen-hydrated state under a cryostream
410
using a confocal optic.
411 412
The cluster spectra associated with the pinnule and vascular bundle areas respectively were
413
compared to reference spectra of relevant As standards (figure 10C). On the basis of the energy
414
position of the absorption maxima, and comparison to the spectrum of solid sodium arsenite recorded
415
during the same beamtime run, cluster 1 and 2 spectra were assumed to correspond to As(III) (as
416
arsenite) and As(V) (as arsenate), respectively. Both spectra are slightly broadened in comparison
417
with reference spectra reproduced from previous study25 that were recorded with higher energy
418
resolution (0.2 instead of 0.5 eV). However, the spectrum extracted from cluster 2 in Fig 10,
419
primarily representing the main vascular bundle zone, displays an even broader absorption edge,
420
displaying a shoulder at lower energy consistent with the peak energy of the arsenite model
spectrum. This broadening is likely due to the presence of a mixture of As(III) and (V) species in the
422
vascular bundles, where the relative abundance of each species is consistent across the cluster.
423 424
Volumetric XANES point measurements from a selection of different anatomical features returned
425
spectra that were distinct from the model compound spectra. Absorption peak energies were aligned
426
more closely to those of the As(III) standards, even in tissues where As(V) would be expected from
427
previous work and from the 2D XANES imaging in this work (Figure 10). For instance, it is
428
expected that the vascular bundles (regions G and H, Suppl Fig. 11) would exhibit As(V) prior to
429
crossing the endodermis, however these bundles display reduced As(III) as stated from the peak
430
energy. The peak height to background edge jump ratio in several of the volumetric XANES spectra
431
is drastically attenuated relative to the model spectra. The results of the volumetric XANES analysis
432
suggest that this approach delivers too high of a radiation dose to the sample to be reliable in
433
determining the speciation of As in the specimen without drastic photoreduction, even in samples
434
cooled under a liquid N2 cryostream. In fact, point XANES spectra from freeze-dried tissues (Suppl
435
Fig 12), which should be less susceptible to photoreduction due to the absence of water, show higher
436
peak energies in some cases compared to those spectra from frozen tissue, strongly implicating
437
photodamage in the unusual appearance of these spectra.
438 439
The XANES spectra collected using either 2D XANES imaging or confocal point XANES are
440
compared below to model As compound spectra previously reported25. We note that the spectral
441
resolution of the beamline used in this work is significantly poorer than that from the previous work;
442
as such, any comparison should be interpreted with caution as the spectra from this study will be
443
broadened significantly compared to the model compound spectra.
444 445
4. DISCUSSION 446
The use of confocal optics has made it possible to examine As in the depth profile of the tissues in
447
physically intact samples with high aspect ratio, without the need for destructive sample preparation,
448
and this approach has provided new information on the mechanisms underlying As
449
hyperaccumulation in P. vittata. Confocal cross-sections of the central part of the pinnule with the
450
midrib have revealed that As is strongly accumulated in the endodermis and pericycle surrounding
451
the phloem. XFM µ-CT revealed a very similar As enrichment pattern in the endodermis and
452
pericycle surrounding the vascular bundles. As such, the various technical approaches lead to
453
conclusions that are entirely consistent with each other.
454 455
Confocal optics also offer the ability to perform volumetric XANES to obtain spatially resolved
456
information on the chemical speciation within intact tissues. However, it eventuated that volumetric
457
XANES causes substantial photodamage due to the very high radiation dose of this approach (60s
458
total exposure per point), even if the sample is cryogenically cooled. Therefore, observations indicate
459
that significant interpretation regarding As chemical form should not be drawn from the confocal
460
volumetric XANES measurements, and reiterate the utility of 2D XANES imaging to provide
461
chemical information with lower X-ray dose (0.0017s total exposure per pixel, or ~300 less than then
462
confocal XANES measurements), albeit without the capacity to provide information in the third
463
dimension in this case. The results of the 2D XANES imaging are congruent with previous
464
knowledge of As speciation in P. vittata25, which in part validates the novel confocal imaging in this
465
work as it demonstrates that the sample preparation has not modified the distribution of the primary
466
arsenic species in the tissues. Published 2D XANES imaging studies showed that different chemical
467
forms of As (As(III) and As-(V)) occur across the plant organs25. Depth information of As chemical
468
speciation in different cell types within tissues of P. vittata was not available and the knowledge of
469
the distribution across different cells types within the fronds and rachis was limited28. In this work
470
we have demonstrated that observed differences in As speciation across tissues are related to spatial
471
variation of As concentration in different cell types.
472 473
After the Zn-Ni-Cd hyperaccumulator Noccaea caerulescens, P. vittata is the most well-studied
474
hyperaccumulator. As a consequence, much is now known about the uptake and metabolic regulation
475
of As in this species19,21,22,26,25,28,31,30. Nevertheless, many open questions remain, specifically
476
surrounding the adaptive advantages for As hyperaccumulation in this species, and about the
477
physiological functions of As(V) to As(III) conversion for storage and translocation in the fronds.
478 479
Author contributions 480
M.L and X-M.W collected the P. vittata samples in the field in China. A.vdE cultivated live P.
481
vittata in Australia. X-M.W prepared freeze-dried samples for the synchrotron analysis. A.vdE,
482
M.dJ, E.M-P, G.E. and H.H.H conducted the synchrotron XFM experiments. M.dJ, R.MP and H.H.H
483
analysed the XFM and XAS data. A.vdE performed the SEM-EDS and light microscopy
484
experiments. A.vdE, K.M.S and D.B performed the synchrotron µXRF tomography experiments.
485
K.M.S analysed the µXRF tomography spectra. D.B reconstructed the µXRF tomograms. All authors
486
contributed to writing the manuscript.
487 488 489
Acknowledgements 490
This research was undertaken on the X-Ray Fluorescence Microscopy beamline of the Australian
491
Synchrotron (part of ANSTO), Victoria, Australia. This work was supported by the Multi-modal
492
Australian ScienceS Imaging and Visualisation Environment (MASSIVE). Beamtime at beamline
493
P06 at PETRA III was granted within the in-house research program of DESY, a member of the
494
Helmholtz-Association. We would like to thank Jan Garrevoet for assistance during the experiments.
495
We thank the Centre for Microscopy and Microanalysis, The University of Queensland. A. van der
496
Ent was the recipient of a Discovery Early Career Researcher Award (DE160100429) from the
497
Australian Research Council. H. Harris acknowledges the Australian Research Council for financial
498
support (DP140100176). The French National Research Agency through the national
499
“Investissements d’avenir” program (ANR-10-LABX-21, LABEX RESSOURCES21) and through
500
the ANR-14-CE04-0005 Project “Agromine” is acknowledged for funding support to A. van der Ent.
501
Finally, the Program “Bingwei” Excellent Talent in the Institute of Geographic Sciences and Natural
502
Resources Research, CAS supported this work.
503 504
REFERENCES 505
506
1 Krämer U. 2010. Metal Hyperaccumulation in Plants. Annu. Rev. Plant Biol. 61: 517–534.
507 508
2 Pollard AJ, Powell KD, Harper FA, Smith JAC. 2002. The Genetic Basis of Metal
509
Hyperaccumulation in Plants. Critical Reviews in Plant Sciences 21: 539–566.
510 511
3 Reeves RD, Baker AJM, Jaffré T, Erskine PD, Echevarria G, van der Ent A. 2017. A global
512
database for hyperaccumulator plants of metal and metalloid trace elements. New Phytologist 18:
513
407–411.
514 515
4 Ma LQ, Komar KM, Tu C, Zhang WH, Cai Y, Kennelley ED. 2001. A fern that hyperaccumulates
516
arsenic. Nature 411(6836): 438-U3.
517 518
5 Tu C, Ma LQ. 2003. Effects of arsenate and phosphate on their accumulation by an
arsenic-519
hyperaccumulator Pteris vittata L. Plant and Soil 249: 373–382.
520 521
6 Francesconi K, Visoottiviseth P, Sridokchan W, Goessler W. 2002. Arsenic species in an arsenic
522
hyperaccumulating fern, Pityrogramma calomelanos: a potential phytoremediator of
arsenic-523
contaminated soils. Science of the Total Environment, The 284: 27–35.
524 525
7 Kachenko AG, Bhatia NP, Singh B, Siegele R. 2007. Arsenic hyperaccumulation and localization
526
in the pinnule and stipe tissues of the gold-dust fern (Pityrogramma calomelanos (L.) Link var.
527
austroamericana (Domin) Farw.) using quantitative micro-PIXE spectroscopy. Plant and Soil 300:
528
207–219.
529 530
8 Chen, T., Li, H., Lei, M., Wu, B., Song, B., Zhang, X., 2010. Accumulation of N, P and K
531
in Pteris vittata L. during phytoremediation: a five-year field study. Acta Sci.
532
Circumstantiae 30, 402e408.
533 534
9 Xie Q-E, Yan X-L, Liao X-Y, Li X. 2009. The Arsenic Hyperaccumulator Fern Pteris vittata L.
535
Environmental Science & Technology 43: 8488–8495.
536 537
10 Iriel, A., Lagorio, M.G., Cirelli, A.F., 2015. Biosorption of arsenic from groundwater using
538
Vallisneria gigantea plants. Kinetics, equilibrium and photophysical considerations. Chemosphere
539
138, 383e389.
540 541
11 Vetterlein, D., Wesenberg, D., Nathan, P., Bräutigam, A., Schierhorn, A., Mattusch, J., Jahn, R.,
542
2009. Pteris vittata Revisited: Uptake of As and ist speciation; impactof P, role of phytochelatins and
543
S. Environ. Pollut. 157, 3016-3023
544 545
12 Poynton CY, Huang JW, Blaylock MJ, Kochian LV, Elless MP. 2004. Mechanisms of arsenic
546
hyperaccumulation in Pteris species: root As influx and translocation. Planta 219: 1080–1088.
547 548
13 Danh LT, Truong P, Mammucari R, Foster N. 2013. A Critical Review of the Arsenic Uptake
549
Mechanisms and Phytoremediation Potential of Pteris vittata. International Journal of
550
Phytoremediation 16: 429–453.
551 552
14 Li JT, Gurilian K, Wu LH, van der Ent A, Qiu RL, Baker AJM, Tang YT, Yang X, Shu WS.
553
2018. Arsenic, cadmium, copper, manganese, REE, selenium and zinc hyperaccumulator plants from
China: a synthesis on the current state of knowledge. Environmental Science & Technology 52, 21:
555
11980-11994.
556 557
15 Lombi E, Zhao FJ, Fuhrmann M, Ma LQ. 2002. Arsenic distribution and speciation in the fronds
558
of the hyperaccumulator Pteris vittata. New Phytologist 156: 195–203.
559 560
16 Chen TB, Huang ZC, Huang YY, Lei M. 2005. Distributions of arsenic and essential elements in
561
pinnule of arsenic hyperaccumulator Pteris vittata L. Science in China Series C-Life Sciences 48(1):
562
18-24.
563 564
17 Li WX, Chen TB, Chen Y, Lei M. 2005. Role of trichome of Pteris vittata L. in arsenic
565
hyperaccumulation. Science in China Series C-Life Sciences 48(2): 148–154.
566 567
18 Chen TB, Yan XL, Liao XY, Xiao XY, Huang ZC, Xie H, Zhai LM. 2005. Subcellular
568
distribution and compartmentalization of arsenic in Pteris vittata L. Chinese Science Bulletin 50(24):
569
2843–2849.
570 571
19 Datta R, Das P, Tappero R, Punamiya P, Elzinga E, Sahi S, Feng H, Kiiskila J, Sarkar D. 2017.
572
Evidence for exocellular Arsenic in Fronds of Pteris vittata. Scientific Reports 7: 579–8.
573 574
20 Huang ZC. Chen TB. Lei M. Liu YR. Hu TD. 2008. Difference of Toxicity and Accumulation of
575
Methylated and Inorganic Arsenic in Arsenic-Hyperaccumulating and -Hypertolerant Plants.
576
Environmental Science & Technology 42(14): 5106–5111.
577 578
21 Zhang, W. H.; Cai, Y.; Tu, C.; Ma, L. Q, 2002. Arsenic speciation and distribution in an arsenic
579
hyperaccumulating plant. Science of the Total Environment 300(1-3): 167–177.
580 581
22 Huang ZC, Chen TB, Lei M, Hu TD. 2004. Direct determination of arsenic species in arsenic
582
hyperaccumulator Pteris vittata by EXAFS. Acta Botanica Sinica 46(1): 46–50.
583 584
23 Kertulis GM, Ma, LQ, MacDonald GE, Chen R, Chen R, Winefordner JD, Cai Y. 2005. Arsenic
585
speciation and transport in Pteris vittata L. and the effects on phosphorus in the xylem sap.
586
Environmental and Experimental Botany 54 (3): 239–247.
587 588
24 Mathews S, Ma LQ, Rathinasabapathi B, Natarajan S, Saha UK. 2010. Arsenic transformation in
589
the growth media and biomass of hyperaccumulator Pteris vittata L. Bioresource Technology
590
101(21): 8024–8030.
591 592
25 Pickering IJ, Gumaelius L, Harris HH, Prince RC, Hirsch G, Banks JA, Salt DE, George GN.
593
2006. Localizing the Biochemical Transformations of Arsenate in a Hyperaccumulating Fern.
594
Environmental Science & Technology 40: 5010–5014.
595 596
26 Duan GL, Zhu YG, Tong YP, Cai C, Kneer R. 2005. Characterization of arsenate reductase in the
597
extract of roots and fronds of Chinese brake fern, an arsenic hyperaccumulator. Plant Physiology
598
138(1): 461–469.
599 600
27 Lei M, Wan XM, Huang ZC, Chen, TB, Li, XW, Liu YR. 2012. First evidence on different
601
transportation modes of arsenic and phosphorus in arsenic hyperaccumulator Pteris vittata.
602
Environmental Pollution 161: 1–7.
603 604
28 Wan X, Lei M, Chen T, Ma J. 2017. Micro-distribution of arsenic species in tissues of
605
hyperaccumulator Pteris vittata L. Chemosphere 166: 389–399.
606 607
29 Su YH, McGrath SP, Zhu YG, Zhao FJ. 2008. Highly efficient xylem transport of arsenite in the
608
arsenic hyperaccumulator Pteris vittata. New Phytologist 180: 434–441.
609 610
30 Wan X, Lei M, Chen TB. 2016. Interaction of As and Sb in the hyperaccumulator Pteris vittata
611
L.: changes in As and Sb speciation by XANES. Environmental Science and Pollution Research: 1–
612
9.
613 614
31 Caille N, Zhao FJ, McGrath SP. 2004. Comparison of root absorption, translocation and tolerance
615
of arsenic in the hyperaccumulator Pteris vittata and the nonhyperaccumulator Pteris tremula. New
616
Phytologist 165: 755–761.
617 618
32 de Jonge MD, Vogt S. 2010. Hard X-ray fluorescence tomography-an emerging tool for structural
619
visualization. Current Opinion in Structural Biology 20: 606–614.
620 621
33 van der Ent A, Przybyłowicz WJ, de Jonge MD, Harris HH, Ryan CG, Tylko G, Paterson DJ,
622
Barnabas AD, Kopittke PM, Mesjasz-Przybyłowicz J. 2017. X-ray elemental mapping techniques for
623
elucidating the ecophysiology of hyperaccumulator plants. New Phytologist 218: 432–452.
624 625
34 Kanngiesser B, Malzer W, Reiche I. 2003. A new 3D micro X-ray fluorescence setup — first
626
archaeometric applications. Nuclear Instruments and Methods in Physics Research Section B 211:
627
259–264.
628 629
35 Janssens K, Proost K, Falkenberg G. 2004. Confocal microscopic X-ray fluorescence at the
630
Hasylab microfocus beamline: characteristics and possibilities. Spectrochimica Acta Part B 59(533):
631
1637–1645.
632 633
36 Vincze L, Vekemans B, Brenker FE, Falkenberg G, Rickers K, Somogyi, Kersten SM, Adams F.
634
2004. Three dimensional trace element analysis by confocal X-ray microfluorescence imaging.
635
Analytical Chemistry 76: 6786–6791.
636 637
37 Chukalina M, Simionovici A, Zaitsev S, Vanegas CJ. 2007. Quantitative comparison of X-ray
638
fluorescence microtomography setups: Standard and confocal collimator apparatus. Spectrochimica
639
Acta Part B: Atomic Spectroscopy 62: 544–548.
640 641
38 Choudhury S, Thomas JK, Sylvain NJ, Ponomarenko O, Gordon RA, Heald SM, Janz DM, Krone
642
PH, Coulthard I, George GN, Pickering IJ. 2015. Selenium Preferentially Accumulates in the Eye
643
Lens Following Embryonic Exposure: A Confocal X-ray Fluorescence Imaging Study.
644
Environmental Science & Technology 49: 2255–2261.
645 646
39 Kopittke PM, Menzies NW, de Jonge MD, McKenna BA, Donner E, Webb RI, Paterson DJ,
647
Howard DL, Ryan CG, Glover CJ, Scheckel KG, Lombi E. 2011. In Situ Distribution and Speciation
648
of Toxic Copper, Nickel, and Zinc in Hydrated Roots of Cowpea. Plant Physiology 156: 663–673.
649 650
40 Lombi E, de Jonge MD, Donner E, Kopittke PM, Howard DL, Kirkham R, Ryan CG, Paterson D.
651
2011. Fast X-Ray Fluorescence Microtomography of Hydrated Biological Samples (JM Schnur,
652
Ed.). PLoS ONE 6: e20626–5.
653 654
41 McNear DH Jr, Peltier E, Everhart J, Chaney RL, Sutton S, Newville M, Rivers M, Sparks DL.
655
2005. Application of quantitative fluorescence and absorption-edge computed microtomography to
656
image metal compartmentalization in Alyssum murale. Environmental Science & Technology 39:
657
2210–2218.
658 659
42 Kim SA, Punshon T, Lanzirotti A, Li L, Alonso JM. 2006. Localization of iron in Arabidopsis
660
seed requires the vacuolar membrane transporter VIT1. Science 314: 1295–1298.
661 662
43 Kopittke PM, Punshon T, Paterson DJ, Tappero RV, Wang P, Blamey FPC, van der Ent A,
663
Lombi E. 2018. Synchrotron-Based X-Ray Fluorescence Microscopy as a Technique for Imaging of
664
Elements in Plants. Plant Physiology 178: 507–523.
665 666
44 Tylko G, Mesjasz-Przybyłowicz J and Przybyłowicz WJ. 2007. X-ray microanalysis of biological
667
material in the frozen-hydrated state by PIXE. Microscopy Research and Technique 70: 55–68.
668 669
45 Wang YD, Mesjasz-Przybylowicz J, Tylko G, Barnabas AD, Przybylowicz WJ. 2013.
Micro-670
PIXE analyses of frozen-hydrated semi-thick biological sections Nuclear Instruments and Methods
671
in Physics Research Section B: Beam Interactions with Materials and Atoms 306: 134–139.
672 673
46 George GN, Pickering IJ, Pushie MJ, Nienaber K, Hackett MJ, Ascone I, Hedman B, Hodgson
674
KO, Aitken JB, Levina A, Glover C, Lay PA. 2012. X-ray-induced photo-chemistry and X-ray
675
absorption spectroscopy of biological samples. Journal of Synchrotron Radiation 19: 875–886.
676 677
47 Wang P, McKenna BA, Menzies NW, Li C, Glover CJ, Zhao F-J, Kopittke PM. 2019.
678
Minimizing experimental artefacts in synchrotron based X-ray analyses of Fe speciation in plant
679
tissues of rice plants. Journal of Synchrotron Radiation 26. DOI: 10.1107/S1600577519004351
680 681
48 Paterson DJ, De Jonge MD, Howard DL, McKinlay WLJ, Starritt A, Kusel M, Ryan CG,
682
Kirkham R, Moorhead G, Siddons DP. 2011. The x-ray fluorescence microscopy beamline at the
683
Australian synchrotron. AIP Conf. Proc. 1365, 219.
684 685
49 Schroeder W, De Samber B. 2014. A Cryogenic Sample Environment for the Analysis of Frozen
686
Hydrated Biological Tissue at the Hard X-ray Micro/Nano-Probe Beamline P06 at PETRA III.
687
Photon Science.
50 Kirkham R, Dunn PA, Kucziewski A, Siddons DP, Dodanwela R, Moorhead GF, Ryan CG, De
689
Geronimo G, Beuttenmuller R, Pinelli D, Pfeffer M, Davey P, Jensen M, Paterson D, de Jonge MD,
690
Kusel M and McKinlay J, 2010, The Maia Spectroscopy Detector System: Engineering for
691
Integrated Pulse Capture, Low-Latency Scanning and Real-Time Processing, AIP Conference series
692
1234: 240–243.
693 694
51 Siddons DP, Kirkham R, Ryan CG, De Geronimo G, Dragone A, Kuczewski AJ, Li ZY, Carini
695
GA, Pinelli D, Beuttenmuller R, Elliott D, Pfeffer M, Tyson TA, Moorhead GF, Dunn PA 2014.
696
Maia X-ray Microprobe Detector Array System. Journal of Physics: Conference Series 499:
697
012001–10.
698 699
52 Ryan CG, Kirkham R, Hough RM, Moorhead G, Siddons DP, de Jonge MD, Paterson DJ, De
700
Geronimo G, Howard DL, Cleverley JS. 2010. Elemental X-ray imaging using the Maia detector
701
array: The benefits and challenges of large solid-angle. Nuclear Instruments and Methods in Physics
702
Research Section A: Accelerators, Spectrometers, Detectors and Associated Equipment 619: 37–43.
703 704
53 Ryan CG, Siddons DP, Kirkham R, Li ZY, de Jonge MD, Paterson DJ, Kuczewski A, Howard
705
DL, Dunn PA, Falkenberg G, Boesenberg U, De Geronimo G, Fisher LA, Halfpenny A, Lintern MJ,
706
Lombi E, Dyl KA, Jensen M, Moorhead GF, Cleverley JS, Hough RM, Godel B, Barnes SJ, James
707
SA, Spiers KM, Alfeld M, Wellenreuther G, Vukmanovic Z, Borg S. 2014. Maia X-ray fluorescence
708
imaging: Capturing detail in complex natural samples. Journal of Physics: Conference Series 499:
709
012002–12.
710 711
54 Ryan CG, Cousens DR, Sie SH, Griffin WL. 1990. Quantitative analysis of PIXE spectra in
712
geoscience applications. Nuclear Instruments and Methods in Physics Research Section B: Beam
713
Interactions with Materials and Atoms 49: 271–276.
714 715
55 C.G. Ryan, B.E. Etschmann, S. Vogt, J. Maser, C.L. Harland, E. van Achterbergh and D. Legnini,
716
(2005), "Nuclear Microprobe – Synchrotron Synergy: Towards Integrated Quantitative Real-time
717
Elemental Imaging using PIXE and SXRF", Nucl. Instr. Meth. B231, 183-188.
718 719
56 Ryan CG, Jamieson DN. 1993. Dynamic analysis: on-line quantitative PIXE microanalysis and its
720
use in overlap-resolved elemental mapping. Nuclear Instruments and Methods in Physics Research
721
Section B: Beam Interactions with Materials and Atoms 77: 203–214.
57 Ryan CG. 2000. Quantitative trace element imaging using PIXE and the nuclear microprobe.
723
International Journal of Imaging Systems and Technology 11(4): 219–230.
724 725
FIGURE CAPTIONS 726
727
Figure 1. Experimental setup at the XFM beamline of the Australian Synchrotron: [A] Schematic 728
diagram of confocal probe, SDD – silicon drift detector (image by Gary Ruben) [B] frozen-hydrated
729
sample under the cryo-stream in front of the Maia detector; [C] Frozen-hydrated samples probed
730
with the confocal optic; [D] Maia planar imaging at room temperature of a large live frond still
731
attached to the plant (with rhizome in pouch with moist cotton). Typical dimensions of the probe
732
beam are ~1 µm, those of the confocal field of view are ~10 um, and the specimen thickness is in the
733
>100 µm domain.
734 735
Figure 2. Toluidine blue stained Pteris vittata sections: [clockwise from top left] section of the 736
rachis; section of the central part of the frond; unstained and stained sections of the sporophytes
737
attached to the frond. Abbreviations: LE lower epidermis, UE upper epidermis, C cortex, P pamenta,
738
VB vascular bundle, Ct cuticle, H hypodermis, M mesophyll, X xylem, E endodermis, Pe pericycle,
739
Ph phloem, R receptacle, I false indusium, Ha hair, Ys young sporangium, Ms mature sporangium, A
740
annulus, S stomium.
741 742
Figure 3. Scanning Electron Microscopy (SEM) images of Pteris vittata tissues: [A] sporangium 743
enclosures within the margin of the frond (indusium); [B] detail of sporophytes showing [C] vascular
744
bundles of the rachis; [D] detail of central xylem bundles.
745 746
Figure 4. Planar µXRF maps of Ca, K and As of a live Pteris vittata frond examined at room 747
temperature. Relative concentrations are depicted by shading with brighter colours equating to higher
748
concentrations ('heatmap').
749 750
Figure 5. Planar µXRF maps of Ca, K, As and Compton Scatter of the terminal ends of a live Pteris 751
vittata frond examined at room temperature. Relative concentrations are depicted by shading with
752
brighter colours equating to higher concentrations ('heatmap').
753 754
Figure 6. Confocal µXRF virtual section elemental maps of As in Pteris vittata fronds (central 755
part/rachis). Panels: [A] freeze-dried f examined at room temperature; [B] frozen-hydrated examined
756
under the cryostream; [C] freeze-dried f examined at room temperature; [D] frozen-hydrated
757
examined under the cryostream. Relative concentrations are depicted by shading with brighter
758
colours equating to higher concentrations ('heatmap').
Figure 7 Single-slice µXRF tomogram of a freeze-dried Pteris vittata rachis examined at room 760
temperature showing As and Compton signals. Relative concentrations are depicted by shading with
761
brighter colours equating to higher concentrations ('heatmap').
762 763
Figure 8. Single-slice µXRF tomograms of a freeze-dried Pteris vittata pinnule margin inside a 764
Kapton capillary examined at room temperature showing As and Compton signals. Relative
765
concentrations are depicted by shading with brighter colours equating to higher concentrations
766
('heatmap').
767 768
Figure 9. 2D µXRF maps of a freeze-dried Pteris vittata pinnule margin inside a Kapton capillary 769
examined at room temperature showing As and Compton signals from different angles. Relative
770
concentrations are depicted by shading with brighter colours equating to higher concentrations
771
('heatmap').
772 773
Figure 10. Left: As elemental map of a portion of Pteris vittata pinnule including midvein and leaf 774
margin, taken at the top energy of the 2D XANES imaging scan (12.1 keV). Middle: composite of
775
cluster maps generated by k-means clustering analysis with k = 3. Cluster 1 is shown and blue and
776
cluster 2 is shown in red, the third cluster associated with the image background has been set to
777
white. Right: the spectra of cluster 1 and cluster 2 reconstructed from principal components
778
compared to reference As standards. The sample is frozen-hydrated examined under the cryostream.
779
Relative concentrations are depicted by shading with brighter colours equating to higher
780 concentrations ('heatmap'). 781 782 783 784 785 786
![Figure 1. Experimental setup at the XFM beamline of the Australian Synchrotron: [A] Schematic 821](https://thumb-eu.123doks.com/thumbv2/123doknet/14783544.597710/29.892.91.808.112.618/figure-experimental-setup-xfm-beamline-australian-synchrotron-schematic.webp)
![Figure 2. Toluidine blue stained Pteris vittata sections: [clockwise from top left] section of the 832](https://thumb-eu.123doks.com/thumbv2/123doknet/14783544.597710/30.892.162.732.107.934/figure-toluidine-stained-pteris-vittata-sections-clockwise-section.webp)
![Figure 3. Scanning Electron Microscopy (SEM) images of Pteris vittata tissues: [A] sporangium 840](https://thumb-eu.123doks.com/thumbv2/123doknet/14783544.597710/31.892.82.818.104.719/figure-scanning-electron-microscopy-pteris-vittata-tissues-sporangium.webp)