International Journal of Advanced Remote Sensing and GIS 2018, Volume 7, Issue 1, pp. 2835-2849
ISSN 2320 – 0243, Crossref: 10.23953/cloud.ijarsg.381
______________________________________________________________________________________________________
Mapping Change Detection of LULC on the Cameroonian Shores of
Lake Chad and its Hinterland through an Inter-Seasonal and
Multisensor Approach
Paul Gérard Gbetkom1, 2, Sébastien Gadal1, Ahmed El Aboudi2, Alfred Homère Ngandam Mfondoum3, Mamane Barkawi Mansour Badamassi2
1
Aix-Marseille Univ, CNRS, ESPACE UMR 7300, Univ Nice Sophia Antipolis, Avignon Univ, 13545 Aix-en- Provence, France
2
Laboratory of Botanic, Mycology and Environment, University Mohammed V Rabat, 1014, 4 avenue ibn battouta Rabat, Morocco
3
Stats N’ Maps, Private Consulting Firm, 13015 Audelia road, suite 9128, Dallas, Texas, USA Publication Date: 12 September 2018
Correspondence should be addressed to Paul Gérard Gbetkom, paul-gerard.gbetkom@etu.univ-amu.fr
DOI: https://doi.org/10.23953/cloud.ijarsg.381
Copyright © 2018 Paul Gérard Gbetkom, Sébastien Gadal, Ahmed El Aboudi, Alfred Homère Ngandam Mfondoum,Mamane Barkawi Mansour Badamassi. This is an open access article distributed under the Creative Commons Attribution License, which permits unrestricted use, distribution, and reproduction in any medium, provided the original work is properly cited.
Abstract The aim of this study is to assess the land use/land cover (LULC) inter-seasonal changes
along the Cameroonian shores of Lake Chad and its hinterland using the four generations of Landsat sensors images of MSS, TM, ETM+ and OLI. Identification of land use/land cover inter-seasonal changes is based on classification by Support Vector Machines (SVMs) algorithm. Three major spatial classes of objects are identified: open water, vegetation and marshlands, and bare soils. The results show that, bare soils class has the higher rate, and can reach 67.57% of the study area extent. Moreover, land use/land cover change from one season to another or from one decade to another can be closely linked to evolution of climate conditions. Then open water areas vary little with rate of 1.94% and 7.6% for inter-seasonal changes, and rate of 5.62% and 63.05% for inter-annual changes. Compared to open water, vegetation and marshlands has the most important variation, that is 583.59%. In addition, proportions of bare soils that vary are different between dry seasons and rainy seasons, with a lower and a higher rate of 5.38% and 82.8%. This leads to the conclusion that occupation in the study area is dominated by bare soils principally; occupation class that is most affected by changes is vegetation and marshlands followed by bare soils and then open water and marshlands.
Keywords Inter-seasonal changes; LULC; Lake Chad; Support vector machines 1. Introduction
Land use/land cover (LULC) changes play a major role in the study of environment change (Reis, 2008), (Vitousek, 1992). Changes in land cover and the way people use the land have some modifications on the state of natural resources. Some of these modifications are deforestation, desertification, biodiversity loss, global warming and increase of natural disaster-flooding (Reis, 2008). During the last four decades, remote sensing and GIS technology has enabled ecologists and natural
International Journal of Advanced Remote Sensing and GIS
2836
resources managers to acquire timely data (Billingsley, 1984) and observe periodical changes in ecosystems with their habitats and associated components (Muzein, 2006), (Mobaied et al., 2011). Data from satellite sensors has become an important tool for researchers studying land use and land cover change (Szuster, Chen and Borger, 2011); and remote sensing is a valuable data source from which land-use/land-cover change information can be extracted efficiently (Chen et al., 2003).
The Lake Chad has experienced a long history of wet and dry periods covering several timescales, ranging from the geological, to the annual and to the seasonal (J. Lemoalle, Magrin, and Institut de recherche pour le développement (France) 2014). Despite the physiognomic analysis of the lake by scientists, using hydrological data, field observation and satellite imagery (Rangé, 2016), (Olivry, 1996), (Magrin 2015), (Geerken, Vassolo, and Bila, 2010), some interpretations of evolution of the lake Chad land cover are still inaccurate (Lemoalle, 2014). This is the case of marshland flooded, which are difficult to identify on satellite imagery and therefore, not sufficiently taken into account when estimating the lake surface (Rangé, 2016). Actually, concerning « Little Chad » (Tilho, 1928), (Olivry 1996), (Magrin 2015), draws schematic map of lake Chad’s average situation around 2010, on which it can be observed that Cameroonian side is occupied by permanent open water, almost permanent marshland, marshland that is irregularly flooded and areas not flooded since 1963.
The cartography of land use/land cover evolution of the said side proposed by Rangé between 1950 to 2000 enabled to observe that main land use/land cover classes are constituted by open water, marshland, non-flooded land, and dry land.
Therefore, this paper’s aim is to classify the land use/land cover in the Cameroonian shores of Lake
Chad and its hinterland during wet and dry seasons for decades 1970, 1980, 2000 and 2010.
2. Materials and Methods The study area
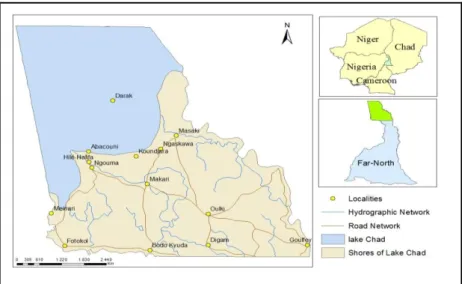
The Cameroonian shore of lake Chad and its hinterland are located in the northern part of the country, between latitude 12°N to 13°N and meridian 14°E to 15°E, and cover a total land area of 474902 Ha. The northern and eastern boundaries of study area are with Chad republic, the western boundaries are share with federal republic of Nigeria, and the southern area is in Cameroon (Figure 1). This part of the Sahel is a semi-arid region (Okonkwo, Demoz, and Gebremariam, 2014) with a dry tropical climate. The annual seasonality is divided in a rainy season from June to October and a dry season from November to may (RIM, 2008). The annual rainfall ranges around 400mm, the thermal amplitude is 7.7°C, while the average monthly temperature is 28°C (Seignobos and Iyébi-Mandjek, 2000).
International Journal of Advanced Remote Sensing and GIS
2837
Data description
Two types of data source are used to:
The vector layer of national, regional and department boundaries, hydrography system, localities repartitions, and road network of the study area. Some of these layers are the propriety of GADM developed by Robert Hijmans (University of California), and other layers were found in the topographic map of Cameroonian far north region at scale 1/650,000, sourced from French Research Institute for Development (Seignobos and Iyébi-Mandjek, 2000). These vector layers serve to delimit the study area.
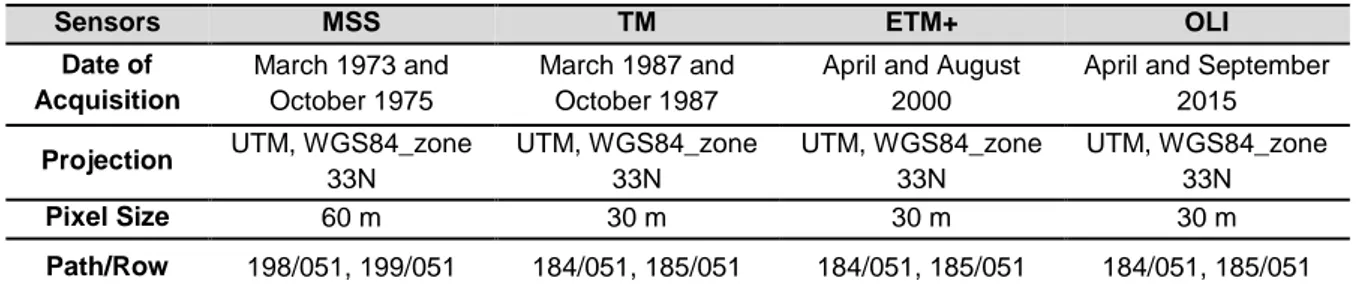
The Landsat satellite images of the study area at 60m and 30m of spatial resolution (path and row:
185/051 and 185/052). These images are from MSS (March 1973 and October 1975), TM (March and October 1987), ETM+ (April and August 2000) and OLI (April and September 2015) sensors, and were downloaded from the website of USGS (Table 1). All visible and infrared bands were included for the analysis. Their selection is done such a way that dry season and rainy season images can enhance the assessment of inter-seasonal changes for the same year (1987, 2000 and 2010), and diachronic or inter-annual changes from one year to another. However, the unavailability and quality (clouds cover) of some images to match the exact month of a season between two years or decades, has influenced the choice of data from different years (for example: March 1973 and October 1975). Intervals amongst satellites images vary from four months to seven months for data used to show inter-seasonal land cover changes. Concerning images used for inter-annual land cover changes, the intervals are between twelve to fifteen years.
Table 1: Characteristics of scenes used
Sensors MSS TM ETM+ OLI
Date of Acquisition March 1973 and October 1975 March 1987 and October 1987
April and August 2000
April and September 2015
Projection UTM, WGS84_zone 33N UTM, WGS84_zone 33N UTM, WGS84_zone 33N UTM, WGS84_zone 33N Pixel Size 60 m 30 m 30 m 30 m Path/Row 198/051, 199/051 184/051, 185/051 184/051, 185/051 184/051, 185/051 Processing
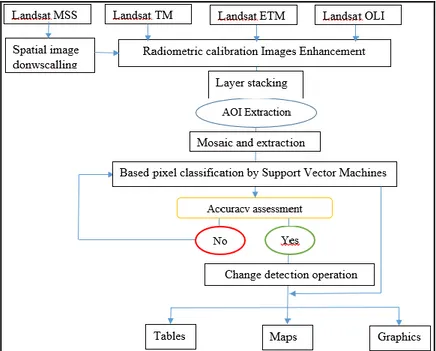
Software Erdas Imagine 2015 and Arcgis 10.5 have been used for the processing. First off, the radiometric calibration and atmospheric corrections have been done using (Chavez, 1996) low COST method (Chander, Markham and Helder, 2009); then a mosaic of the concerned scenes; and the spectral grouping of spatial objects known as classification, using its internal algorithm.
On the other hand, software has been mainly used for the layout of data on readable format. Concerning the diachronic mapping, many images data sources should be combined to show the level of land change at vastly different temporal scales (Salvati and Tombolini, 2014), (Olokeogun, Iyiola and Iyiola, 2014). In this study eight images data have been used at eight sequences of time, wet season and dry season in decades 1970, 1980, 2000 and 2010. The representation of lake Chad by using satellite imagery offer the possibility to distinguish open water, dune archipelago, marshland, dried surfaces resulting of falling water level (Rangé, 2016).
For this study, the dynamic of land use/land cover within the study area is done by mapping three main classes of land use/land cover, open water, vegetation and marshland, and bare soils. Open water are constituted of water observed at any time of the year and are principally located in the north west of the study area. The class of vegetation and marshland class is constituted with aquatic grasses meadows, which grow on hydromorphic soils and vegetated by submerged plant species. This class
International Journal of Advanced Remote Sensing and GIS
2838
also includes all types of vegetation cover from the dense to the most scattered, dominated by meadows and grassy savannas (Martin, 1962). Bare soils are areas where vegetation does not exist or is very weakly present.
We have used the process of spectral parametric classification through Support Vector Machines (SVM) algorithm, and then follow by the post-classification comparison.
Indeed SVMs are supervised learning algorithms based on statistical learning theory, and his aim for classification is to determine a hyperplane that optimally separates classes (Srivastava et al., 2012), (Gunn, 1998), (Zhang, 2012). They have often been found to provide better classification results that other widely used pattern recognition methods, such as the maximum likelihood and neural network classifiers (Melgani and Bruzzone, 2004), (Theodoridis and Koutroumbas, 2008), (Tzotsos and Argialas, 2008).
The step-by-step approach (methodology) taken to achieve the stated objectives of this project are the following (Figure 2).
Figure 2: Flowchart of the methodology
3. Results
Land use/land cover mapping and distribution
The final classification maps provide an overview of the major land use/land cover features of Cameroonian shores of Lake Chad and its hinterland for the periods of March 1973, October 1975, March 1987, October 1987, April 2000, August 2000, April 2015 and September 2015. Three classes of land use/land cover were identified (open water; vegetation and marshland; and bare soils) and the Support Vector Machines classification were implemented for all of the concerned images. Figure 3 illustrate the land use/land cover maps of Cameroonian part of Lake Chad at the dry season (March 1973, march 1987, April 2000 and April 2015), and Figure 4 illustrates it at the wet season (October 1972, October 1987, August 2000 and September 2015).
International Journal of Advanced Remote Sensing and GIS
2839
Figure 3: Dry seasons classification maps
Figure 4: Rainy seasons classification maps
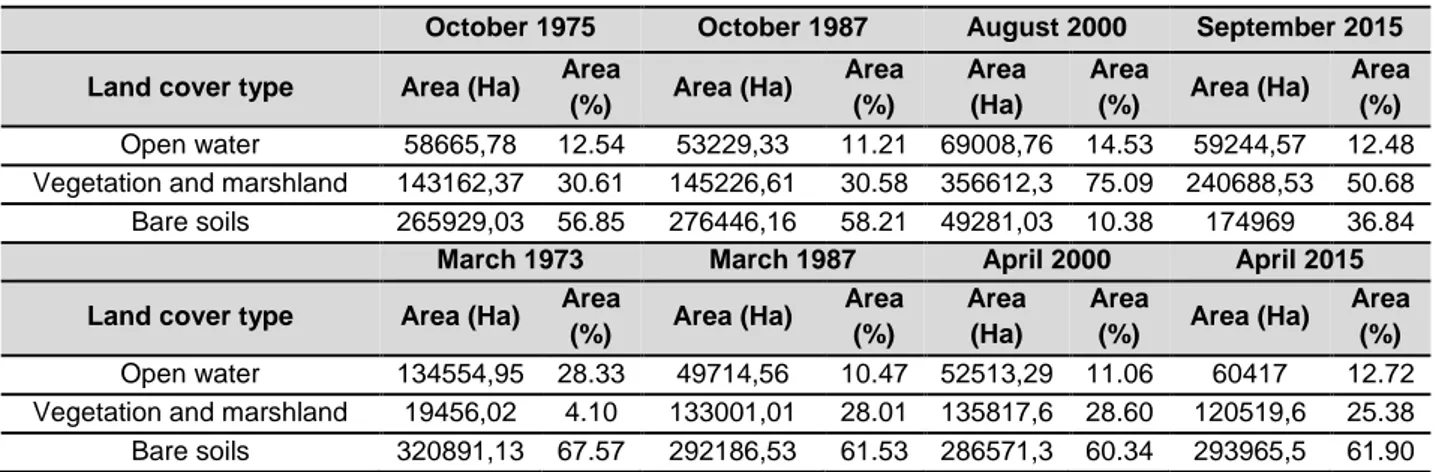
It appears in Table 2 the spatial extent of land cover in hectares and in percentages, for rainy and dry season. Open water has an average coverage between 49714,56 Ha (10.47%) to 69008,76 Ha (14.53%) except in march 1973 when this coverage increased to 134554,95 Ha (28.33%). Except in March 1973, vegetation, occupies more than one quarter of LULC during the rainy season and the dry season, with areas extent between 120519,6 Ha to 356612,3 Ha, which corresponds to percentages between 25.38% to 75.09%.
Bare soils largely dominate land use/land cover whatever the season except in August 2000 with 49281,03 Ha (10.38%) and September 2015 with 174969 Ha (36.84%). For the rest, the extent of this class is more than half of the study area with an occupation exceeding 56.85% (265929,03 Ha).
International Journal of Advanced Remote Sensing and GIS
2840
Table 2: Spatial extent of land cover
October 1975 October 1987 August 2000 September 2015
Land cover type Area (Ha) Area
(%) Area (Ha) Area (%) Area (Ha) Area (%) Area (Ha) Area (%) Open water 58665,78 12.54 53229,33 11.21 69008,76 14.53 59244,57 12.48 Vegetation and marshland 143162,37 30.61 145226,61 30.58 356612,3 75.09 240688,53 50.68 Bare soils 265929,03 56.85 276446,16 58.21 49281,03 10.38 174969 36.84
March 1973 March 1987 April 2000 April 2015
Land cover type Area (Ha) Area
(%) Area (Ha) Area (%) Area (Ha) Area (%) Area (Ha) Area (%) Open water 134554,95 28.33 49714,56 10.47 52513,29 11.06 60417 12.72 Vegetation and marshland 19456,02 4.10 133001,01 28.01 135817,6 28.60 120519,6 25.38 Bare soils 320891,13 67.57 292186,53 61.53 286571,3 60.34 293965,5 61.90
Land change mapping and evolution
Land use/land cover change mapping
The following graph on Figure 5, represents the statistics of the inter-seasonal evolution of LULC. To realize this, two different seasonal images are combined. The images of dry season (March and April) and those from rainy season (august September and October). Consequently, for these three periods, the results enhance the changes from dry season to rainy season (Figure 6).
It is observed that there was a slight increase in size of open water and marshland area by 7% between march 1987 to October 1987 and 31.41% in year 2000. In 2015, the size of open water and marshland didn’t change significantly but corresponds to a decrease of 1.94%. In terms of spatial extent, the variations of open water and marshland for these three periods correspond respectively to: an augmentation of 3514,77 Ha, an increase of 16495,47 Ha, and a decrease of 1172,43 Ha.
The size of vegetation area is logically increased from dry season to rainy season. In numerical terms this translate by an enhance of 9.19% in 1987, 162.56% and 99.7% respectively between, April 2000 to August 2000 and April 2000 to September 2015. In others words, the difference in spatial surface of vegetation between March and October 1987 represents an increase of 12225,6 Ha. This difference corresponds to a supplement of 220794,75 Ha from April to august 2000 and 120168,9 Ha from April to September 2015.
Concerning bare soils, they decrease from dry season to rainy season. Particularly in 2000 and 2015 where the reduction of their surfaces is more than 80% in 2000 and more than 40% in 2015. Concretely, for these three periods of time the surface of bare soils decreases by: 15740,37 Ha between March and October 1987; 237290,22 Ha between April and August 2000 and 118996,47 Ha from April to September 2015.
International Journal of Advanced Remote Sensing and GIS
2841
Figure 5: Graph of the inter-seasonal evolution of LULC
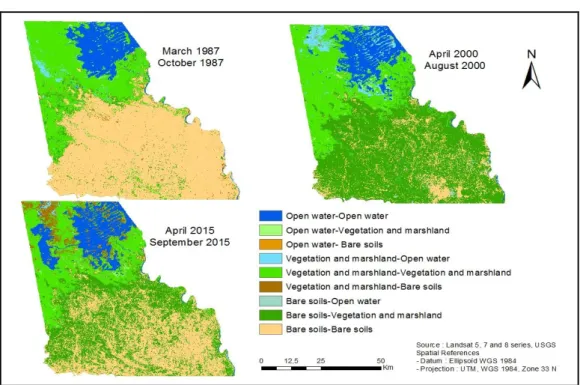
Figure 6: Map of the inter-seasonal evolution of LULC
Land use/land cover change evolution between dry season
The area extent of the Land use/land cover change and its evolution between dries seasons is shown in the three periods (Figure 7). At the first period between March 1973 to March 1987, it was principally observed a large increase in size of vegetation area by 583.5% (113544,99 Ha), and a reduce of open water and marshland area by 63.05% (84840,39 Ha).
The two others periods (March 1987-April 2000; and April 2000-April 2015) are more stables, with changes of not more than 15% per classes. Thus, from March 1987 to April 2000 there are an increase of size of open water and marshland and vegetation area by 5.62% (2798,73 Ha) and 2.11% (2816,55 Ha) respectively, and a slight decrease of bare soils surface by 1.9% (5615,28 Ha). During the last interval from April 2000 to April 2015, there is a raise of open water and marshland area by
International Journal of Advanced Remote Sensing and GIS
2842
15.05% (7903,71 Ha), drop of vegetation area by 11.26% (15297,93 Ha) and low increase of bare soils surface by 2.58% (7394,22 Ha).
Figure 7: Graph of LULC change evolution between dry seasons
The maps of changes detections of the dries seasons can be seen in Figure 8 and values contained in Table 3 are used to illustrate these changes. At the interval corresponding from March 1973 to March 1987, the most important changes concern transformation of: open water and marshland to vegetation for 82007,28 Ha; bare soils to vegetation for 37488,51 Ha; vegetation to bare soils for 5833,62 Ha; and open water and marshland to bare soils for 3306,33 Ha. That is respectively a rate of change of 17.27%; 7.89%; 1.23% and 0.70%.
Table 3: Spatial extent of land cover change between dry season
March 1973 March 1987 March 1987 April 2000 April 2000 April 2015
Classes Area (Ha) Area
(%)
Area (Ha) Area (%)
Area (Ha) Area (%) Open water - Open water 49241,34 10.37 39936,87 8.41 42986,34 9.05 Open water - Vegetation and
marshland
82007,28 17.27 9689,31 2.04 8706,87 1.83
Open water - Bare soils 3306,33 0.70 88,38 0.02 820,08 0.17
Vegetation and marshland - Open water
117,18 0.02 11447,82 2.41 17290,89 3.64
Vegetation and marshland -Vegetation and marshland
13505,22 2.84 108408,24 22.83 106337,7 22.39
Vegetation and marshland -Bare soils 5833,62 1,23 13144,95 2,77 12188,97 2,57
Bare soils-Open water 356,04 0,07 1128,6 0,24 139,77 0,03
Bare soils-Vegetation and marshland 37488,51 7,89 17720,01 3,73 5475,06 1,15 Bare soils-Bare soils 283046,58 59,60 273337,92 57,56 280956,42 59,16
Then, between March 1987 to April 2000 (13 years), principals’ modifications are transformation of bare soils to vegetation 17720,01 Ha (which represent 3.73%), transformation of vegetation to bare soils with 13144,95 Ha (2.77%), transformation of vegetation to open water and marshland with 11447,82 Ha (2.41%), transformation of open water and marshland to vegetation for 9689,31 Ha (2.04%).
International Journal of Advanced Remote Sensing and GIS
2843
Changes happen during April 2000 to April 2015 are principally transformation of vegetation to open water and marshland, transformation of vegetation to bare soils, transformation of open water and marshland to vegetation, and transformation of bare soils to vegetation. Then, these transformations correspond respectively at the rate of changes of 3.64% (17290,89 Ha), 2.57% (12188,97 Ha), 1.83% (8706,87 Ha) and 1.15% (5475,06).
Figure 8: Map of LULC change evolution between dry seasons
Land use/land cover change evolution between rainy season
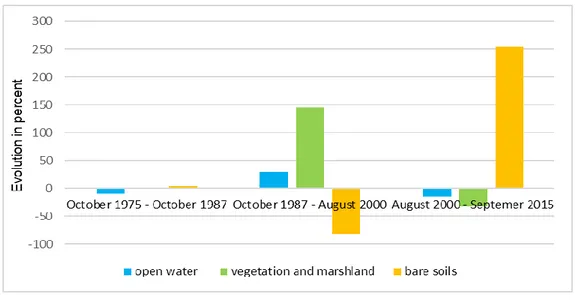
The evolution trends of LULC surface area during rainy season in the study area during the three periods of observations shows what follows (Figure 9). The open water and marshland surface affected by changes is the least variable compared with the surface of other classes of occupation. So between October 1975 and October 1987 open water and marshland surface decrease by 5436,45 Ha, this surface increase by 15779,43 Ha between October 1987 to august 2000 and decrease again by 9764,19 Ha between August 2000 to September 2015. In terms of percentages this corresponds to a decrease of 9.02%, an increase of 29.64%, and a diminution of 14.14% of open water and marshland.
Concerning vegetation, the surfaces affected by changes have more varied proportions than those of open water and marshland. There was a slight increase of surface by 2064,24 Ha (1.4%) between October 1975 to October 1987, an enhanced of 211385,7 Ha (145.55%) between October 1987 to August 2000 and finally, a decrease of 115923,78 Ha (32.50%) during period from August 2000 to September 2015.
Unlike to the vegetation, the surface of bare soils concerned by changes increase over time. It can be observed that an augmentation of 10517,13 Ha (3.95%) at the first period, a decrease of 227165,13 Ha (82.17%) at the second period and an enhance of 125687,97 Ha (255.04%) at the third period.
International Journal of Advanced Remote Sensing and GIS
2844
Figure 9: Graph of LULC change evolution between rainy seasons
Table 4: Spatial extent of land cover change between rainy season
October 1975 October 1987 October 1987 August 2000 August 2000 September 2015
Classes Area (Ha) Area
(%)
Area (Ha) Area (%)
Area (Ha) Area (%)
Open water - Open water 46484,28 9.94 43649,82 9.19 44974,08 9.47 Open water - Vegetation and
marshland
9552,06 2.04 9437,94 1.99 10843,02 2.28
Open water - Bare soils 2611,44 0.56 141,57 0.03 13191,66 2.78 Vegetation and marshland -
Open water
5119,29 1.09 21462,66 4.52 13912,74 2.93
Vegetation and marshland - Vegetation and marshland
112921,2 24.15 121830,66 25.65 220133,34 46.35
Vegetation and marshland - Bare soils
25074,63 5.36 1933,29 0.41 122566,23 25.81
Bare soils - Open water 1233,72 0.26 3896,28 0.82 357,75 0.08 Bare soils - Vegetation and
marshland
16125,75 3.45 225343,71 47.45 9712,17 2.05
Bare soils-Bare soils 248480,19 53.14 47206,17 9.94 39211,11 8.26
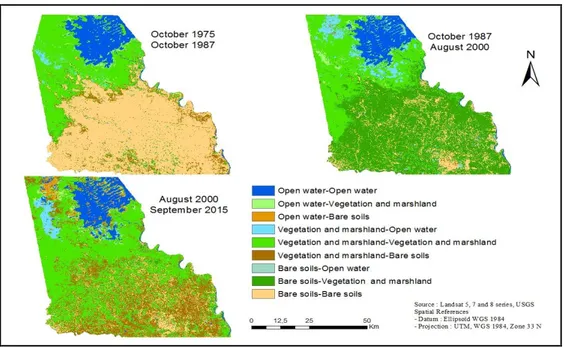
Figure 10 and Table 4 describe respectively the map evolutions of Land use/land cover change between rainy seasons and statistics of these changes. During the interval from October 1975 to October 1987, changes between the three LULC classes are slight compared with the two other intervals. This results into more or less balanced changes from one occupation class to another. The most important changes are transformation of 25074,63 Ha of vegetation to bare soils, transformation of 16125,75 Ha of bare soils to vegetation, transformation of 9552,06 Ha of open water and marshland to vegetation and transformation of 5119,29 Ha of vegetation to open water and marshland. In percent, these transformations correspond respectively to 5.36%, 3.45%, 2.04% and 1.09%.
At the second period (from October 1987 to August 2000), important changes concerning transformation of bare soils to vegetation with 225343,71 Ha (47.45%), transformation from vegetation to open water and marshland with 21462,66 Ha (4.52%), and transformation from open water and marshland to vegetation with 9437,94 Ha (1.99%).
The period during which the changes are most prominent is the third. Because record 122566,23 Ha of vegetation which become Bare soils, 13912,74 Ha of vegetation become open water and marshland,
International Journal of Advanced Remote Sensing and GIS
2845
13191,66 Ha of open water and marshland become bare soils, 10843,02 Ha of open water and marshland become vegetation and 9712,17 Ha of bare soils become vegetation. In rate of transformation, these changes correspond respectively to 25.81%, 2.93%, 2.78%, 2.28% and 2.05%.
Figure 10: Map of LULC change evolution between rainy season
4. Discussion
The most important limitation of the study is the unavailability of some images for exact match. That is why for decade 1970 the images used are from two different years. It is also the reason why the inter-seasonal evolution of LULC was not performed in the same decade to avoid presenting inconsistent results. The two images used in this decade are separated by more than three years. The unavailability of images data also impedes to cover the whole area of study especially in October 1975.
Another consequent is the inaccuracy of some results concerning the occupation and the evolution in LULC changes. For instance, in 2000 and 2015 the changes are almost similar because the images used are from the same year and show the difference from dry season to rainy season. The same limitation concerns the months of images acquisition. In fact the environment of study area is very sensitive to climatic conditions. As results, from one month to the next, significant changes can occur in LULC. Consequently, the changes noted during these periods are not the same, and are then interpreted with much delicacy.
5. Conclusion
The application of remote sensing and Geographic Information System in land natural resources management through the identification, classification and interpretation of different land use/land cover classes has been largely demonstrated. Monitoring land use/land cover to detect development trends is, therefore, highly useful in this context and remote sensing technology have played an important role in this analysis. The aim of this paper was to assess inter-seasonal and diachronic LULC changes occurring on Cameroonian shores of lake and its hinterland Chad using remote sensing and GIS, through landsat images data. The land use /land cover changes were analyzed according to post-classification method such as post-classifications maps and change maps. Thus, the following conclusions are drawn:
International Journal of Advanced Remote Sensing and GIS
2846
The land use/land cover occupation in the study area is dominated by bare soils principally during the dry season and sometimes during the rainy season as is the case in October 1975 and October 1987. Vegetation covers the immediate shores of lake (wetlands) and also the bare soils until the south of study area during the rainy season. During the drought in the 1970s and 1980s (Ahidjo, 2010), (GIZ 2015), (CBLT 2015), (Bretaudeau, SARR, and Traoré 2011), climatic deficits have resulted in an intensification of aridity in the sahelian zone. Therefore, open water and marshland have been reduced and now more or less stable surfaces around 5000 Ha, both in rainfall and in dry season. Indeed, according to (Alfa, Adeofun, and Ologunorisa, 2010), between 1972 and 1987, the greatest reduction in the lake size (which corresponds to open water and marshland for this paper) occurred i.e. a drastic loss of about 15138 km². This coinciding with the drought periods 1972 to the 1980s in this region and indicated between the satellite images of October 1972 and October 1987 (Alfa, Adeofun, and Ologunorisa, 2010), (Ouedraogo et al., 2002), (Jacques Lemoalle, Bader, and Leblanc, 2008).
Changes in land use/land cover from one season to another do not manifested in the same way and are closely linked to climatic conditions and human exploitation of naturals resource present. Thus, changes from rainy season are probably different to changes from dry season to rainy season. This paper is only studies changes from dry season to rainy season. It is logically notice in this interval, the increase of the vegetation surface to the detriment of bare soils, and the more or less slight increase of open water and marshland surface to the detriment of vegetation.
During diachronic changes, the proportions of open water and marshland that vary between two rainy seasons are larger than the ones that vary between two dry season. However, water areas vary little compared to variations in other occupation. This is due to the fact that the lake has entered its "Little Chad" phase since 1973 (NGATCHA and LEMOALLE 2014), (J. Lemoalle, Magrin, and Institut de recherche pour le développement (France) 2014). Vegetation is occupation class with greater variation compared with others classes. As for bare soils, they are more than more variant from one dry season to another, but can vary considerably in terms of area between two rainy season.
However, the study does not reveal other significant changes observed in the study area before and during the dry periods of the 1970s and 1980s. Indeed, in the April 1973 image, we have an overview of land cover in lake Chad before the drought of 1970s, and we can see a completely different land cover than in the others years. This occupation is due to the fact that this period is marked by the flood in the lake Chad (Durand, 1980), (Gao et al., 2011), (Jacques Lemoalle, Bader, and Leblanc, 2008)
made possible by the fluvial inputs whose annual average flows were estimated at 537 m3/s during this
period (Pouyaud and Colombani, 1989).
Nevertheless, the increase in vegetation areas, combined with the decrease in water surfaces and the bare soils area, observed in March 1987 can be explained by the level of the water in the lake. Indeed, according to (NGATCHA and LEMOALLE 2014), may 1985 corresponds to the minimum surface of the lake observed (17000 km²). Consequently, the reduction of water level allowed the germination of the seeds contained in the sediments.
Acknowledgement
The laboratory of UMR CNRS ESPACE 7300 contribute in this study by providing a technical and critical assistance in the main objective of improving the quality of work. The participation of others PhD candidate from the University of Mohammed V was also important thank to the sharing of experience from others different study.
Author Contribution
Paul Gerard Gbetkom is the main author who co-initiated the idea and wrote the manuscript. Sébastien Gadal and Ahmed El Aboudi co-initiated the idea, gave orientation, provided review,
International Journal of Advanced Remote Sensing and GIS
2847
advises and comments. Alfred Homère Ngandam Mfondoum provided review, comments and technical assistance.
References
Ahidjo, P. 2010. Lake Tchad: stakes of sub-regional cooperation. The yearbook of the “Gh. Zane”.
Institute of economic researches, pp.69-78.
Alfa, N., Co, A. and Et, O. 2008. Assessment of changes in aerial extent of lake chad using satellite remote sensing data. Journal of Applied Sciences and Environmental Management, 12(1), pp.101-107.
Billingsley, F.C. 1984. Remote sensing for monitoring vegetation: an emphasis on satellites. The Role
of Terrestrial Vegetation in the Global Carbon Cycle: Measurement by Remote Sensing. SCOPE. John
Wiley & Sons Ltd., pp.161-180.
Bretaudeau, A., BenoÎt, S. and Seydou, T. 2011. Évaluation Du Changement Climatique En Afrique de l’Ouest. Available from: http://www.agrhymet.ne/portailCC/images/pdf/cc-cilss.pdf
CBLT. 2015. Plan de Développement et d’adaptation Au Changement Climatique Du Lac Tchad.
Commission du Bassin du Lac Tchad (CBLT) Cameroun, Libye, Niger, Nigeria, République Centrafricaine, Tchad.
Chander, G., Markham, B.L. and Helder, D.L. 2009. Summary of current radiometric calibration coefficients for Landsat MSS, TM, ETM+, and EO-1 ALI Sensors. Remote Sensing of Environment, 113(5), pp.893-903.
Chavez, Jr, P. 1996. Image-based atmospheric corrections - revisited and improved. Photogrammetric
Engineering and Remote Sensing, 62(9), pp.1025-1036.
Chen, J., Peng, G. and Peijun, S. 2003. Land-use/land-cover change detection using improved change-vector analysis. Photogrammetric Engineering & Remote Sensing, 69(4), pp.369-379.
Jean-René, D. 1980. Evolution Des Captures Totales (1962-1977) et Devenir Des Pecheries de La Region Du Lac Tchad. Cahiers ORSTOM Series Hydrobiologie, 13(1-2), pp.93-111.
Gao, H., McDonald, K.C. and Lettenmaier, D.P. 2011. On the causes of the shrinking of lake chad.
Environmental Research Letters, 6(3), pp.1-7.
Geerken, R., Sara, V. and Mohamed, B. 2010. Impacts of climate variability and population pressure on water resources in the lake chad basin. The Global Dimensions of Change in River Basins. Conference of the Global Catchment Initiative (GCI), pp.27-33.
GIZ. 2015. 25 Ans de Réhabilitation et de Conservation Des Sols Au Sahel. Soutien Aux Efforts Des Populations Rurales Du Niger.
Gunn, S.R. 1998. Support vector machines for classification and regression. ISIS Technical Report, 14, pp.5-16.
Lemoalle, J., Géraud, M. and Institut de recherche pour le développement (France), eds. 2014. Le
développement du lac Tchad: situation actuelle et futurs possibles. Expertise collégiale. Marseille: IRD
International Journal of Advanced Remote Sensing and GIS
2848
Lemoalle, J. 2014. I-1. Le Fonctionnement Hydrologique Du Lac Tchad.
Lemoalle, J., Jean-Claude B. and Marc, L. 2008. The variability of lake chad: hydrological modelling and ecosystem services. In Proceedings of the 13th World Water Congress, Global Changes and
Water Resources, 1-15. International Water Resources Association.
Magrin, G. 2015. Atlas du lac Tchad. Edited by Magrin, G. Jacques, L. and Pourtier, R. Passages numero spécial 183. Martin, Dominique. 1962. Etude Pédologique Des Rives Camerounaises Du Lac Tchad, p.15.
Melgani, F., and L. Bruzzone. 2004. Classification of hyperspectral remote sensing images with support vector machines. IEEE Transactions on Geoscience and Remote Sensing, 42(8), pp.1778-1790.
Mobaied, S., Bernard, R., Arnault, L., Michel, B. and Nathalie, M. 2011. The use of diachronic spatial approaches and predictive modelling to study the vegetation dynamics of a managed heathland.
Biodiversity and Conservation, 20(1), pp.73-88.
Muzein, B.S. 2006. Remote sensing & GIS for land cover/ land use change detection and analysis in the semi-natural ecosystems and agriculture La. PhD Thesis, Technische Universität Dresden Fakultät Forst- Geo- und Hydrowissenschaften.
Ngounou, N.B. and Lemoalle, J. 2014. I-4. Variabilité Des Paysages et de La Biodiversité Du Petit Lac Tchad.
Okonkwo, C., Belay, D. and Sium, G. 2014. Characteristics of lake chad level variability and links to enso, precipitation, and river discharge. The Scientific World Journal, pp.1-13.
Olivry, J.C. 1996. Hydrologie Du Lac Tchad. Monographie Hydrologique, no 12. Editions de l’ORSTOM, Paris.
Olokeogun, O.S., Iyiola, K. and Iyiola, O.F. 2014. Application of remote sensing and gis in land use/land cover mapping and change detection in Shasha forest reserve, Nigeria. ISPRS - International
Archives of the Photogrammetry, Remote Sensing and Spatial Information Sciences XL-8, pp.613-616.
Ouedraogo, M. and Eric, S. 2002. Conséquences de La Sécheresse Observée Depuis Le Début Des Années 1970 En Afrique de l’Ouest et Centrale: Normes Météorologiques et Hydrologiques, p.8. Pouyaud, B. and Colombani, J. 1989. Les variations extrêmes au lac Tchad : l’assèchement est-il possible ?’ Annales de Géographie, 98(545), pp.1-23.
Rangé, C. 2016. Multi-Usage Des Ressources et Mobilités: L’intensification Dans Une Zone Humide
Sahélienne. Le Lac Tchad vu Par Sa Fenêtre Camerounaise. PhD Thesis, AgroParisTech.
Reis, S. 2008. Analyzing land use/land cover changes using remote sensing and GIS in Rize, North-East Turkey. Sensors, 8(10), 6188-6202.
Rim, Z. 2008. Etude Géochimique et Hydrodynamique de La Nappe Libre Du Bassin Du Lac Tchad Dans Les Régions de Diffa (Niger Oriental) et Du Bornou (Nord-Est Du Nigeria). PhD Thesis, Université de Montpellier II.
Salvati, L. and Tombolini, I. 2014. A Diachronic Classification of Peri-Urban Forest Land Based on Vulnerability to Desertification’. International Journal of Environmental Research, 8(2), pp.279-284.
International Journal of Advanced Remote Sensing and GIS
2849
Seignobos, C. and Iyébi-Mandjek, O. 2000. Atlas de La Province Extrême-Nord Cameroun’. Paris : Yaoundé: Institut de recherche pour le développement; République de Cameroun, Ministère de la recherche scientifique et technique, Institut national de cartographie.
Srivastava, P.K., Dawei, H. and Rico-Ramirez, M.A. 2012. Selection of classification techniques for land use/land cover change investigation. Advances in Space Research, 50(9), 1250-1265.
Szuster, B.W., Qi, C. and Michael, B. 2011. A comparison of classification techniques to support land cover and land use analysis in tropical coastal zones. Applied Geography, 31(2), pp.525-532.
Theodoridis, S. and Konstantinos, K. 2008. Pattern recognition (Theodoridis, S. and Koutroumbas, K. 2006). Neural Networks, IEEE Transactions, pp.376-376.
Tilho, J. 1928. Variations et disparition possible du Tchad. Annales de Géographie, 37(207), pp.238-260.
Tzotsos, A. and Demetre, A. 2008. Support vector machine classification for object-based image analysis. Object-Based Image Analysis, pp.663-677.
Vitousek, P.M. 1992. Global environmental change: an introduction. Annual Review of Ecology and
Systematics, 23(1), pp.1-14.
Zhang, Y. 2012. Support vector machine classification algorithm and its application. International