HAL Id: hal-02927415
https://hal.archives-ouvertes.fr/hal-02927415
Submitted on 16 Sep 2020
HAL is a multi-disciplinary open access
archive for the deposit and dissemination of
sci-entific research documents, whether they are
pub-lished or not. The documents may come from
teaching and research institutions in France or
abroad, or from public or private research centers.
L’archive ouverte pluridisciplinaire HAL, est
destinée au dépôt et à la diffusion de documents
scientifiques de niveau recherche, publiés ou non,
émanant des établissements d’enseignement et de
recherche français ou étrangers, des laboratoires
publics ou privés.
Distributed under a Creative Commons Attribution| 4.0 International License
Increasing anthropogenic methane emissions arise
equally from agricultural and fossil fuel sources
Robert B. Jackson, Marielle Saunois, Philippe Bousquet, Josep G. Canadell,
Benjamin Poulter, Ann R. Stavert, Peter Bergamaschi, Y. Niwa, Arjo J.S.
Segers, Aki Tsuruta
To cite this version:
Robert B. Jackson, Marielle Saunois, Philippe Bousquet, Josep G. Canadell, Benjamin Poulter, et
al.. Increasing anthropogenic methane emissions arise equally from agricultural and fossil fuel sources.
Environmental Research Letters, IOP Publishing, 2020, 15 (7), �10.1088/1748-9326/ab9ed2�.
�hal-02927415�
Environmental Research Letters
PERSPECTIVE • OPEN ACCESS
Increasing anthropogenic methane emissions
arise equally from agricultural and fossil fuel
sources
To cite this article: R B Jackson et al 2020 Environ. Res. Lett. 15 071002
View the article online for updates and enhancements.
Recent citations
The Global Methane Budget 2000–2017
Marielle Saunois et al
Environ. Res. Lett. 15 (2020) 071002 https://doi.org/10.1088/1748-9326/ab9ed2
Environmental Research Letters
OPEN ACCESS
RECEIVED 6 May 2020
REVISED 15 June 2020
ACCEPTED FOR PUBLICATION 22 June 2020
PUBLISHED 15 July 2020
Original content from this work may be used under the terms of the
Creative Commons Attribution 4.0 licence. Any further distribution of this work must maintain attribution to the author(s) and the title of the work, journal citation and DOI.
PERSPECTIVE
Increasing anthropogenic methane emissions arise equally from
agricultural and fossil fuel sources
R B Jackson1, M Saunois2, P Bousquet2, J G Canadell3, B Poulter4, A R Stavert5, P Bergamaschi6, Y Niwa7,8, A Segers9and A Tsuruta10
1 Department of Earth System Science, Woods Institute for the Environment, and Precourt Institute for Energy, , Stanford University,
Stanford, CA 94305-2210, United States of America
2 Laboratoire des Sciences du Climat et de l’Environnement, LSCE-IPSL (CEA-CNRS-UVSQ), Universit´e Paris-Saclay, 91191
Gif-sur-Yvette, France
3 Global Carbon Project, CSIRO Oceans and Atmosphere, Canberra, ACT 2601, Australia
4 NASA Goddard Space Flight Center, Biospheric Sciences Laboratory, Greenbelt, MD 20771, United States of America 5 Global Carbon Project, CSIRO Oceans and Atmosphere, Aspendale, VIC 3195, Australia
6 European Commission Joint Research Centre, 21027 Ispra (Va), Italy
7 Center for Global Environmental Research, National Institute for Environmental Studies, Tsukuba, Ibaraki 305-8506, Japan 8 Meteorological Research Institute, Tsukuba, Ibaraki 305-0052, Japan
9 TNO, Dept. of Climate Air & Sustainability, NL-3508-TA Utrecht, The Netherlands 10 Finnish Meteorological Institute, FI-00101 Helsinki, Finland
E-mail:[email protected]
Climate stabilization remains elusive, with increased greenhouse gas concentrations already increasing global average surface temperatures 1.1 ◦C above pre-industrial levels (World Meteorological Organiz-ation2019). Carbon dioxide (CO2) emissions from
fossil fuel use, deforestation, and other anthropogenic sources reached ~ 43 billion metric tonnes in 2019 (Friedlingstein et al2019, Jackson et al2019). Storms, floods, and other extreme weather events displaced a record 7 million people in the first half of 2019 (IDMC 2019). When global mean surface temperature four million years ago was 2◦C–3◦C warmer than today (a likely temperature increase before the end of the century), ice sheets in Greenland and West Antarc-tica melted and parts of East AntarcAntarc-tica’s ice retreated, causing sea levels to rise 10–20 m (World Meteorolo-gical Organization2019).
Methane (CH4) emissions have contributed
almost one quarter of the cumulative radiative for-cings for CO2, CH4, and N2O (nitrous oxide)
com-bined since 1750 (Etminan et al 2016). Although methane is far less abundant in the atmosphere than CO2, it absorbs thermal infrared radiation much
more efficiently and, in consequence, has a global warming potential (GWP) ~86 times stronger per unit mass than CO2on a 20-year timescale and
28-times more powerful on a 100-year time scale (IPCC 2014).
Global average methane concentrations in the atmosphere reached ~1875 parts per billion (ppb) at the end of 2019, more than two-and-a-half times preindustrial levels (Dlugokencky2020). The largest methane sources include anthropogenic emissions
from agriculture, waste, and the extraction and use of fossil fuels as well as natural emissions from wetlands, freshwater systems, and geological sources (Kirschke
et al2013, Saunois et al2016a, Ganesan et al2019). Here, we summarize new estimates of the global methane budget based on the analysis of Saunois et
al (2020) for the year 2017, the last year of the new Global Methane Budget and the most recent year data are fully available. We compare these estimates to mean values for the reference ‘stabilization’ period of 2000–2006 when atmospheric CH4concentrations
were relatively stable. We present data for sources and sinks and provide insights for the geographical regions and economic sectors where emissions have changed the most over recent decades.
1. Methods
We use the same data and approaches to estimate CH4
emissions as in Saunois et al (2020). One approach we use is a top-down (TD) ensemble of 11 inver-sions using atmospheric CH4concentrations to
con-strain total possible emissions and partition them to primary sources. The TD inversions were con-strained by surface observations for the period 2000– 2006, and by surface and/or satellite observations in 2017. Prior fluxes, treatment of observations, and optimization configurations varied somewhat across the 11 inversions as described in the supplementary material of Saunois et al (2020). Most of the inver-sions considered the same OH field, constant over time, attributing changes in methane atmospheric concentrations to altered emissions rather than to
Environ. Res. Lett. 15 (2020) 071002 R B Jackson et al
atmospheric oxidative capacity. Consequently, the inferred changes in methane emissions would be higher if OH is increasing in the atmosphere, as sug-gested by chemistry climate models (e.g. Zhao et al 2020) or lower if OH is decreasing in the atmo-sphere, as suggested by some methyl chloroform-based studies (e.g. Rigby et al2017). Uncertainties in regional and sectoral partitioning vary across models based on transport errors, prior flux ratios, and inver-sion baselines. Our TD ensemble derived an estim-ated uncertainty of±5% on total global emissions, a range larger than for transport model errors alone of±2%–3% attributable to different inversion sys-tems (Locatelli et al2013). We were unable to include uncertainties in TD total emissions attributable to uncertainties in the methane chemical sink; uncer-tainty on the global burden of OH is about 10%– 15% and translates to an uncertainty of approxim-ately±9% on total global emissions (Zhao et al2020). The second approach is a detailed bottom-up (BU) accounting method that uses global invent-ories and biogeochemical modeling that provides a more detailed attribution to sources but lacks the total atmospheric growth rate constraint that accompanies TD approaches. BU trends in methane emissions are available for anthropogenic emissions using four global inventories (EDGARv4.3.2, CEDS, GAINS and EPA2012), for biomass burning using three fire products (GFEDv4.1s, QFED, and FINN) and for wetlands calculated by 13 biogeochemical models (see Saunois et al 2020). However, estim-ates for other natural sources such as geological, ter-mites, permafrost, rivers, lakes, and reservoirs avail-able in the literature do not provide any temporal changes in methane emissions and trends cannot be calculated for these sources. Uncertainties in ‘nat-ural emissions’ for wetlands plus all other inland waters arise from factors that include wetland flux density, seasonal to interannual variability in wet-land extent, and some double-counting of wetwet-land and small inland waters, contributing to higher BU estimates for natural sources than in the TD invent-ory. For the 2000–2017 methane budget (Saunois et al 2020), the Wetland Area Dynamics for Methane Mod-eling dataset (WAD2 M) was developed to avoid some double counting by removing inland waters from sur-face inundation data to estimate these fluxes sep-arately, combining Landsat-based (Pekel et al2016) and radar-based observations (Jensen and Mcdonald 2019).
2. Global and latitudinal sources and sinks
of methane
Average estimated global methane emissions for 2017 were 596 Tg CH4yr−1(figure1, table1) based on 11
top-down atmospheric inversions, with an ensemble max.-min. range of 572–614 Tg CH4yr−1. This value
is 9% (50 Tg CH4 yr−1) higher than the average
for the period 2000–2006 (546 Tg CH4yr−1, range
538–555), with the increase attributable primarily to greater anthropogenic emission sources (table1). Anthropogenic sources also contributed 61% of total TD global methane emissions in 2017. The estim-ate from the BU approach yielded an increase of 51 Tg CH4 yr−1, from 696 (560–834) Tg CH4 yr−1
in 2000–2006 to 747 (602–896) Tg CH4 yr−1 in
2017 (table1). Anthropogenic sources contributed an estimated 51% of total global BU emissions in 2017. The difference of ~150 Tg CH4 yr−1 in total
global emissions between TD and BU methods arises primarily from a divergence in estimates of natural sources, particularly from freshwater and geological ones (table 1) and from the absence of TD atmo-spheric constraints for BU approaches (see below).
The latitudinal attribution of methane emis-sions highlights the role of tropical and temper-ate sources relative to boreal and Arctic systems (figure2). Based on TD methods in 2017, tropical sources (<30◦N) emitted 64% (383 Tg CH4 yr−1;
351–405) of global methane emissions and northern mid-latitude sources (30◦N-60◦N) contributed 32% (185 Tg CH4yr−1; 171–209). High-latitude (>60◦N)
systems yielded only 4% of global methane emissions (24 Tg CH4yr−1; 21–28).
Increased methane emissions from 2000–2006 to 2017 arose primarily from tropical and temper-ate latitudes (figure 3). Average methane emissions increased by 29 and 32 Tg CH4 yr−1 in the
trop-ics (<30◦N) for TD and BU approaches, respectively, and by 15 and 23 Tg CH4 yr−1 in northern
mid-latitudes (30◦N-60◦N) (figure3). In contrast, we find no evidence to date for increasing methane release from the Arctic. Despite rapidly warming air tem-peratures (World Meteorological Organization2019), methane emissions from northern high-latitude sys-tems (>60◦N) were virtually unchanged in 2017 relat-ive to the average value for 2000–2006:−0.4 and −1.6 Tg CH4yr−1for TD and BU methods, respectively.
The average global atmospheric and soil methane sink estimated for 2017 increased to 571 (540–585) Tg CH4 yr−1 from 546 (531–555) Tg CH4yr−1 for the
2000–2006 average based on the TD approaches. Par-titioning the global methane sink into components in the atmosphere (CH4destruction from tropospheric
OH and Cl and total stratospheric losses) and soil (microbial consumption) for 2017 yields an average TD atmospheric sink of 531 (502–540) Tg CH4yr−1
and an average soil sink of 40 (37–47) Tg CH4 yr−1
(table1).
3. Regional attribution and anthropogenic
emissions
Specific regions contributed the most to greater methane emissions in 2017 compared with 2000–2006. Three regions (Africa and the Middle East; China; and South Asia and Oceania) each 2
Environ. Res. Lett. 15 (2020) 071002 R B Jackson et al
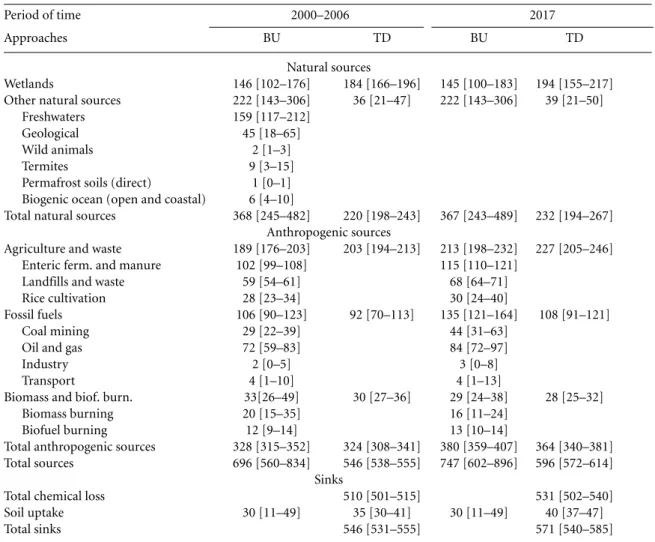
Table 1. Mean global methane emissions by source type in Tg CH4yr−1for the period 2000–2006 (middle column) and 2017 (right
column) using bottom-up (BU) and top-down (TD) approaches. Because top-down models cannot fully separate individual processes, only five categories of emissions are provided (see Saunois et al2020). Uncertainties are reported as [min-max] range of reported studies. Differences of 1 Tg CH4yr−1in the totals can occur due to rounding errors. ‘Total chemical loss’ includes atmospheric loss
from tropospheric OH and Cl as well as stratospheric loss.
Period of time 2000–2006 2017
Approaches BU TD BU TD
Natural sources
Wetlands 146 [102–176] 184 [166–196] 145 [100–183] 194 [155–217]
Other natural sources 222 [143–306] 36 [21–47] 222 [143–306] 39 [21–50]
Freshwaters 159 [117–212]
Geological 45 [18–65]
Wild animals 2 [1–3]
Termites 9 [3–15]
Permafrost soils (direct) 1 [0–1]
Biogenic ocean (open and coastal) 6 [4–10]
Total natural sources 368 [245–482] 220 [198–243] 367 [243–489] 232 [194–267]
Anthropogenic sources
Agriculture and waste 189 [176–203] 203 [194–213] 213 [198–232] 227 [205–246]
Enteric ferm. and manure 102 [99–108] 115 [110–121]
Landfills and waste 59 [54–61] 68 [64–71]
Rice cultivation 28 [23–34] 30 [24–40]
Fossil fuels 106 [90–123] 92 [70–113] 135 [121–164] 108 [91–121]
Coal mining 29 [22–39] 44 [31–63]
Oil and gas 72 [59–83] 84 [72–97]
Industry 2 [0–5] 3 [0–8]
Transport 4 [1–10] 4 [1–13]
Biomass and biof. burn. 33[26–49] 30 [27–36] 29 [24–38] 28 [25–32]
Biomass burning 20 [15–35] 16 [11–24]
Biofuel burning 12 [9–14] 13 [10–14]
Total anthropogenic sources 328 [315–352] 324 [308–341] 380 [359–407] 364 [340–381]
Total sources 696 [560–834] 546 [538–555] 747 [602–896] 596 [572–614]
Sinks
Total chemical loss 510 [501–515] 531 [502–540]
Soil uptake 30 [11–49] 35 [30–41] 30 [11–49] 40 [37–47]
Total sinks 546 [531–555] 571 [540–585]
increased emissions by ~10–15 Tg CH4yr−1assessed
using both TD and BU methods (figure3). The next-largest changes occurred in North America, with growth of 6.7 and 5.0 Tg CH4 yr−1 for TD and BU
approaches, respectively (figure3), mostly from the United States (5.1 and 4.4 Tg CH4yr−1 for TD and
BU, respectively). Europe was the only region where CH4emissions appear to have decreased in 2017
rel-ative to 2000–2006, with emissions down−1.6 Tg CH4yr−1for TD methods and−4.3 Tg CH4yr−1for
BU methods.
Anthropogenic sources are estimated to contrib-ute almost all of the additional methane emitted to the atmosphere for 2017 compared to 2000–2006 (table1). TD estimates of mean anthropogenic emis-sions in 2017 increased 40 Tg CH4 yr−1 (12%) to
364 (range 340–381) Tg CH4yr−1(table1).
Agricul-ture and Waste contributed 60% of this increase and Fossil Fuels the remaining 40%, with a slight decrease estimated for Biomass and Biofuel Burning. Based on BU methods, anthropogenic emissions in 2017 rose 52 Tg CH4 yr−1 (16%) to 380 (range 359–407) Tg
CH4 yr−1 (table1), with 56% of the increase
com-ing from Fossil Fuels and 44% from Agriculture and
Waste sources (table1). Increasing emission estimates from anthropogenic sectors over the past two dec-ades are consistent with previous work from Saun-ois et al2017, although the relative contribution of fossil fuel and agriculture and waste sectors differs across studies (e.g. Schwietzke et al2016) owing to different time periods, modelling systems, and data included.
Mean annual methane emissions rose sharply in some sectors from 2000–2006 to 2017 (figure4). Increased agricultural emissions predominated in South Asia/Oceania, Africa, and South America, with increases of 9–10 Tg CH4yr−1in South Asia/Oceania
and 7–9 Tg CH4 yr−1 in Africa (figure4). By
com-parison, Europe’s agricultural methane emissions decreased−1.4 to −2.8 Tg CH4yr−1for TD and BU
methods, respectively. Increased emissions from the fossil fuel sector were the largest in China (5.3 and 12.2 Tg CH4yr−1for TD and BU, respectively) and
North America, Africa, and South Asia and Oceania (4 to 6 Tg CH4yr−1in all three regions and using both
approaches). Fossil fuel-related methane emissions in the United States increased 3.4 to 4.0 Tg CH4 yr−1
for TD and BU estimates, respectively, approximately 3
Environ. Res. Lett. 15 (2020) 071002 R B Jackson et al
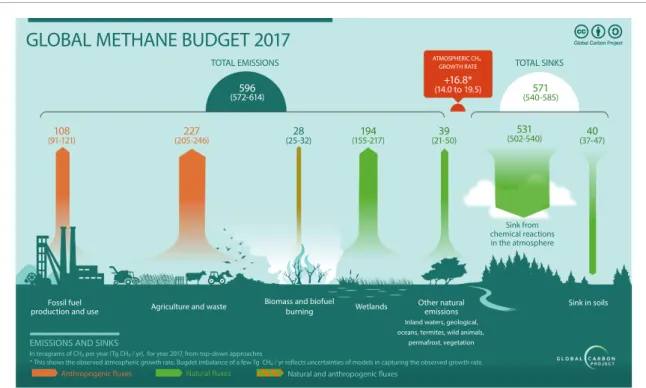
Figure 1. The global methane budget for year 2017 based on top-down methods for natural sources and sinks (green), anthropogenic sources (orange), and mixed natural and anthropogenic sources (hatched orange-green for ‘biomass and biofuel burning’).
Figure 2. Methane emissions (Tg CH4yr−1) for 2017 by region, source category, and latitude. The mean estimates shown arise
from the ensemble of top-down inversion models described in Saunois et al(2020).
80% of the total increase for North America from 2000–2006 to 2017.
4. Natural methane sources
Global methane emissions estimated from natural sources are relatively unchanged from 2000–2006 to 2017, albeit with large uncertainties (table1). Mean top-down estimates for natural methane sources were 232 (194–267) Tg CH4yr−1in 2017 compared with
220 (198–243) Tg CH4yr−1for 2000–2006 (table1);
mean bottom-up estimates were substantially higher: 367 (243–489) and 368 (245–482) Tg CH4 yr−1 for
the two periods, respectively. Natural sources remain more poorly constrained than anthropogenic ones, with divergent estimates for the bottom-up and top-down emissions. Vegetated wetlands contributed 194 (155–217) Tg CH4yr−1of the total, about 83% of
nat-ural sources based on TD methods (table1). In con-trast, BU methods estimate vegetated wetland emis-sions to be 145 (100–183) Tg CH4 yr−1 in 2017, a
value unchanged from the 2000–2006 average but only three-quarters of the TD estimate (that also includes inland water emissions).
Wetlands and freshwater systems more broadly are the largest source of methane but also the greatest 4
Environ. Res. Lett. 15 (2020) 071002 R B Jackson et al
Figure 3. Changes in total methane emissions (mean and min-max range in Tg CH4yr−1) in 2017 compared with mean values
for 2000–2006 by region (left panel) and latitude (right panel; note different y-axis scales). Each pair of bars presents top-down (dark gray) and bottom-up (light gray) emissions estimates. See the figure2legend for a map of the regions. Positive values reflect emissions that were larger in 2017 than in the period 2000–2006. For top-down (TD) estimates, the mean, minimum and maximum values correspond to values across the ensemble of 11 model inversions. For bottom-up (BU) estimates, they are the mean, min and max values of the total emissions ensemble obtained by combining 4 anthropogenic inventories with 3 fire products and 13 wetland emissions model results.
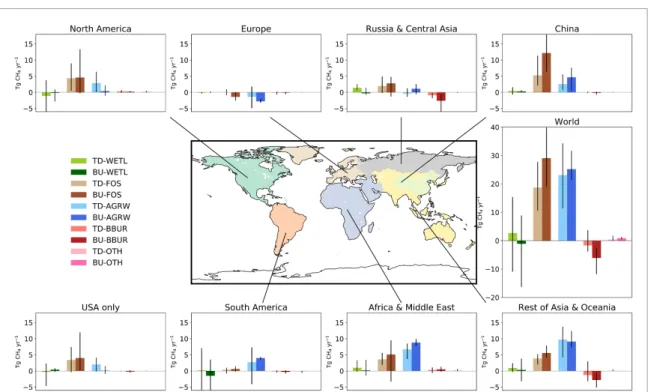
Figure 4. Changes in methane emissions (Tg CH4yr−1; min-max range) by region and source for year 2017 compared with the
mean annual value for the period 2000–2006. Positive values represent annual emissions that were larger in 2017. Abbreviations in the color legend refer to top-down (TD) and bottom-up (BU) methods and to ‘wetland,’ ‘fossil,’ ‘agriculture and waste,’ ‘biomass burning,’ and ‘other’ sources. See section1and the figure3legend for descriptions of max-min ranges across inventories, models, and products.
source of uncertainty to the global methane budget. Their inclusion in BU methodologies leads to a dif-ference of roughly 150 Tg CH4yr−1when compared
to the atmospheric constraint. Wetland definitions and challenges in properly understanding the location of wetlands have led to ‘double counting’ of inland waters and vegetated wetlands in previous studies. Our use of the Wetland Area Dynamics for Methane
Modeling (WAD2M) dataset reduced the effect of double counting by ~35 Tg CH4yr−1compared to the
previous budget in Saunois et al (2016), with veget-ated wetlands accounting for 101–179 Tg CH4yr−1.
However, the inland waters estimate is revised to a range of 117–212 Tg CH4 yr−1, higher than in
Saunois et al (2016) due to newer studies that meas-ured higher emission factors in freshwater systems 5
Environ. Res. Lett. 15 (2020) 071002 R B Jackson et al
(Delsontro et al2018, Saunois et al2020). Reconciling the wetland methane emissions flux requires contin-ued attention and the use of independent lines of data from isotopes, flux towers, and satellite observations (e.g. Knox et al2019).
Another source of uncertainty is the amount of methane released from natural geological sources, particularly seeps and mud volcanoes. The new global BU estimate for natural geological sources (terrestrial and marine) of 45 (range of 18–65) Tg CH4(Etiope et al2019, Saunois et al2020) is 7 Tg CH4smaller than
the value in Saunois et al (2016a). However, recent studies analyzing radiocarbon methane (14CH
4) in
ice cores have concluded that pre-industrial emis-sions of thermogenic (i.e. ancient or ‘fossil’) meth-ane were close to zero (~0–5.4 Tg CH4; Hmiel et al
2020)—substantially less even than the 15.4 Tg CH4
estimated for the abrupt warming event that occurred between the Younger Dryas and Preboreal intervals ~11 600 years ago (Petrenko et al2017). Hmiel et al
(2020)also conclude that current estimates of CH4
emissions from the fossil fuel industry are therefore too low by 30 to 40 Tg CH4 (Lassey et al 2007).
However, the uncertainties in isotopic budget stud-ies remain substantial due to the uncertaintstud-ies in the isotopic signature of the sources.
Unlike top-down approaches, bottom-up invent-ories estimate activity and emissions factors separ-ately. In contrast to the results of Hmiel et al(2020), a new annual estimate of natural methane emissions from the East Siberian Arctic Shelf alone is 3.0 Tg CH4, most of it thermogenic methane (Thornton et al
2020). A number as small as 5 Tg CH4per year for all
natural geologic emissions (Hmiel et al2020) seems difficult to reconcile with the results of Thornton et
al(2020), the work of other researchers more broadly, and with BU approaches generally. Research is needed to constrain geologic sources fully.
Additional focus and monitoring is also needed to track the potential for rapid methane release from the Arctic (e.g. Post et al2019, Zhang et al 2019). Average surface temperatures in the Arctic have risen twice as fast as the global average of 1.1◦C over the past two decades (compared to the period 1850–1900;
WMO2019). As a result of permafrost thaw and other
changes in peatland ecosystems, many investigators and models predict a substantial increase in Arctic methane emissions this century. However, our latit-udinal estimates from TD methods shows no evid-ence for the start of such a transition through year 2017 (figure4; see also Saunois et al2020).
5. Conclusions
Methane emissions have continued to rise over the past decade and are tracking concentrations most consistent with the warmest marker scenario of the Intergovernmental Panel on Climate Change (RCP8.5, a representative concentration pathway)
that yields an estimated global warming of 4.3◦C by year 2100 (Saunois et al 2016b,2020, Nisbet et al 2019). Current trajectories in socioeconomic devel-opment also suggest the world is likely to follow IPCC Shared Socioeconomic pathways (SSP) lead-ing to relatively higher emission trajectories over the next decade (Saunois et al2020). Estimates for 2018 and 2019 show increases in atmospheric methane of 8.5 and 10.7 ppb, respectively, two of the four highest annual growth rates since 2000 (Dlugokencky 2020).
Increased emissions from both the agriculture and waste sector and the fossil fuel sector are likely the dominant cause of this global increase (figures1
and 4), highlighting the need for stronger
mitiga-tion in both areas. Our analysis also highlights emis-sion increases in agriculture, waste, and fossil fuel sec-tors from southern and southeastern Asia, including China, as well as increases in the fossil fuel sector in the United States (figure 4). In contrast, Europe is the only continent in which methane emissions appear to be decreasing. While changes in the sink of methane from atmospheric or soil uptake remains possible (Turner et al2019), atmospheric chemistry and land-surface models suggest the timescales for sink responses are too slow to explain most of the increased methane in the atmosphere in recent years. Climate policies overall, where present for methane mitigation, have yet to alter substantially the global emissions trajectory to date.
Acknowledgments
The authors acknowledge the many scientists whose efforts contributed to the new Global Methane Budget released by the Global Carbon Project (glob-alcarbonproject.org). Our research was supported by the Gordon and Betty Moore Foundation through Grant GBMF5439 ‘Advancing Understanding of the Global Methane Cycle’ to Stanford University for the Methane Budget activity of the Global Carbon Project (globalcarbonproject.org). The authors acknowledge additional support from the Center for Advanced Study in the Behavioral Sciences at Stanford Uni-versity (RBJ), the Australian Government’s National Environmental Science Programme’s Earth Systems and Climate Change Hub (JGC), and Future Earth. The data that support the findings of this study are openly available at globalcarbonproject.org.
Data Availability Statement
The data that support the findings of this study are openly available at globalcarbonproject.org.
ORCID iDs
R B Jackson
https://orcid.org/0000-0001-8846-7147
Environ. Res. Lett. 15 (2020) 071002 R B Jackson et al M Saunois https://orcid.org/0000-0003-3983-2931 J G Canadell https://orcid.org/0000-0002-8788-3218 B Poulter https://orcid.org/0000-0002-9493-8600 P Bergamaschi https://orcid.org/0000-0003-4555-1829 A Tsuruta https://orcid.org/0000-0002-9197-3005
References
Delsontro T, Beaulieu J J and Downing J A 2018 Greenhouse gas emissions from lakes and impoundments: upscaling in the face of global change Limnol. Oceanogr. Lett.
3 64–75
Dlugokencky E 2020 NOAA/ESRL (www.esrl.noaa.gov/gmd/ccgg/ trends_ch4/)
Etiope G, Ciotoli G, Schwietzke S and Schoell M 2019 Gridded maps of geological methane emissions and their isotopic signature Earth Syst. Sci. Data11 1–22
Etminan M, Myhre G, Highwood E J and Shine K P 2016 Radiative forcing of carbon dioxide, methane, and nitrous oxide: a significant revision of the methane radiative forcing Geophys. Res. Lett.43 12614–23
Friedlingstein Pet al 2019 Global Carbon Budget 2019 Earth Syst. Sci. Data11 1783–838
Ganesan A L et al 2019 Advancing scientific understanding of the global methane budget in support of the Paris Agreement Glob. Biogeochem. Cycles33 1475–512
Hmiel B et al 2020 Preindustrial14CH
4indicates greater
anthropogenic fossil CH4emissions Nature 578 409–12
IDMC 2019 IDMC Mid-Year Figures: Internal Displacement from January to June 2019 (Geneva: IDMC)
IPCC 2014 Mitigation of Climate Change. Contribution of Working Group III to the Fifth Assessment Report of the
Intergovernmental Panel on Climate Change ed O Edenhofer et al (Cambridge: Cambridge University Press)
Jackson R B, Friedlingstein P, Andrew R M, Canadell J G, Le Qu´er´e C and Peters G P 2019 Persistent fossil fuel growth threatens the Paris Agreement and planetary health Environ. Res. Lett.14 121001
Jensen K and Mcdonald K 2019 Surface water microwave product series Version 3: a near-real time and 25-year historical global inundated area fraction time series from active and passive microwave remote sensing IEEE Geosci. Remote Sens. Lett.16 1402–6
Kirschke S et al 2013 Three decades of global methane sources and sinks Nat. Clim. Change6 813–23
Knox S H et al 2019 FLUXNET-CH4 synthesis activity: objectives, observations, and future directions Bull. Am. Meteorol. Soc.
100 2607–32
Lassey K R, Etheridge D M, Lowe D C, Smith A M and Ferretti D F 2007 Centennial evolution of the atmospheric methane budget: what do the carbon isotopes tell us? Atmos. Chem. Phys.7 2119–39
Locatelli R et al 2013 Impact of transport model errors on the global and regional methane emissions estimated by inverse modelling Atmos. Chem. Phys.13 9917–37
Nisbet E G et al 2019 Very strong atmospheric methane growth in the four years 2014–2017: implications for the Paris Agreement Glob. Biogeochem. Cycles33 318–42
Pekel J-F, Cottam A, Gorelick N and Belward A 2016 High-resolution mapping of global surface water and its long-term changes Nature540 418–22
Petrenko V V et al 2017 Minimal geological methane emissions during the Younger Dryas–Preboreal abrupt warming event Nature548 443–6
Post E et al 2019 The polar regions in a 2◦C warmer world Sci. Adv.5 eaaw9883
Rigby M et al 2017 Role of atmospheric oxidation in recent methane growth Proc. Nat. Acad. Sci. USA114 5373–7
Saunois M et al 2016a The global methane budget 2000-2012 Earth Syst. Sci. Data8 697–751
Saunois M et al 2017 Variability and quasi-decadal changes in the methane budget over the period 2000–2012 Atmos. Chem. Phys.17 1135–11161
Saunois M et al 2020 The global methane budget 2000–2017 Earth Syst. Sci. Data12 1561–623
Saunois M, Jackson R B, Bousquet P, Poulter B and Canadell J G 2016b The growing role of methane in anthropogenic climate change Environ. Res. Lett.11
120207
Schwietzke S et al 2016 Upward revision of global fossil fuel methane emissions based on isotope database Nature
538 88–91
Thornton B F, Prytherch J, Andersson K, Brooks I M, Salisbury D, Tjernström M and Crill P M 2020 Shipborne eddy covariance observations of methane fluxes constrain Arctic sea emissions Sci. Adv.6 eaay7934
Turner A J, Frankenberg C and Kort E A 2019 Interpreting contemporary trends in atmospheric methane Proc. Natl. Acad. Sci. USA116 2805–13
World Meteorological Organization 2019 United in Science (Geneva: WMO)
Zhang Z, Zimmermann N E, Stenke A, Li X, Hodson E L, Zhu G, Huang C and Poulter B 2019 Emerging role of wetland methane emissions in driving 21st century climate change Proc. Nat. Acad. Sci. USA114 9647–52
Zhao Y et al 2020 Influences of hydroxyl radicals (OH) on top-down estimates of the global and regional methane budgets Atmos. Chem. Phys. Discuss. (submitted) (https://doi.org/10.5194/acp-2019-1208)