HAL Id: hal-01987271
https://hal.archives-ouvertes.fr/hal-01987271
Submitted on 24 Nov 2020
HAL is a multi-disciplinary open access
archive for the deposit and dissemination of
sci-entific research documents, whether they are
pub-lished or not. The documents may come from
teaching and research institutions in France or
abroad, or from public or private research centers.
L’archive ouverte pluridisciplinaire HAL, est
destinée au dépôt et à la diffusion de documents
scientifiques de niveau recherche, publiés ou non,
émanant des établissements d’enseignement et de
recherche français ou étrangers, des laboratoires
publics ou privés.
filaments
Florian Schlauderer, Thomas Seeholzer, Ambroise Desfosses, Torben Gehring,
Mike Strauss, Karl-Peter Hopfner, Irina Gutsche, Daniel Krappmann, Katja
Lammens
To cite this version:
Florian Schlauderer, Thomas Seeholzer, Ambroise Desfosses, Torben Gehring, Mike Strauss, et al..
Molecular architecture and regulation of BCL10-MALT1 filaments. Nature Communications, Nature
Publishing Group, 2018, 9 (1), pp.4041. �10.1038/s41467-018-06573-8�. �hal-01987271�
Molecular architecture and regulation
of BCL10-MALT1
filaments
Florian Schlauderer
1
, Thomas Seeholzer
2
, Ambroise Desfosses
3
, Torben Gehring
2
, Mike Strauss
4
,
Karl-Peter Hopfner
1
, Irina Gutsche
3
, Daniel Krappmann
2
& Katja Lammens
1
The CARD11-BCL10-MALT1 (CBM) complex triggers the adaptive immune response in
lymphocytes and lymphoma cells. CARD11/CARMA1 acts as a molecular seed inducing
BCL10
filaments, but the integration of MALT1 and the assembly of a functional CBM
complex has remained elusive. Using cryo-EM we solved the helical structure of the
BCL10-MALT1
filament. The structural model of the filament core solved at 4.9 Å resolution
iden-ti
fied the interface between the N-terminal MALT1 DD and the BCL10 caspase recruitment
domain. The C-terminal MALT1 Ig and paracaspase domains protrude from this core to
orchestrate binding of mediators and substrates at the
filament periphery. Mutagenesis
studies support the importance of the identi
fied BCL10-MALT1 interface for CBM complex
assembly, MALT1 protease activation and NF-
κB signaling in Jurkat and primary CD4 T-cells.
Collectively, we present a model for the assembly and architecture of the CBM signaling
complex and how it functions as a signaling hub in T-lymphocytes.
DOI: 10.1038/s41467-018-06573-8
OPEN
1Gene Center, Ludwig-Maximilians University, Feodor-Lynen-Str. 25, 81377 München, Germany.2Research Unit Cellular Signal Integration, Institute of
Molecular Toxicology and Pharmacology, Helmholtz-Zentrum München - German Research Center for Environmental Health, Ingolstaedter Landstrasse 1, 85764 Neuherberg, Germany.3University Grenoble Alpes, CNRS, CEA, Institut de Biologie Structurale IBS, F-38044 Grenoble, France.4Department of
Anatomy and Cell Biology, McGill University, Montreal, Canada H3A 0C7. These authors contributed equally: Florian Schlauderer, Thomas Seeholzer, Ambroise Desfosses. Correspondence and requests for materials should be addressed to I.G. (email:irina.gutsche@ibs.fr)
or to D.K. (email:daniel.krappmann@helmholtz-muenchen.de) or to K.L. (email:klammens@genzentrum.lmu.de)
123456789
T
he immune stimulation of B-cell and T-cell receptors (TCR
and BCR), as well as activating natural killer cell and fungal
recognition receptors triggers activation of distinct Caspase
recruitment
domain
(CARD)-containing
scaffold
proteins,
including CARD9, CARD10 (also known as CARMA3), CARD11
(CARMA1), and CARD14 (CARMA2)
1,2. CARD11, B cell
phoma 10 (BCL10) and mucosa-associated lymphoid tissue
lym-phoma translocation protein 1 (MALT1) assemble the
CARD11-BCL10-MALT1 (CBM) complex that bridges TCR/BCR proximal
signaling to the canonical IκB kinase (IKK)/NF-κB and JNK
pathway in lymphocytes
3. Upon assembly, the CBM complex
serves as a scaffolding platform that activates downstream
sig-naling events via association of mediators such as ubiquitin ligases
(e.g., TRAF6) and protein kinases (e.g., TAK1 and IKKβ)
4–6.
Upon activation, IKKβ phosphorylates IκBα leading to its
pro-teasomal degradation and subsequent release, nuclear
transloca-tion and transcriptransloca-tional activatransloca-tion of NF-κB
7. Beyond the
scaffolding function, MALT1 is a paracaspase and contributes
proteolytic activity to the CBM complex, which is key for optimal
lymphocyte activation and differentiation
8–10. Altogether, CBM
complex downstream pathways play important roles in regulating
the activation, proliferation, and effector functions of lymphocytes
in adaptive immunity
11.
The pathological relevance of CARD11, BCL10, and MALT1 is
demonstrated by germline loss-of-function mutations associated
with combined immunodeficiency (CID)
12–17. In contrast,
acti-vating mutations in CARD11 promote B-cell proliferation and
are frequently found in the malignant activated B-cell-subtype of
diffuse large B-cell lymphoma (ABC DLBCL)
18–20. Furthermore,
chromosomal translocations leading to overexpression of BCL10
or MALT1 as well as generation of the API2-MALT1 fusion
protein result in oncogenic activation associated with MALT
lymphoma
21–23. The clinical impact of the CBM signalosome has
been emphasized by the discovery of MALT1 protease inhibitors
that suppress antigen responses in T-cells and kill ABC DLBCL
cells that arise from chronic BCR signaling
24–26.
In resting T-cells CARD11 is kept in an inactive conformation
that is activated through phosphorylation by protein kinases
including PKCθ and PKCβ
27,28. In the hyper-phosphorylated
conformation BCL10-MALT1 complexes are recruited via
het-erotypic interaction of the CARD11 and BCL10 CARD
domains
29,30. CARD11 acts as a molecular seed that upon
binding induces the assembly of BCL10
filaments in vitro and in
cells
31,32. While the cryo-EM structure of the BCL10
filaments
has been recently determined
31, no structural information is
available for the integration of MALT1 into the BCL10
filaments.
MALT1 constitutively associates with BCL10 in vitro and in cells.
Mutational analyses suggested that regions in the C-terminal Ser/
Thr-rich region of BCL10 interact with the N-terminal death
domain (DD) and the two Ig (immunoglobulin)-like domains
(Ig1/Ig2) of MALT1
33–36. Nevertheless, the detailed nature of the
BCL10-MALT1 interface remains unresolved.
To gain further inside into the CBM complex assembly we
determined the cryo-EM structure of the BCL10-MALT1
com-plex. Our data define the exact interfaces for BCL10
oligomer-ization as well as the interaction of BCL10 CARD and MALT1
DD. Reconstitution assays of either KO Jurkat T-cells or murine
CD4 T-cells from MALT1
−/−mice highlight the significance of
the interaction sites for CBM complex formation and activation
of all CBM downstream signaling events.
Results
Cryo-EM structure of the BCL10-MALT1
filament. To provide
structural information about the interaction of BCL10 with
MALT1 we performed cryo-electron microscopy (cryo-EM) of
the human BCL10 (full length)-MALT1 (T29-G722) complex
(Fig.
1
a). BCL10 and MALT1 were co-expressed in bacteria and
formed a stoichiometric complex that was purified to near
homogeneity (Supplementary Fig. 1a). A cleavable GST-fusion at
the N-terminus of BCL10 prevented
filament assembly during
purification and proteolytic removal of the GST-tag initiated
oligomerization to a particle size of ~100 nm as determined by
dynamic light scattering (DLS) (Supplementary Fig. 1b). An
in vitro MALT1 cleavage assay revealed that the BCL10-MALT1
complex possesses protease activity (Supplementary Fig. 1c).
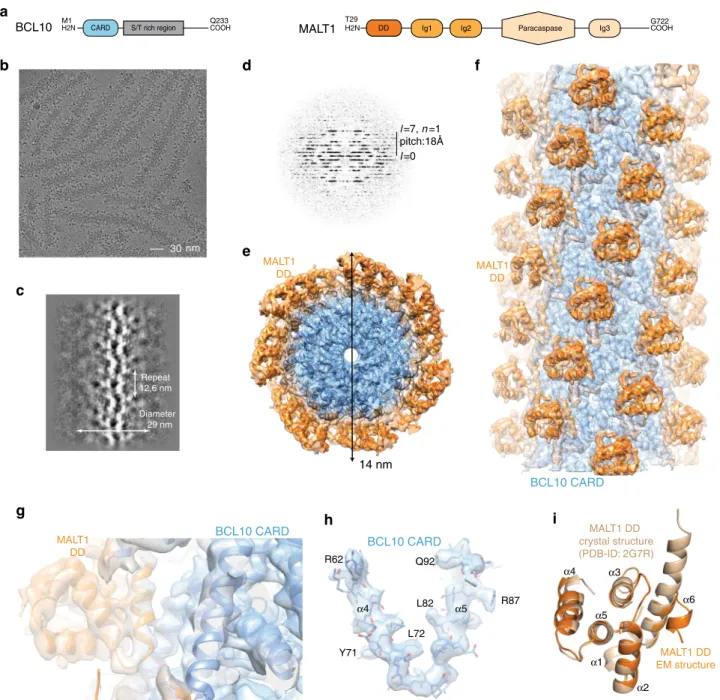
Visual inspection of cryo-EM images of the purified complex,
underpinned by 2D classification and examination of the power
spectra, revealed that BCL10-MALT1 assembles into
flexible
helical
filaments of ~29 nm in diameter, with an ordered inner
core of ~14 nm in diameter and a less defined periphery
(Fig.
1
b–d). To calculate the high-resolution structure of the
filament interior, the data were processed while limiting the
diameter to 21 nm. This analysis was performed on the very
first
image frames 2–7 (total dose 14 electrons/Å
2) to avoid sample
and image quality deterioration due to radiation damage. This
resulted in a 4.9 Å resolution map of BCL10 CARDs tightly
decorated by MALT1 DD (Fig.
1
e–g).
Our analysis revealed that BCL10-MALT1 is a left-handed
helix with a per subunit rotation of 100.8° and a rise of 5.083 Å,
resulting in 3.571 subunits of BCL10-MALT1 per helical turn.
This helical arrangement agrees with the one observed for the
BCL10 (residue 1–115) filament alone, thus indicating that the
overall arrangement of the BCL10 CARD core is largely unaltered
within the BCL10-MALT1 complex structure (Fig.
2
a–f)
31,32. The
4.9 Å resolution map of the inner
filament part enabled us to
build a pseudo atomic model of BCL10 residues 10–115 and
MALT1 residues (30–121) by flexible fitting of a BCL10
homology model and a related crystal structure of MALT1 DD
into the EM density (Fig.
1
h, i). Interestingly, the structural
comparison with the MALT1 DD X-ray structure (pdb ID: 2G7R)
reveals that in the presented EM density helix
α6 is kinked and
not forming an extended helix as previously proposed
37. The
observed fold of the kinked MALT1 helix is similar to other
CARD family members (Fig.
1
i).
BCL10
filament assembly is critical for CARD11 recruitment.
The BCL10 CARD structure is considerably stabilized in
comparison to the NMR structure due to the extensive network
of interactions within the BCL10-MALT1
filament assembly
(Fig.
2
). To obtain a clearer perception of potential
rearrange-ments of BCL10 upon interaction with MALT1, we compared
the model of the BCL10
filaments alone, with our model of
BCL10 in the BCL10-MALT1 complex
31. Thereby, we found
differences specifically in the amino acid registry that led to
altered assignments of key residues involved in BCL10-MALT1
interaction (Supplementary Fig. 2a). Based on the refinement
statistics and the FSC (Fourier Shell Correlation) curves
assessing the
fit between the maps and the models, our model is
consistent with both our and the published EM densities
31and
provides reasonable stereochemistry and geometry values
(Supplementary Fig. 2b).
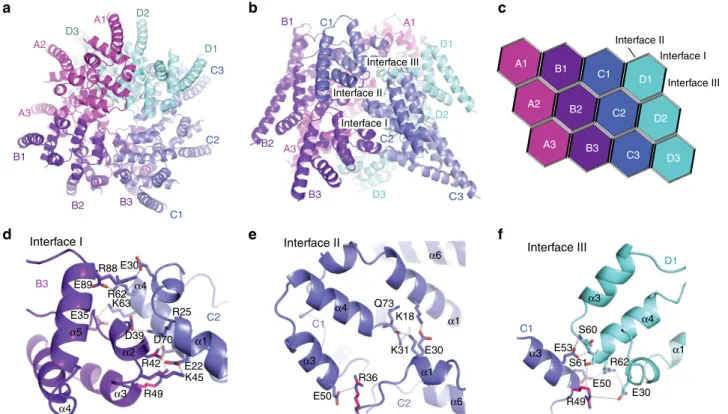
The identified BCL10 CARD-CARD interfaces, type I, II, and
III as diagrammed in Fig.
2
a–f have been previously reported and
are shown here to illustrate the composition of the BCL10 core
filament
31. The individual residues involved in the three types of
interactions, in the presented structure are highlighted in
Fig.
2
d–f. Whereas type I and type II interactions are interstrand
contacts between the helical turns (Fig.
2
c–e), the type III
interface exhibits interactions in the helical-strand direction
(Fig.
2
f). All interfaces identified by the BCL10 filament alone are
largely conserved within the BCL10-MALT1 complex within the
resolution limit of both structures
31,32(Fig.
2
d–f). Thereby, the
type I interface comprises the most extensive interactions, with
high electrostatic surface complementarity (Fig.
2
d). Additionally,
we identified residue R42 in interface I and R36 in interface II to
be important for BCL10
filament assembly (Fig.
2
d, e). To
validate the importance of the interfaces we generated
site-directed mutants and compared their capability to oligomerize
in vitro with those of the wild-type complex. The BCL10
mutations R42E, R49E, and R36E abrogated the ability of the
BCL10-MALT1 complex to oligomerize, while the interaction
with MALT1 was retained as shown by DLS and co-purification,
respectively (Supplementary Fig. 2c, d). This emphasizes the
relevance of the identified interaction regions for filament
assembly but not MALT1 interaction.
Previously, the effect of BCL10 interface I-III mutants on
NF-κB and MALT1 activation was analyzed upon overexpression
32.
Since
filament assembly with recombinant purified
BCL10-MALT1 is strongly influenced by local protein concentration,
we aimed to investigate the biological effects of BCL10
oligomerization mutants in a clean genetic setting without
overexpression or perturbation by endogenous BCL10. To this
end we generated BCL10 KO Jurkat T-cells by CRISPR/Cas9
technology using sgRNA targeting Exon1 of human BCL10
30 nm
b
DD Ig1 Ig2 Paracaspase Ig3
H2N COOH
MALT1
T29 G722
H2N CARD S/T rich region COOH
BCL10 M1 Q233
a
f
14 nmc
d
e
h
i
α4 α5 BCL10 CARD MALT1 DD BCL10 CARD Diameter 29 nm Repeat 12,6 nm l=0 l=7, n=1 pitch:18Å R62 Y71 L72 L82 R87 Q92 α1 α2 α5 α6 α4 α3 MALT1 DD crystal structure (PDB-ID: 2G7R) MALT1 DD EM structureg
MALT1 DD BCL10 CARD MALT1 DDFig. 1 Cryo-EM reconstruction and atomic model of the BCL10-MALT1filament. a Domain organization of the BCL10 and MALT1 protein constructs. b Example cryo-EM micrograph of the BCL10-MALT1 complexfilaments. c, d 2D class averages and corresponding power spectra of BCL10-MALT1 filaments used for helical parameter determination. e, f Overall architecture of the BCL10-MALT1 filament assembly shown together with the cryo-EM density, clipped top and side view, respectively. The map shows the inner well-structured part of thefilament at an overall resolution of 4.9 Å (FSC curve see Supplementary Fig. 8a). This part consists of the BCL10 CARD (residues 10–115) and the MALT1 DD (residues 30–121) colored blue and orange, respectively.g, h Example parts of the cryo EM density map shown together with the BCL10-MALT1 DD and the atomic model of BCL10 shown in ribbon and stick representation, respectively.i Overlay of the MALT1 DD cryo-EM and crystal structure (pdb ID: 2g7r) colored orange and beige, respectively
(Supplementary Fig. 3a). After limiting dilution, we obtained a
BCL10 KO Jurkat T-cell clone, which was reconstituted with
BCL10 wt or the BCL10 interface I (R42E) and II (R36E) mutants,
which lost the ability to assemble
filaments in vitro. To exclude
that the cellular effects are due to overall conformational
alterations in the BCL10 CARD, by changing positively charged
arginines to negatively charged glutamic acids, we included the
less severe BCL10 R42A substitution (Fig.
3
b). Lentiviral infection
led to homogenous transduction of Jurkat T-cells as judged by
co-expressed surface marker
ΔCD2 and equivalent expression of all
constructs close to endogenous levels in the BCL10 KO cells
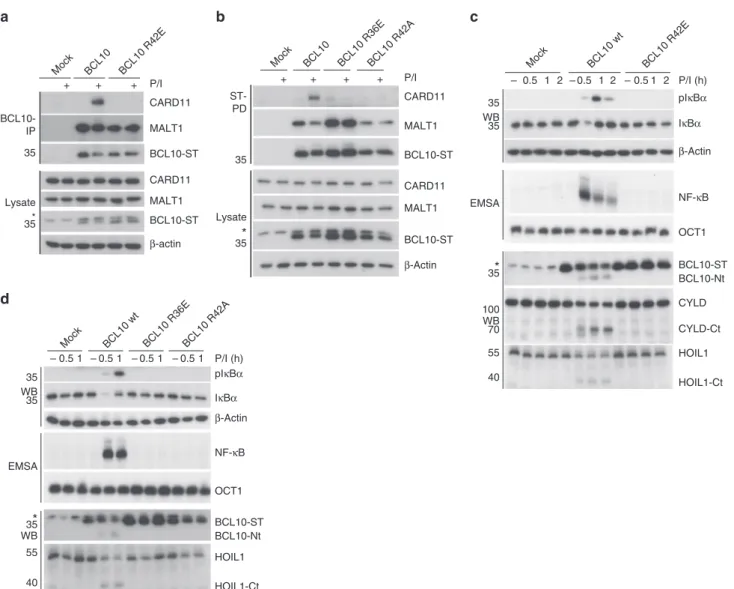
(Supplementary Fig. 3b–e). Precipitation of BCL10 either by
co-IP or StrepTactin pull-down (ST-PD) demonstrated that the
mutation in the BCL10
filament interfaces I and II prevented the
PMA/Ionomycin (P/I) inducible recruitment of BCL10 to
CARD11 and thus stimulus-dependent CBM complex formation
(Fig.
3
a, b). However, none of the mutants impaired constitutive
binding of BCL10 to MALT1, suggesting that the overall protein
structure is still intact.
To determine the functional relevance of the BCL10–BCL10
interfaces for T-cell signaling, we stimulated the Jurkat T-cells
expressing the distinct BCL10 mutants and analyzed NF-κB
signaling and MALT1 protease activation (Fig.
3
c, d). Indeed,
interface I mutations BCL10 R42E or R42A and interface II
mutation R36E completely abolished IκBα phosphorylation and
degradation as well as NF-κB DNA binding after P/I stimulation.
Likewise, activation of the MALT1 protease was absent in all
BCL10
filament mutants as determined by the ability to cleave the
substrates BCL10, CYLD, and HOIL1 (Fig.
3
c, d). Hence, under
physiological conditions the correct assembly of the BCL10 core
filament via its CARDs is crucial for stimulus-dependent
CARD11 recruitment and thus CBM complex assembly and
downstream functions.
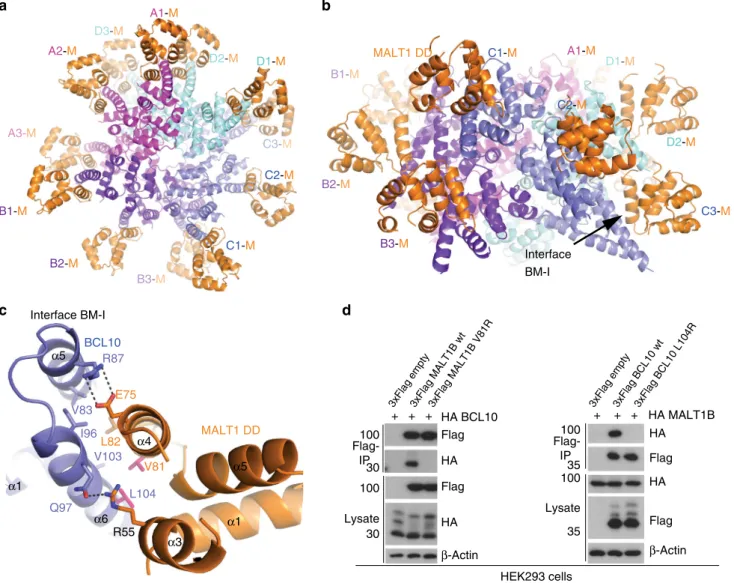
MALT1 binds to BCL10 via DD and CARD interaction. Besides
unravelling the architecture of the BCL10 CARD
filaments, the
4.9 Å resolution cryo-EM map provides the detailed molecular
structure of the BCL10-MALT1 interaction surface (Fig.
4
a–c).
The MALT1 DD interacts with BCL10 at the rim of the CARD
core
filament in a 1:1 stoichiometry. Thereby, the C-termini of
MALT1 DD domains are pointing away from the core
filament. A
close-up view of the BCL10-MALT1 interaction site I (BM-I)
illustrates that MALT1 binds to the C-terminal part (BCL10 helix
α6) of the BCL10 CARD forming a new interface that is distinct
from the BCL10
filament interfaces I–III (Fig.
4
a–c). Thus, the
structure underscores that BCL10
filament assembly is not
required for MALT1 association, which agrees with the cellular
pre-assembly of the BCL10-MALT1 complex without stimulation
(see Fig.
3
a, b). In BM-I, the two most central interacting residues
of MALT1 are V81 and L82 situated in helix
α4 (Fig.
4
c). The
opposing hydrophobic surface in BCL10 is formed by L104, V103
in helix
α6 and V83 and I96 in helices α5 and α6, respectively.
Several salt bridges stabilize the hydrophobic core contacts
(Fig.
4
c).
To investigate the significance of the identified BM-I, we
mutated residues on both sides of the interface. Co-purification of
GST-BCL10 demonstrates a severely reduced binding of MALT1
V81R mutant in vitro (Supplementary Fig. 4a). In line, the single
mutation V81R completely disrupted the interaction of BCL10
after co-expression in HEK293 (Fig.
4
d). Vice versa, BCL10
L104R abolished association of MALT1 to BCL10 (Fig.
4
d).
Further, the cryo-EM structure indicated a potential second
interface between MALT1 DD
α4 and α5 segment and the
adjacent BCL10 helix
α6 at the C-terminus of the core CARD
filament (BM-II; Supplementary Fig. 4b, c). However, mutation of
potential contact points Q76A/E98R as well as the putative
disulfide bond C77-C91 (C77A) in MALT1 did not affect
BCL10-B3 C2 R88 E89 D39 E35 R25 R42 K45 R49 E30 R62 K63 D70 E22 α3 α5 α2 α4 α4 α1 D1 C1 S61 S60 E53 E50 R62 E30 R49 α3 α4 α1 α3 C2 E50 R36 Q73 K18 E30 α1 α6 α1 α6 α4 α3 K31 C1 A1 A3 A2 B1 B2 B3 C1 C2 C3 D1 D2 D3 C1 C2 C3 B2 B3 A1 B1 C1 D1 A2 B2 C2 D2 A3 B3 C3 D3 Interface II Interface I Interface III
Interface II Interface III
D1 D2 A1 B1 Interface I A3 D3
a
b
c
f
e
d
Interface II Interface III Interface IFig. 2 Core structure of the BCL10 CARDfilament. a, b Top and side view of the BCL10 protein model obtained by interpretation of the BCL10-MALT1 complex cryo-EM density.c Schematic diagram of the BCL10 helical assembly. Each CARD is represented as a hexagon and the three interfaces are indicated accordingly.d, f Detailed view of the three BCL10 interaction surfaces I (d), II (e), and III (f). Interacting residues are shown in stick representation. Sites mutated R42, R36 are highlighted in magenta
MALT1 association in co-IPs (Supplementary Fig. 4d), suggesting
that BM-II is not essential for BCL10-MALT1 complex
formation.
CBM assembly and T-cell activation relies on MALT1 binding.
To assess the biological impact of the newly identified
BCL10-MALT1 interaction surfaces, we expressed BM-I mutants located
on both sides of the interface in BCL10 or MALT1 KO T-cells,
respectively (Fig.
5
). MALT1 KO Jurkat T-cells were generated by
CRISPR/Cas9 technology
38. In BCL10 we used the single
muta-tion L104R in helix
α6 of the CARD. In MALT1 we analyzed
mutation V81R or L82D in
α4 of the DD opposite to the BCL10
α6 helix. Using lentiviral transduction, we obtained Jurkat T-cells
that expressed all BCL10 or MALT1 constructs homogenously at
endogenous levels (Supplementary Fig. 5a-f). Indeed, BCL10
co-IP experiments revealed that missense mutation either in BCL10
(L104R) or MALT1 (V81R or L82D) completely abrogate the
constitutive binding of BCL10 to MALT1 in resting Jurkat T-cells
(Fig.
5
a–c). For BCL10 L104R and MALT1 V81R, loss of
inter-action was also confirmed by ST-PD of BCL10 or MALT1,
respectively (Supplementary Fig. 5g-h). Moreover, loss of MALT1
led to a severely reduced BCL10 recruitment to CARD11 after P/I
stimulation (Fig.
5
b, c). In all BCL10 and MALT1 interface
mutants the binding of BCL10 to CARD11 was impaired,
pro-viding evidence that the constitutive association of BCL10 and
MALT1 is a prerequisite for CBM complex assembly (Fig.
5
a–c).
Thus, in T-cells the BCL10-MALT1 interaction significantly
contributes to the dynamics of CBM complex formation
strengthening the importance of interface BM-I.
To determine the functional relevance of the BCL10-MALT1
interface for T-cell signaling and MALT1 activation, we
stimulated the Jurkat T-cells expressing the MALT1 and BCL10
BM-I mutants (Fig.
5
d–h). In line with its critical role for
assembly of the entire CBM complex, IκBα phosphorylation/
degradation and NF-κB DNA binding after T-cell stimulation
were abolished. Also, activation of the MALT1 protease was
absent in the BCL10 L104R (Fig.
5
d, e) as well as MALT1 V81R
(Fig.
5
f, g) or MALT1 L82D (Fig.
5
h) mutants, as evident from
the lack of substrate cleavage. In contrast, BM-II mutations
Q76A/E98R and C77A, which did not significantly impair
BCL10-MALT1 association, did not alter NF-κB responses
(Supplementary Fig. 4d and 5i). To address the importance of
P/I + + + * 35 MALT1 BCL10-ST Lysate CARD11 β-actin 35 BCL10-ST MALT1 CARD11 BCL10-IP Mock BCL10 BCL10 R42E
a
d
c
b
P/I + + + + MALT1 BCL10-ST CARD11 β-Actin BCL10-ST MALT1 CARD11 Lysate ST-PDMock BCL10 BCL10 R36EBCL10 R42A
35
*
35 35 35 WB EMSA WB P/I (h) 0.5 – 1 –0.5 1 –0.5 1 –0.5 1Mock BCL10 wt BCL10 R36EBCL10 R42A
OCT1 BCL10-ST HOIL1 HOIL1-Ct BCL10-Nt 35
*
55 40 NF-κB IκBα pIκBα β-Actin EMSA P/I (h) 0.5 1 – 2 – – 35 35 WB WB OCT1 0.5 1 2 0.5 1 2 Mock BCL10 wt BCL10 R42E*
CYLD CYLD-Ct BCL10-ST HOIL1 HOIL1-Ct BCL10-Nt 35 100 70 55 40 NF-κB IκBα pIκBα β-ActinFig. 3 Functional analyses of BCL10-BCL10 interfaces in Jurkat T-cells. a, b BCL10 KO Jurkat T-cells lentivirally reconstituted with BCL10 wt, R42E, R36E or R42A constructs were stimulated P/I for 20 min and CBM complex formation was monitored by BCL10-IP (a) and Strep-tag II (ST) pull down (PD) (b). c, d BCL10 KO Jurkat T-cells reconstituted with BCL10 wt or BCL10-BCL10 interface mutants were stimulated with P/I for the times indicated. NF-κB activation was determined by IκBα WB and EMSA. Activation of the MALT1 protease was monitored by WB analyses of the substrate cleavage. Asterisks indicate non-specific cross-reactivity of the BCL10 antibody
the BCL10-MALT1 interface BM-I for T-cell activation in a
physiological setting, we purified CD4 T-cells from MALT1
−/−mice and reconstituted the cells with either MALT1 wt or the
MALT1 BM-I mutant V81R. Effects on NF-κB signaling and IL-2
production after MALT1 reconstitution were determined by
single cell FACS analyses. Retroviral transduction led to equal
expression of MALT1 wt and the mutant construct V81R in
primary T-cells (Fig.
5
i). Infected cells were identified by the
surface marker Thy1.1 (Supplementary Fig. 6a-b). As expected,
IκBα was not degraded and IL-2 was not significantly induced in
Thy1.1-negative MALT1
−/−T-cells (Supplementary Fig. 6a-b).
When gated on the transduced Thy1.1-positive CD4 T-cells
population, MALT1 wt but not BM-I interface mutant V81R was
able to rescue NF-κB signaling after P/I stimulation as evident
from IκBα degradation (Fig.
5
j). Further, strong upregulation of
IL-2 in response to P/I stimulation or anti-CD3/CD28 co-ligation
in CD4 T-cells was impaired in the MALT1 V81R mutant
expressing cells as determined by intracellular FACS staining
(Fig.
5
k, l). Thus, the identified BCL10-MALT1 interface I is
essential for bridging TCR stimulation to downstream signaling
and T-cell activation.
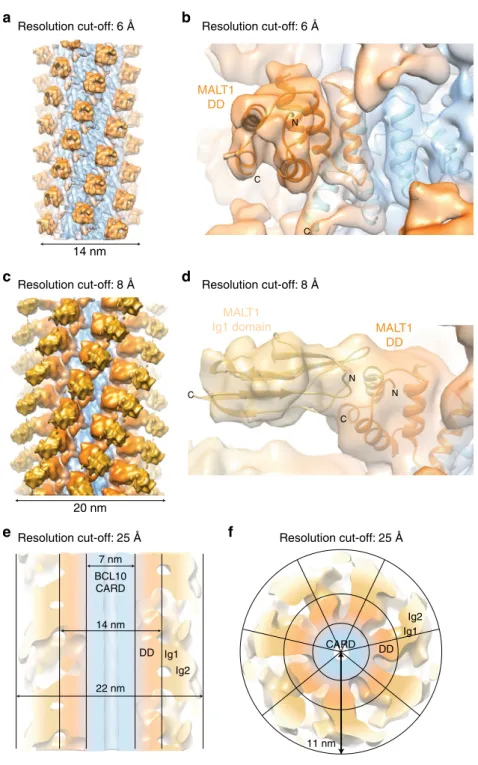
Architecture of the BCL10-MALT1 holo-complex. To gain
more information about the structural organisation of the
addi-tional MALT1 domains (Ig1-Ig2-paracaspase-Ig3) around the
BCL10-MALT1 DD skeleton, the cryo EM data have been
ana-lysed by a second approach. The diameter constraints have been
relieved to 29 nm and the dose increased to 32 electrons/Å
2(frames 2–16) which yielded an overall 5.9 Å, but highly
aniso-tropic resolution reconstruction of the entire BCL10-MALT1
complex domains (Fig.
6
and Supplementary Fig. 8). In the
density
filtered to 6 Å the MALT1 DDs are rigidly attached to the
BCL10 core (Fig.
6
a, b). The EM density
filtered to 8 Å depicts
that the subsequent MALT1 domain Ig1 is clearly visible and we
were able to rigid body dock this domain. The Ig1 domain is
pointing away from the BCL10-MALT1 DD core
filament
separating the C-terminal domains from the inner core of the
filament (Fig.
6
c, d). Together with the
flexible linked Ig2 domain
this arrangement supposedly allows for dimerization of the
MALT1 paracaspase domains, which is key for MALT1 protease
activation
39. Further, the map with a resolution cut-off at 25 Å
indicates how a stable inner core formed by BCL10 CARD and
the MALT1 DD-Ig1 fragments orchestrates a
flexible outer
Q97 V81 R87 E75 L82 V83 I96 L104 R55 V103 α6 α1 α5 α3 α4 α5 α1 BCL10 Interface BM-I A1-M D3-M D2-M D1-M C3-M C2-M C1-M B3-M B2-M B1-M A3-M A2-M C1-M C2-M C3-M B B2-M B3-M D1-M D2-M A1-M B1-Mb
d
a
c
MALT1 DD MALT1 DD Interface BM-I3xFlag empty3xFlag MALT1B wt + + + IP Lysate 30 30 100 100 3xFlag MALT1B V81R HEK293 cells HA MALT1B + + + 100 100 35 35 Flag IP Lysate HA Flag HA 3xFlag empty3xFlag BCL10 wt3xFlag BCL10 L104R HA BCL10 Flag HA Flag HA β-Actin β-Actin
Fig. 4 Architecture of the BCL10-MALT1 interface. a, b Top and side view of one repeat of the BCL10-MALT1 holo-complex as visible in the cryo-EM density. Position of BCL10-MALT1 interface BM-I is indicated in (b). c Close up view of the BCL10 and MALT1 interaction site I (BM-I) shown as ribbon model in blue and orange, respectively. The interacting residues are shown in stick representation. Mutations introduced are colored magenta.d HEK293 cells were co-transfected with tagged MALT1B and BCL10 wt and mutant constructs as indicated. Co-IP was carried out using anti-Flag antibodies and analyzed by WB for co-precipitation
MALT1 platform (Fig.
6
e, f). The top view illustrates a
‘paddle
wheel-like’ architecture of the BCL10-MALT1 complex with the
MALT1 Ig1-Ig2-paracaspase domains forming the more
adap-table periphery of the
filament (Fig.
6
f). Due to the
flexibility of
the C-terminal MALT1 domains, we could not provide an
unambiguous
fit of the MALT1 Ig2-paracaspase-Ig3 domains.
Discussion
Our cryo-EM structure resolved the inner core of the
BCL10-MALT1 assembly at 4.9 Å resolution. We identified the BCL10
CARD and MALT1 DD interface BM-I and cell-based assays
provide compelling proof that the
filaments channel all CBM
downstream signaling events. Since the peripheral C-terminal
b
c
d
a
f
g
h
e
Cell countMock MALT1B WT MALT1B V81R
IκBα FITC
Medium P/I
Medium CD3/CD28
Cell count
IL-2 APC
Mock MALT1B WT MALT1B V81R
100 80 60 40 20 0 100 80 60 40 20 0 100 80 60 40 20 0 101 102 103 104 105 101 102 103 104 105 101 102 103 104 105 101 102 103 104 105 101 102 103 104 105 101 102 103 104 105 101 102 103 104 105 101 102 103 104 105 101 102103 104105 20.9 % 4.67 % 10.7 % Cell count IL-2 APC
Mock MALT1B WT MALT1B V81R Medium P/I 5.28 % 25.7 % 8.51 % 35 CARD11 MALT1 BCL10-ST Lysate BCL10-IP MALT1 BCL10-ST 35 CARD11
*
P/I + + + β-Actin Mock BCL10 wtBCL10 L104R Lysate BCL10-IP 100 100 + + + CARD11 MALT1-ST BCL10 MALT1-ST BCL10 P/I CARD11 β-ActinMockMALT1B wtMALT1B V81R
MALT1–/– CD4
MockMALT1B wtMALT1B V81R
MALT1-ST Lysate BCL10-IP 100 100 + + + P/I CARD11 MALT1-ST BCL10 MALT1-ST BCL10 CARD11 β-Actin
MockMALT1B wtMALT1B L82D
+ + + WB EMSA 100 MALT1-ST P/I OCT1 NF-κB IκBα pIκBα β-Actin
Mock MALT1B wtMALT1B V81R
+ + + WB EMSA P/I BCL10-ST OCT1
*
35 NF-κB IκBα pIκBα β-Actin Mock BCL10 wtBCL10 L104R 35 100 70 70 55 55 40*
β-Actin P/I (h) 2 1 – – 1 2 – 1 2 CYLD CYLD-Ct MALT1 HOIL-1-Ct HOIL-1 REGNASE-1 REGNASE-1-Ct BCL10-ST BCL10-Nt Mock BCL10 wtBCL10 L104R EMSA WB WB 100 55 40 100 70 P/I (h) 0.5 – 1 –0.5 1 –0.5 1Mock MALT1B wtMALT1B L82D
OCT1 CYLD CYLD-Ct MALT1-ST HOIL1 HOIL1-Ct NF-κB IκBα pIκBα β-Actin P/I (h) 2 1 – – 1 2 – 1 2 100 100 70 55 40 70 55
*
*
Mock MALT1B wtMALT1B V81R
β-Actin CYLD CYLD-Ct MALT1-ST HOIL-1-Ct HOIL-1 REGNASE-1 REGNASE-1-Ct β-Actin
j
k
l
i
regions of MALT1 and BCL10 are
flexible, it is unlikely that
other surfaces are directly contributing to BCL10 binding. This is
remarkable, because previous co-IPs using overexpression
sug-gested that BCL10-MALT1 may associate through a more
extended binding surface. BCL10-MALT1 interaction was lost by
a small deletion at the C-terminus of the CARD (aa 106–120),
which overlaps the MALT1 binding surface that has been
iden-tified here by cryo-EM
34. However, other deletions in the BCL10
C-terminus also impaired the tight association of BCL10 to
MALT1
36. Moreover, on the side of MALT1 it was shown that
the DD as well as the Ig1/Ig2 domains are contributing to the
BCL10 binding in cells
33. Thus, we speculate that regions outside
the direct BCL10-MALT1 interface are important for the
con-formation of the CARD and the DD and thus indirectly affect the
interaction. In fact, the crystal structure of the MALT1 DD alone
indicates that in the absence of the Ig1/Ig2 domains the
α6 helix
is not kinked, which could certainly prevent BCL10 from
binding
37.
Further, we found that MALT1 association to BCL10 is
required for the stimulus-dependent recruitment of BCL10 to
CARD11. In vitro CARD11 and BCL10 form complexes at high
concentrations
31,32. Under physiological conditions, however,
only the MALT1-BCL10 complex adopts a conformation that
allows efficient CARD11 association. Mechanistically, MALT1
may either facilitate a BCL10 conformation that promotes
CARD11 binding or wrapping of BCL10 by MALT1 may stabilize
otherwise labile BCL10 core
filaments. Clearly, the cryo-EM
structure reveals stoichiometric binding of BCL10 to MALT1 and
that BCL10 oligomerization is not required for MALT1
associa-tion, which is in line with the constitutive pre-assembly of
BCL10-MALT1 complexes in cells. Furthermore, BCL10 is decorated with
ubiquitin chains and these BCL10 modifications have been
sug-gested to activate downstream signaling partially bypassing the
necessity for MALT1
6,40. However, the absence of a
CARD11-BCL10 binding in MALT1 deficient or BM-I mutant cells indicates
that signaling competent CARD11-BCL10 sub-complexes do not
exist and downstream effects are relying on MALT1 association.
The cellular analyses of structure-guided mutations in the
BCL10
filament interfaces I and II highlight the necessity of
fila-ment assembly for CARD11 recruitfila-ment. Since none of these
mutations affect MALT1 association, it is quite unlikely that they
destroy the overall conformation of the BCL10 CARD or the
interface to CARD11. In line with the modeled CARD11-BCL10
interactions
32, we propose that the weak affinity of BCL10
monomers for CARD11 needs to be stabilized by BCL10
oligo-merization, which augments the affinity by presenting multiple
interfaces. In fact, the data implicate that recruitment of BCL10 to
CARD11 and BCL10 oligomerization are highly interconnected
processes that cannot be uncoupled. Thus, BCL10 oligomerization
may boost an initial low affinity interaction leading to rapid
CBM complex assembly and threshold responses after stimulation.
Furthermore, an interesting aspect regarding the
BCL10-MALT1 core structure is, that BCL10 is degraded upon
pro-longed T-cell stimulation, leading to CBM complex disassembly
and termination of TCR-signaling
41,42. Proteasomal degradation
requires unfolding of the proteins and thus the rigidity of BCL10
core
filaments can explain why BCL10 is primarily removed
through selective autophagy and lysosomal degradation
41,43.
However, despite the 1:1 stoichiometry of BCL10-MALT1 in the
complex, MALT1 is stable and not degraded after stimulation
43.
At present it is unclear how MALT1 is disconnected from the
BCL10
filaments. MALT1 auto-cleavage at R149 could certainly
release the C-terminal fragment, but there is no evidence for the
appearance of a stabilized DD-truncated form of MALT1 after
stimulation
44. The BCL10 C-terminus is most likely
flexible and
was not visible in the cryo-EM map, but interestingly
hyper-phosphorylation of BCL10 in this Ser/Thr-rich region impairs
binding to MALT1
36. Thus, post-translational modifications of
BCL10 or MALT1 may be involved in the release of MALT1 to
separate it from removal by autophagy.
Despite the lower resolution in the outer region of the 29 nm
wide BCL10-MALT1
filaments, the cryo-EM map depicts how the
C-terminal MALT1 domains are emanating from the
BCL10-MALT1 DD core
filament forming a ‘paddle wheel-like’ shape. In
spite of the moderate resolution of the map of the outer regions in
the BCL10-MALT1 complex, the current data allows us to
pro-vide a model in which MALT1 C-terminal region covering the
Ig2-paracaspase-Ig3 domain is
flexibly attached to the
BCL10-MALT DD core
filaments. The flexibility and positioning of the
individual MALT1 molecules in the
filament periphery provides a
platform for the recruitment of mediators like TRAF6 to foster
NF-κB signaling
38. Further, mono-ubiquitination, substrate
binding and paracaspase domain dimerization will promote
protease activation
39,45. Future studies must elucidate the
mechanism of MALT1 protease activation in the complex and
how the BCL10-MALT1 platform integrates factors like TRAF6,
TAK1 and NEMO/IKKβ to initiate downstream processes.
Methods
Expression and purification. Human MALT1 isoform B amino acids T29 to G722 and the V81R mutant of this construct were cloned by Nde1 and Not1 restriction sites into a modified pET28a vector (Novagen), containing a N-terminal PreScis-sion Protease (GELifeSciences) cleavable 8 × -His-tag sequence (Supplementary Table 2). Human BCL10 wt and the respective R36E, R42E, R49E mutants were cloned into pGEX-6P-2 vector (GELifeSciences) using BamH1 and Xho1 restric-tion sites (Supplementary Table 3)36. The corresponding plasmids were co-transformed in Escherichia coli Rosetta™ (DE3) strain (Novagen), protein expres-sion was induced by addition of 0.2 mM IPTG and performed overnight at 18 °C. Cells were resuspended in lysis buffer containing 50 mM Hepes pH= 7.5, 200 mM NaCl, 7 mM Imidazol and 4 mMβ-mercaptoethanol. Cells were lysed by sonication and clarified by centrifugation. The BCL10-MALT1 complex was further purified by Ni-NTA affinity chromatography (Qiagen) using the lysis buffer containing 250 mM Imidazol as elution buffer. Subsequently, the NiNTA elution fraction was loaded on a Glutathion-sepharose column (GE-Healthcare) and eluted with lysis buffer containing 20 mM reduced Glutathion. Size exclusion chromatography Fig. 5 Functional analyses of the MALT1-BCL10 interface in Jurkat and murine CD4 T-Cells. a BCL10 KO Jurkat T-cells were lentivirally reconstituted with BCL10 wt or BM-I mutant L104R constructs. After 20 min P/I stimulation CBM complex formation was investigated by BCL10-IP. Asterisk indicates non-specific cross-reactivity of the BCL10 antibody. b, c MALT1 KO Jurkat T-cells were lentivirally reconstituted with MALT1 wt or BM-I mutant constructs V81R (b) or L82D (c). P/I stimulation and CBM complex formation was investigated as in (a). d–h NF-κB signaling (d, f, h) and MALT1 protease activation (e, g, h) in BCL10 (d, e) or MALT1 (f–h) BM-I mutant reconstituted Jurkat T-cells after P/I treatment was analyzed by Western Blot (IκBα phosphorylation and degradation) and NF-κB-DNA binding studies (EMSA). Induction of MALT1 protease activity was monitored by cleavage of MALT1 substrates in WB as indicated.i Expression of MALT1 wt and BM-I mutant (V81R) was determined by WB after enrichment of infected murine MALT1−/−CD4 T-cells.j MALT1−/−CD4 T-cells transduced with MALT1 wt or BM-I mutant were stimulated for 30 min with P/I. IκBα expression and degradation were measured by FACS and transduced cells were gated by co-staining of Thy1.1 (Supplementary Fig. 6a).k, l MALT1−/−CD4 T-cells transduced as in (j) and stimulated for 5 h with P/I (k) or anti-CD3/CD28 (l). Intracellular IL-2 production was determined by FACS and transduced cells were gated by co-staining of Thy1.1 (Supplementary Fig. 6b)
(S200 26/60, GE-Healthcare) was performed to separate BCL10-MALT1 complex fractions. Size exclusion buffer contained 25 mM Hepes pH= 7.5, 200 mM NaCl and 2 mMβ-mercaptoethanol.
MALT1 activity assay. The MALT1 cleavage assay was performed with 500 nM or 10 µM of BCL10-MALT1filaments, GST-BCL10-MALT1 species, and MALT1 V81R mutant. Protein samples were incubated in 384-well non-binding micro-plates and 20μM of the MALT1 substrate Ac-LRSR-AMC was added. After 2 min incubation at 30 °C, thefluorescence of cleaved AMC was measured over 1 h by a Synergy 2 Microplate Reader (Biotek, US). The MALT1 protease activity is represented in relativefluorescence units and data from at least three independent experiments were used.
BCL10-MALT1 complex formation analysis. The BCL10-MALT1 complex frac-tions were pooled and concentrated to 0.5μM. Filament formation was initialized by addition of PreScission protease (GE Healthcare) in equimolar amounts. Polymerization of BCL10-MALT1 species was monitored by dynamic light scat-tering (Viscotek 802 DLS) as a function of time over 100 min. Higher order species (above 104nm) were excluded from data evaluation. Data was analyzed by the OmniSIZE 3.0 software package (Viscotek).
MALT1 complex preparation for cryo electron microscopy. BCL10-MALT1 complex fractions were concentrated stepwise to 1 mg/ml. Higher mole-cular species formation was monitored for each concentration step by dynamic light scattering (Viscotek 802 DLS). Filament formation was initialized by addition of equimolar amounts of PreScission Protease (GE Healthcare) and performed
7 nm 14 nm 22 nm Ig1 Ig2 BCL10 CARD DD
a
b
c
d
e
f
14 nm MALT1 DD MALT1 DD MALT1 Ig1 domain 20 nmResolution cut-off: 6 Å Resolution cut-off: 6 Å
Resolution cut-off: 8 Å Resolution cut-off: 8 Å
Resolution cut-off: 25 Å Ig1 CARD Ig2 DD 11 nm Resolution cut-off: 25 Å N C C N N C C
Fig. 6 Structural organisation of additional MALT1 domains in framework of the BCL10-MALT1filament. a, b EM density map of the well-ordered inner core of the BCL10-MALT1filament shown together with the atomic model of BCL10 (blue) and MALT1 DD (orange) as built in the 4.9 Å density map (map sharpening B-factor applied:−200 Å2).c, d Reconstructed density mapfiltered to 8 Å indicates the orientation of the MALT1 Ig1 domain shown as ribbon
and colored yellow (B-factor applied:−100 Å2).e, f Paddle-wheel like architecture of the BCL10-MALT1filament revealed by the EM-density filtered to 25
overnight at 12 °C. Analytical size exclusion chromatography (S200 5/150 GL) was performed to separate BCL10-MALT1filaments from non-oligomerized protein. Directly before blotting Octyl-beta-Glucoside was added to the selected size exclusion fraction with afinal concentration of 0.001%. 4.5 µl of the BCL10-MALT1 sample was applied on glow-discharged R1/2 grids (Quantifoil Cu R1/2, 300 mesh). The grids were blotted for 3 s at 95 % humidity and 15 °C and plunge-frozen in liquid ethane using a Leica Plunger (FEI).
Cryo electron microscopy data collection. Cryo-EM images of the BCL10-MALT1 complex were collected on a 200 keV Talos Arctica microscope equipped with a Falcon III detector (FEI). In total 662 micrographs were collected auto-matically using the EPU software (FEI). Micrographs were acquired in nano-probe mode using 49 movie frames with a dose of ~2 electrons/Å2/frame resulting in a total dose of 98 electrons per Å2at a pixel size of 1.002 Å.
Helical reconstruction. In order to obtain both a higher resolution map of the core of the BCL10-MALT1filaments, and a lower resolution map of the entire assembly, we performed two 3D refinements, varying the diameter limitation used during refinement, and the total dose used prior to particle extraction. For the higher resolution map, the frames 2 to 7 (total dose ~14 electrons/Å2) out of a total of 49 frames were motion-corrected and dose-weighted using MotionCor246, while for the lower-resolution map, the frames 2 to 16 (total dose ~32 electrons/Å2) were processed. The low dose dataset was used to determine the helical symmetry and to obtain the map of the BCL10-MALT1DDfilament core, while the higher dose dataset enabled to get information about the periphery of thefilaments.
For both datasets, the defocus estimation was performed with CTFFIND/ CTFTILT47. In total, 2618 straight sections offilaments were boxed manually using the e2helixboxer submodule of EMAN248from a selected subset of 370 micrographs. The average length of picked BCL10-MALT1filament sections was ~756 Å and the total length ~0.2 mm (Supplementary Table 1). All subsequent processing steps were performed in the helical reconstruction software package SPRING49. In total 25,576 segments were extracted using a segment size of 500 Å and segment step size of 30 Å. For 2D classification and initial symmetry estimation, phase-flipped, verticalized segments were extracted from the low dose dataset, whereas for symmetry refinement and 3D reconstruction, convolved, non-rotated segments were used. The sum of the power-spectra of all verticalized segments was calculated using Segmentexam module, confirming the helical nature of the specimen. Helical parameters were determined as follows. First, 40 class averages were obtained using k-means clustering algorithm from SPARX50as implemented in the Segmentclass module. Class averages showed a repetition of the projection pattern along the helical axis every ~126 Å, suggesting that this distance was a close estimate of the repeat c. The sum of the power spectra of 2D class averages padded in 1080*1080 pixels boxes and showing the biggest number of layer lines (11 class-averages) was then calculated for symmetry estimation. Layer lines are positioned at multiples of ~1/126 Å−1, confirming the initial estimation of the repeat (Supplementary Fig. 7a). A strong layer line (l= 7) with a first intensity maximum near the meridian (Bessel order n = 1) was attributed to the pitch P, with a height of 1/18 Å−1. Worthy of note, other CARD domain assemblies have their layer line corresponding to the pitch at position l= 951. Therefore, the structure repeats after 7 helix turns and the possible solutions of the number of units s are such that s*7= u; u being the integer corresponding to the number of units in the repeat c. Given a range of s between 1.5 and 4.5, as estimated from the size of the subunit, the pitch, and the reported symmetries for CARD assemblies in the literature, we defined a range of possible values for u of 10 to 32. For each u in this range, we calculated all ratios s= u/7, excluding the solutions with s integer, as those solutions would correspond to a helix with a repeat c equal to P. Retained solutions have layer line heights matching those observed in the experimental power spectra, but have different predicted Bessel orders n for each layer line. The compatibility between predicted n’s and experimental meridional distance offirst intensity maximum along layer lines in the sum of power spectra was then assessed, to narrow down the number of possible symmetries. These symmetries were further used to generate low-resolution 3D models from the 2D class-average with most signal in its power spectrum (Supplementary Fig. 7b), with the module Segclassreconstruct. Only one symmetry, with s= 3.571 units/turn, gave a plausible model in terms of density distribution (Supplementary Fig. 7c). This symmetry and the corresponding47 low-resolution model were used as input for 3D refinement using Segmentrefine3D, with a limitation of diameter of 210 Å applied on the reference model at each iteration, giving an initial map with an average resolution of 5.7 Å. Comparison with existing CARD domain atomic models showed that the helix was left-handed. Importantly, when a cylinder was used as initial model instead of the model constructed from the class-average, the refinement couldn’t converge to a correct 3D structure. The helical symmetry was further refined using segrefine3dgrid module, still using a diameter of 210 Å, to a pitch of 18.15 Å and 3.571 subunits per turn, corresponding to a helical rise of 5.083 Å and a helical twist of−100.81°.
Using the refined symmetry parameters and a strong segment selection based on geometrical restraints49,52such as calculatedfilament straightness (60% of straightestfilaments kept) and forward x-shift difference (limited to 6 Å), the final map of thefilament core was obtained using a refinement diameter of 210 Å, with 8591 segments corresponding to 51,546 asymmetric units after symmetrization.
The overall resolution of this map estimated at Fourier shell correlation (FSC) cutoff of 0.143 was 4.9 Å (Supplementary Table 1, Supplementary Fig. 8). This map was used as an initial model for the processing of the higher dose dataset using an analogous approach, but this time with the symmetry parameters were keptfixed and a higher refinement diameter of 290 Å was used for visualization of the less orderedfilament exterior. Selected 8412 segments corresponding to 50,472 asymmetric units after symmetrization resulted in a map of the whole BLC10-MALT1 assembly with an overall resolution of 5.9 Å.
Both 4.9 Å and 5.9 Å resolution raw half maps were symmetrized and used to estimate the local resolution (Supplementary Fig. 8b) and the B-factor using relion_postprocess. Additionally, in order to assess the resolution of each region of the maps (Bcl10, MALT1 DD, MALT1 Ig1-Ig2-paracaspase domains) FSC curves were calculated between half maps within smooth cylinder masks of various diameters of 0–83 Å, 83–140 Å, and 140–260 Å (Supplementary Fig. 8a). The final higher resolution map offilament core (Fig.1) used for model building was post-processed using 3Dinspect module in Spring with a b-factor of−200 Å−2and a resolution cutoff of 4.9 Å, whereas the lower resolution map of the entire assembly was post-processed with various resolution cut-off and sharpening, as indicated in Fig.4.
Model building and refinement. The BCL10 CARD domains and MALT1 DD were built using Coot53. To this end, BCL10 was generated byflexible fitting of a homology model created by the program Phyre2 54and under consideration of the BCL10 CARD domain NMR structure (pdb ID: 2MB9). The MALT1 DD was built in the EM density using the related crystal structure (pdb ID: 2G7R) as well as a homology model based on the APAF CARD domain (pdb ID: 2YGS) structure prepared with Modeller55. Thefinal model was refined with PHENIX real-space refinement56. The similarity of the refined model of BCL10 CARD with the unsharpened, unfiltered map of the filament core was assessed by FSC, after helical symmetrization of the model and calculation of a density map with a voxel size of 1.002 Å using Chimera. Similarly, the refined model and the previously deposited model PDB: 6BZE, were compared to the EMDB entry EMD-7314. Finalfigures were generated with UCSF Chimera and PyMol57,58.
Antibodies and DNA constructs. The following antibodies were used for immunoprecipitation (IP), Western Blot (WB), andfluorescence activate cell sorting (FACS). WB was done at a dilution of 1:1000 except when otherwise stated. Anti-HA (3F1 (WB), obtained from E. Kremmer); anti-CARD11 (1D12), anti-IκBα (L35A5, FACS 1:50), p-IκBα (5A5) (all Cell Signaling Technology); anti-FLAG-M2 (F3165, Sigma-Aldrich, WB 1:10000, IP 1 µl); anti-hCD2-APC (RPA-2.10, eBioscience, FACS 1:200); anti-BCL10 (EP606Y, Abcam, for endogenous BCL10); anti-BCL10 (C-17, IP 2.5 µl) and H-197 (WB for strep-tagged BCL10); anti-MALT1 (B12), anti-β-Actin (C4; WB 1:10000), anti-CYLD (E10) (all Santa Cruz Biotechnology); anti-HOIL-1 (S150D, MRC PPU Reagents); Regnase-1 (604421, R&D; WB 1:500); horseradish peroxidase (HRP)-conjugated secondary antibodies (Jackson ImmunoResearch); anti-mouse IgG1-FITC (A85-1, BD, FACS 1:100), anti-IL-2-APC (JES6-5H4, eBioscience; FACS 1:100) and anti-Thy1.1-APC-Cy7 (HIS51, eBioscience; FACS 1:200) were used. For Jurkat T-cell stimulation anti-human CD3 and CD28 from mouse were used in the presence of anti-murine IgG1 and IgG2a (all BD Pharmingen). For CD4 T-cell stimulation anti-murine CD3 and CD28 (BD Pharmingen) from hamster were used in the presence of plate-bound rabbit anti-hamster (Jackson ImmunoResearch). Oligonucleotides for EMSAs were: H2K (fw: 5 ′-GATCCAGGGCTGGGGATTCCCCATCTCCACAGG-3′, rev: 5′-GATCCCTGTGGAGATGGGGAATCCCCAGCCCTG-3′), OCT1 (fw: 5′-GATCTGTCGAATGCAAATCACTAGAA-3′, rev: 5′-GATCTTCTAGT-GATTTGCATTCGACA-3′).The following DNA constructs were used: 3xFlag and HA tagged MALT1B and BCL10 cDNAs were cloned in the pEF backbone vector (Invitrogen) or pHAGE-ΔCD2-T2A (lentiviral transduction)59or pMSCV-IRES-Thy1.1 (retroviral transduction)4.
Cell culture and stimulation. Cells were grown in DMEM (HEK293, HEK293T (both DSMZ), Phoenix-ECO (ATCC) or RPMI 1640 (Jurkat T-cells; verified by DSMZ) medium supplemented with 10% fetal calf serum and 100 U/ml penicillin/ streptomycin (P/S) (all Life Technologies). HEK293 cells were transfected using standard calcium phosphate precipitation protocols. For P/I stimulation of Jurkat T-cells, 200 ng/ml PMA and 300 ng/ml Ionomycin were applied. For CD3/CD28 co-ligation, 0.3 µg anti-CD3 and 1 µg anti-CD28 antibody was used in the presence of 0.5 µg rat anti-mouse IgG1 and IgG2a.
Generation and reconstitution of KO Jurkat T-cells. Bicistronic expression vector px458 expressing Cas9 and sgRNA60,61was digested with BbsI and the linearized vector was gel purified. Targeting oligonucleotides and generation of MALT1-deficient Jurkat T-cells has been described38. For BCL10 two oligonu-cleotides targeting sites andflanking exon1 (5′AGTGAGGTCCTCCTCGGTGA 3′/ 5′TTCCGCTTTCGTCTCCCGCT 3′ (Supplementary Fig. 4a) were cloned. Jurkat T-cells (4 × 10⁶) were electroporated (220 V and 1000 µF) using a Gene pulser X (Biorad) with px458 plasmids (Addgene #48138; gift F. Zhang) containing sgRNA targeting BCL10 and EGFP expression cassette. Twenty-four hours after electro-poration, EGFP-positive cells were sorted using a MoFlo sorting system (Beckman
Coulter). Isolation of clonal cell lines was achieved by serial dilutions and was followed by an appropriate expansion period. KO cell clones were initially iden-tified by anti-BCL10 staining by Western Blot. Clones lacking protein expression were genotyped by genomic PCR using intronic primersflanking targeting sides. For reconstitution, MALT1 isoform B and BCL10 cDNAs were linked to a C-terminal Flag-Strep-Strep tag and hΔCD2 by a co-translational processing site T2A59and introduced into pHAGE lentiviral expression plasmids. Lentivirus was produced by transfecting HEK293T cells with 1.5μg psPAX2 (Addgene #12260; gift D. Trono), 1μg pMD2.G (Addgene #12259; gift D. Trono) and 2 μg transfer vector. Seventy-two hours after transfection, lentivirus encoding MALT1 and BCL10 were collected,filtrated and in the presence of 8 μg/ml polybrene added to MALT1 and BCL10 KO Jurkat T-cells (5 × 10⁵cells), respectively. After 24 h, virus was replaced by RPMI medium. FACS analysis using an Attune Flow Cytometer (Applied Biosystems) revealed >95%ΔCD2-positive cells after one week in culture. Purification and analysis of murine MALT1−/−CD4+T-cells. CD4+T-cells were MACS-purified from spleen and lymph nodes of MALT1−/−mice (MAL-T1tm1a(EUCOMM)Hmgu; ES cell clone HEPD0671_C08) and stimulated with plate-bound anti-CD3/CD28 antibodies for 48 h. Retroviruses were produced in Phoenix cells transfected with pMSCV retroviral transfer vectors carrying human MALT1-FlagStrepII constructs and Thy1.1 (separated by internal ribosome entry site (IRES) sequence) and viruses were collected after 48 and 72 h. CD4+ T-cells were incu-bated for 6 h with retroviral supernatant supplemented with Polybrene (8 µg/ml) and then washed and cultured in RPMI medium supplemented with IL-2 (20 U/ ml),10% heat-inactivated FCS, 1% P/S, 1% NEAA (Life Technologies), 1% HEPES, 1% L-glutamine, 1% sodium pyruvate (Life Technologies) and 0.1% b-mercaptoethanol for 3 days before analysis. Infection efficiencies between 25 and 50% were achieved.
For IκBα degradation, cells were stimulated for 30 min with PMA (200 nM) and Ionomycin (300 nM),fixed with 2% paraformaldehyde and stained for Thy1.1. After permeabilization (0.1% saponine), cells were stained using mouse anti-IκBα antibody (L35A5, CST) and anti-mouse IgG1 FITC (BD). For determination of intracellular IL-2, cells were rested for 12 h and then stimulated with P/I or plate-bound anti-CD3/CD28 (0.5 µg/ml CD3 and 1 µg/ml CD28) antibodies for 5 h in the presence of Brefeldin A. Afterfixation and permeabilization, cells were stained with anti-IL-2 APC antibody (JES6-5H4, eBioscience). FACS analyses were performed using an Attune Flow Cytometer (Applied Biosystems) and analyzed with FlowJo Software (Treestar).
Cell lysis and cellular binding studies. For cellular analyses Jurkat T-cells (2–3 × 10⁶) were lysed in co-immunoprecipitations (co-IP) buffer (25 mM HEPES (pH 7.5), 150 mM NaCl, 0.2% NP-40, 10% glycerol, 1 mM DTT, 10 mM sodium fluoride, 8 mM β-glycerophosphate, 300 μM sodium vanadate and protease inhi-bitor cocktail). For monitoring CBM complex formation after IP or StrepTactin pulldown (ST-PD), Jurkat T-cells (1–3 × 10⁷) were lysed in co-IP buffer. Lysate controls were taken up in 4xSDS-loading buffer and boiled for 5 min at 95 °C. IP was carried out using anti-BCL10 C-17 (2.5 µl) or anti-Flag-M2 (1 µl) antibodies overnight at 4 °C. Afterwards Protein G Sepharose (15 µl 1:1 suspension) was administered for 1–2 h at 4 °C to bind antibodies. StrepII-tagged were pulled down (ST-PD) with Strep-Tactin Sepharose (15 µl 1:1 suspension) at 4 °C overnight. For co-IP and ST-PD beads were washed with co-IP buffer and boiled after adding of 22 µl 2x SDS loading buffer. Lysates and precipitated proteins were separated by SDS-PAGE and analyzed by Western blot.
Western blotting. Transfer onto PVDF-membranes was performed using elec-trophoretic semi-dry blotting system. PVDF-membranes were blocked with 5% BSA for 1 h at RT and before primary antibody (indicated above, dilution 1:1000 in 2.5% BSA/PBS-T) were incubated overnight at 4 °C. Membranes were washed in PBS-T and HRP (horse radish peroxidase)-coupled secondary antibodies (indicated above, 1:7000 in 1.25% BSA in PBS-T; 1 h, RT) were used for detection. HRP was visualized by enhanced chemiluminescence (ECL) with LumiGlo reagent (Cell Signaling Technologies) according to the protocol of the manufacturer. Images were cropped for presentation and full size images are presented in Supplementary Fig. 9.
Electrophoretic mobility shift assay. Electrophoretic mobility shift assays (EMSAs) were carried out using double-stranded NF-κB or OCT1 binding sequences (H2K or OCT1 oligonucleotides; see reagents) which were radioactively labeled using [α-32P] dATP in a Klenow Fragment (NEB) reaction. Whole cell lysates (3–6 µg) were incubated for 30 min at RT with shift-buffer (HEPES pH 7.9 (20 mM), KCl (120 mM), Ficoll (4%)), DTT (5 mM), BSA (10 µg) and poly-dI-dC (2 µg, Roche) and radioactive probe (10,000–20,000 cpm) to detect DNA binding of transcription factors. Samples were run on a 5% polyacrylamide gel in TBE buffer and exposed to autoradiography after vacuum-drying. Images were cropped for presentation and full size images are presented in Supplementary Fig. 9. Data availability. The electron density reconstruction andfinal model were deposited with the EM Data Base (accession codes EMD-0013, PDB ID 6GK2). Other data are available from the corresponding authors upon reasonable request.
Received: 3 May 2018 Accepted: 10 September 2018
References
1. Gehring, T., Seeholzer, T. & Krappmann, D. BCL10 - Bridging CARDs to immune activation. Front. Immunol. 9, 1539 (2018).
2. Jiang, C. & Lin, X. Regulation of NF-kappaB by the CARD proteins. Immunol. Rev. 246, 141–153 (2012).
3. Meininger, I. & Krappmann, D. Lymphocyte signaling and activation by the CARMA1-BCL10-MALT1 signalosome. Biol. Chem. 397, 1315–1333 (2016). 4. Oeckinghaus, A. et al. Malt1 ubiquitination triggers NF‐κB signaling upon T‐
cell activation. EMBO J. 26, 4634–4645 (2007).
5. Sun, L., Deng, L., Ea, C.-K., Xia, Z.-P. & Chen, Z. J. The TRAF6 ubiquitin ligase and TAK1 kinase mediate IKK activation by BCL10 and MALT1 in T lymphocytes. Mol. Cell 14, 289–301 (2004).
6. Wu, C.-J. & Ashwell, J. D. NEMO recognition of ubiquitinated Bcl10 is required for T cell receptor-mediated NF-κB activation. Proc. Natl Acad. Sci. 105, 3023–3028 (2008).
7. Oeckinghaus, A. & Ghosh, S. The NF-kappaB family of transcription factors and its regulation. Cold Spring Harb. Perspect. Biol. 1, a000034 (2009).
8. Coornaert, B. et al. T cell antigen receptor stimulation induces MALT1 paracaspase-mediated cleavage of the NF-kappaB inhibitor A20. Nat. Immunol. 9, 263–271 (2008).
9. Rebeaud, F. et al. The proteolytic activity of the paracaspase MALT1 is key in T cell activation. Nat. Immunol. 9, 272–281 (2008).
10. Jaworski, M. & Thome, M. The paracaspase MALT1: biological function and potential for therapeutic inhibition. Cell. Mol. Life Sci. 73, 459–473 (2016). 11. Thome, M., Charton, J. E., Pelzer, C. & Hailfinger, S. Antigen receptor
signaling to NF-kappaB via CARMA1, BCL10, and MALT1. Cold Spring Harb. Perspect. Biol. 2, a003004 (2010).
12. Greil, J. et al. Whole-exome sequencing links caspase recruitment domain 11 (CARD11) inactivation to severe combined immunodeficiency. J. Allergy Clin. Immunol. 131, 1376–1383.e1373 (2013).
13. Jabara, H. H. et al. A homozygous mucosa-associated lymphoid tissue 1 (MALT1) mutation in a family with combined immunodeficiency. J. Allergy Clin. Immunol. 132, 151–158 (2013).
14. McKinnon, M. L. et al. Combined immunodeficiency associated with homozygous MALT1 mutations. J. Allergy Clin. Immunol. 133, 1458–1462 (2014). 1462 e1451-1457.
15. Stepensky, P. et al. Deficiency of caspase recruitment domain family, member 11 (CARD11), causes profound combined immunodeficiency in human subjects. J. Allergy Clin. Immunol. 131, 477–485 e471 (2013).
16. Torres, J. M. et al. Inherited BCL10 deficiency impairs hematopoietic and nonhematopoietic immunity. J. Clin. Invest. 124, 5239–5248 (2014). 17. Ma, C. A. et al. Germline hypomorphic CARD11 mutations in severe atopic
disease. Nat. Genet. 49, 1192–1201 (2017).
18. Knies, N. et al. Lymphomagenic CARD11/BCL10/MALT1 signaling drives malignant B-cell proliferation via cooperative NF-kappaB and JNK activation. Proc. Natl Acad. Sci. USA 112, E7230–E7238 (2015).
19. Lenz, G. et al. Oncogenic CARD11 mutations in human diffuse large B cell lymphoma. Science 319, 1676–1679 (2008).
20. Snow, A. L. et al. Congenital B cell lymphocytosis explained by novel germline CARD11 mutations. J. Exp. Med. 209, 2247–2261 (2012).
21. Zhang, Q. et al. Inactivating mutations and overexpression of BCL10, a caspase recruitment domain-containing gene, in MALT lymphoma with t (1;14)(p22;q32). Nat. Genet. 22, 63–68 (1999).
22. Dierlamm, J. et al. The apoptosis inhibitor gene API2 and a novel 18q gene, MLT, are recurrently rearranged in the t(11;18)(q21;q21) associated with mucosa-associated lymphoid tissue lymphomas. Blood 93, 3601–3609 (1999).
23. Sanchez-Izquierdo, D. et al. MALT1 is deregulated by both chromosomal translocation and amplification in B-cell non-Hodgkin lymphoma. Blood 101, 4539–4546 (2003).
24. Bardet, M. et al. The T-cellfingerprint of MALT1 paracaspase revealed by selective inhibition. Immunol. Cell Biol. 96, 81–99 (2018).
25. Fontan, L. et al. MALT1 small molecule inhibitors specifically suppress ABC-DLBCL in vitro and in vivo. Cancer Cell 22, 812–824 (2012).
26. Nagel, D. et al. Pharmacologic inhibition of MALT1 protease by
phenothiazines as a therapeutic approach for the treatment of aggressive ABC-DLBCL. Cancer Cell 22, 825–837 (2012).
27. Matsumoto, R. et al. Phosphorylation of CARMA1 plays a critical role in T Cell receptor-mediated NF-kappaB activation. Immunity 23, 575–585 (2005). 28. Sommer, K. et al. Phosphorylation of the CARMA1 linker controls
29. Jang, T. H., Park, J. H. & Park, H. H. Novel disulfide bond-mediated dimerization of the CARD domain was revealed by the crystal structure of CARMA1 CARD. PLoS ONE 8, e79778 (2013).
30. Li, S., Yang, X., Shao, J. & Shen, Y. Structural insights into the assembly of CARMA1 and BCL10. PLoS ONE 7, e42775 (2012).
31. David, L. et al. Assembly mechanism of the CARMA1-BCL10-MALT1-TRAF6 signalosome. Proc. Natl Acad. Sci. USA 115, 1499–1504 (2018). 32. Qiao, Q. et al. Structural architecture of the CARMA1/Bcl10/
MALT1 signalosome: nucleation-inducedfilamentous assembly. Mol. Cell 51, 766–779 (2013).
33. Langel, F. D. et al. Multiple protein domains mediate interaction between Bcl10 and MALT1. J. Biol. Chem. 283, 32419–32431 (2008).
34. Lucas, P. C. et al. Bcl10 and MALT1, independent targets of chromosomal translocation in malt lymphoma, cooperate in a novel NF-kappa B signaling pathway. J. Biol. Chem. 276, 19012–19019 (2001).
35. Uren, A. G. et al. Identification of paracaspases and metacaspases: two ancient families of caspase-like proteins, one of which plays a key role in MALT lymphoma. Mol. Cell 6, 961–967 (2000).
36. Wegener, E. et al. Essential role for IkappaB kinase beta in remodeling Carma1-Bcl10-Malt1 complexes upon T cell activation. Mol. Cell 23, 13–23 (2006).
37. Qiu, L. & Dhe-Paganon, S. Oligomeric structure of the MALT1 tandem Ig-like domains. PLoS ONE 6, e23220 (2011).
38. Meininger, I. et al. Alternative splicing of MALT1 controls signalling and activation of CD4(+) T cells. Nat. Commun. 7, 11292 (2016).
39. Schlauderer, F. et al. Structural analysis of phenothiazine derivatives as allosteric inhibitors of the MALT1 paracaspase. Angew. Chem. Int. Ed. Engl. 52, 10384–10387 (2013).
40. Yang, Y. K. et al. Molecular determinants of scaffold-induced linear ubiquitinylation of B cell lymphoma/leukemia 10 (Bcl10) during T cell receptor and oncogenic caspase recruitment domain-containing protein 11 (CARD11) signaling. J. Biol. Chem. 291, 25921–25936 (2016).
41. Scharschmidt, E., Wegener, E., Heissmeyer, V., Rao, A. & Krappmann, D. Degradation of Bcl10 induced by T-cell activation negatively regulates NF-kappa B signaling. Mol. Cell. Biol. 24, 3860–3873 (2004).
42. Hu, S. et al. cIAP2 is a ubiquitin protein ligase for BCL10 and is dysregulated in mucosa-associated lymphoid tissue lymphomas. J. Clin. Invest. 116, 174–181 (2006).
43. Paul, S., Kashyap, A. K., Jia, W., He, Y. W. & Schaefer, B. C. Selective autophagy of the adaptor protein Bcl10 modulates T cell receptor activation of NF-kappaB. Immunity 36, 947–958 (2012).
44. Baens, M. et al. MALT1 auto-proteolysis is essential for NF-kappaB-dependent gene transcription in activated lymphocytes. PLoS ONE 9, e103774 (2014).
45. Pelzer, C. et al. The protease activity of the paracaspase MALT1 is controlled by monoubiquitination. Nat. Immunol. 14, 337–345 (2013).
46. Zheng, S. Q. et al. MotionCor2: anisotropic correction of beam-induced motion for improved cryo-electron microscopy. Nat. Methods 14, 331–332 (2017).
47. Mindell, J. A. & Grigorieff, N. Accurate determination of local defocus and specimen tilt in electron microscopy. J. Struct. Biol. 142, 334–347 (2003). 48. Ludtke, S. J., Baldwin, P. R. & Chiu, W. EMAN: semiautomated software for
high-resolution single-particle reconstructions. J. Struct. Biol. 128, 82–97 (1999).
49. Desfosses, A., Ciuffa, R., Gutsche, I. & Sachse, C. SPRING - an image processing package for single-particle based helical reconstruction from electron cryomicrographs. J. Struct. Biol. 185, 15–26 (2014).
50. Hohn, M. et al. SPARX, a new environment for Cryo-EM image processing. J. Struct. Biol. 157, 47–55 (2007).
51. Xu, H. et al. Structural basis for the prion-like MAVSfilaments in antiviral innate immunity. eLife 3, e01489 (2014).
52. Sachse, C. et al. High-resolution electron microscopy of helical specimens: a fresh look at tobacco mosaic virus. J. Mol. Biol. 371, 812–835 (2007). 53. Emsley, P. & Cowtan, K. Coot: model-building tools for molecular graphics.
Acta Crystallogr. D. Biol. Crystallogr. 60, 2126–2132 (2004).
54. Kelley, L. A., Mezulis, S., Yates, C. M., Wass, M. N. & Sternberg, M. J. The Phyre2 web portal for protein modeling, prediction and analysis. Nat. Protoc. 10, 845–858 (2015).
55. Webb, B. & Sali, A. Protein structure modeling with MODELLER. Methods Mol. Biol. 1137, 1–15 (2014).
56. Adams, P. D. et al. PHENIX: a comprehensive Python-based system for macromolecular structure solution. Acta Crystallogr. D Biol. Crystallogr. 66, (213–221 (2010).
57. Pettersen, E. F. et al. UCSF Chimera--a visualization system for exploratory research and analysis. J. Comput. Chem. 25, 1605–1612 (2004).
58. DeLano, W. L. The PyMol Molecular Graphics System. (Delano Scientific, Palo Alto, CA, 2002).
59. Hadian, K. et al. NF-kappaB essential modulator (NEMO) interaction with linear and lys-63 ubiquitin chains contributes to NF-kappaB activation. J. Biol. Chem. 286, 26107–26117 (2011).
60. Cong, L. et al. Multiplex genome engineering using CRISPR/Cas systems. Science 339, 819–823 (2013).
61. Ran, F. A. et al. Genome engineering using the CRISPR-Cas9 system. Nat. Protoc. 8, 2281–2308 (2013).
Acknowledgements
We thank the MPI of Biochemistry cryo-EM and biophysics core facilities for generous access and support. We are grateful to the IT teams from IBS and EMBL Grenoble, and specifically Aymeric Peuch for help with the usage of the joint IBS/EMBL EM computing cluster which was used as a part of the platforms of the Grenoble Instruct-ERIC Center (ISBG: UMS 3518 CNRS-CEA-UGA-EMBL) with support from FRISBI (ANR-10-INSB-05-02) and GRAL (ANR-10-LABX-49-01) within the Grenoble Partnership for Structural Biology (PSB). We thank Simon Widmann for help with the cell-based assays. K.L. and D.K. are supported by the CRC1054 project B02 and A04, respectively. A.D. is supported by the FRM ARF20160936266 grant. K.-P.H is supported by the Deutsche For-schungsgemeinschaft (CRC1064, GRK1721), the European Research Council (ERC Advanced Grant ATMMACHINE), the Gottfried-Wilhelm-Leibniz Prize and the Center for Integrated Protein Sciences Munich (CIPSM).
Author contributions
K.L. and F.S. prepared the cryo-EM samples and collected the data. T.S. performed all cellular experiments. A.D. performed helical reconstruction and helped with structure determination. I.G. helped with EM data analysis. K.L. built atomic models. F.S. prepared the protein complex, the biochemical analysis and participated in structure determina-tion. T.G. established the Jurkat KO T-cells and performed reconstitution of murine MALT1−/−CD4 T-cells. M.S. operates the MPI Biochemistry cryo-EM facility, helped with EM data collection and provided general EM advice. K.L., D.K., and K.-P.H. designed the overall study, analyzed the results and wrote the paper with input of A.D. and I.G. and contributions from all other authors.
Additional information
Supplementary Informationaccompanies this paper at https://doi.org/10.1038/s41467-018-06573-8.
Competing interests:The authors declare no competing interests.
Reprints and permissioninformation is available online athttp://npg.nature.com/ reprintsandpermissions/
Publisher's note:Springer Nature remains neutral with regard to jurisdictional claims in published maps and institutional affiliations.
Open Access This article is licensed under a Creative Commons Attribution 4.0 International License, which permits use, sharing, adaptation, distribution and reproduction in any medium or format, as long as you give appropriate credit to the original author(s) and the source, provide a link to the Creative Commons license, and indicate if changes were made. The images or other third party material in this article are included in the article’s Creative Commons license, unless indicated otherwise in a credit line to the material. If material is not included in the article’s Creative Commons license and your intended use is not permitted by statutory regulation or exceeds the permitted use, you will need to obtain permission directly from the copyright holder. To view a copy of this license, visithttp://creativecommons.org/ licenses/by/4.0/.