HAL Id: hal-02588926
https://hal.inrae.fr/hal-02588926
Submitted on 15 May 2020
HAL is a multi-disciplinary open access
archive for the deposit and dissemination of
sci-entific research documents, whether they are
pub-lished or not. The documents may come from
teaching and research institutions in France or
abroad, or from public or private research centers.
L’archive ouverte pluridisciplinaire HAL, est
destinée au dépôt et à la diffusion de documents
scientifiques de niveau recherche, publiés ou non,
émanant des établissements d’enseignement et de
recherche français ou étrangers, des laboratoires
publics ou privés.
report
M. Manez, S. Schmidt, B. Blümling, I. van Wyngaert, D. Inman, E. Moors, C.
Sullivan, K. Tarnacki, M. Bauer, S. Loubier
To cite this version:
M. Manez, S. Schmidt, B. Blümling, I. van Wyngaert, D. Inman, et al.. Common framework for the
characterisation of water stress. AquaStress Integrated Project. D2.1.1. Final report. irstea. 2005,
pp.32. �hal-02588926�
A
QUA
S
TRESS
M
i
t
iga
t
ion
o
f
Wa
ter
S
tress
through
new
Approaches
to
In
tegra
t
ing
Managemen
t
,
Techn
ica
l
,
Econom
ic
and
Ins
t
i
tu
t
iona
l
Ins
trumen
ts
In
tegra
ted
Pro
jec
t
D
2
.1-1
C
OMMON
F
RAMEWORK
FOR
THE
C
HARACTERISATION
OF
W
ATER
S
TRESS
-D
ELIVERABLE
C
OVER
P
AGE
-Due
da
te
:
31-07-05
(M6)
Ac
tua
l
subm
iss
ion
da
te
:
30-08-05
S
tar
t
da
te
of
pro
jec
t
:
1-02-05
Dura
t
ion
:
48
mon
ths
De
l
iverab
le
Lead
con
trac
tor
:
(Organ
isa
t
ion
name)
USF
WP
Par
t
ic
ipan
t(s)
(Par
tner
shor
t
names)
ALTERRA
, CEMAGREF
, CNR
. IRSA
, CRANFIELD
,
NERC-CEH
,
RTWH
,
UHANN
,
UoR
,
USF
,
Au
thor(s)
:
Manez
, Schm
id
t
, B
lüm
l
ing
, Van Wyngaer
t
, Inman
,
Moors
,
Su
l
l
ivan
,
Tarnack
i
,
Bauer
,Loub
ier
.
Con
tac
t
for
quer
ies
:
mmanez@us
f
.uos
.de
Dr
USF-Barbaras
.
Mar
ia
Manez
trasse
12-G66
49076
Osnabrück
(Germany)
te
l
.
+49-541-9692424
D
issem
ina
t
ion
Leve
l
(1)PU
De
l
iverab
le
S
ta
tus
:
F
ina
l
Repor
t
(1) (PU=PUblic, PP=Restricted to other Programmes Participants, RE=REstricted to a group specified by the consortium, CO=COnfidential onlyfor members ofthe consortium)
Doc Name: Deliverable ID: WP2.1-D2.1-1 doc Date: 30/7/2005
Final Report Public
Ce m OA : a rc hi ve o uv ert e d'I rs te a / C e ma gr ef
Contents
1.
Introduction...3
Ob
ject
ive.
.
.
.
.
.
.
.
.
.
.
.
.
.
.
.
.
.
.
.
.
.
.
.
.
.
.
.
.
.
.
.
.
.
.
.
.
.
.
.
.
.
.
.
.
.
.
.
.
.
.
.
.
.
.
.
.
.
.
.
.
.
.
.
.
.
.
.
.
.
.
.
.
.
.
.
.
.
.
.
.
.
.
.
.
.
.
.
.
.
.
.
.
.
.
.
.
.
.
.
.
.
.
.
.
.
.
.
.
.
.
.
.
.
.
.
.
.
.
.
.
.
.
.
.
.
.
.
. 3
2.
Steps
into
an
adequate
“Water
Stress”
definition...4
2a
.
State
o
f
the
art.
.
.
.
.
.
.
.
.
.
.
.
.
.
.
.
.
.
.
.
.
.
.
.
.
.
.
.
.
.
.
.
.
.
.
.
.
.
.
.
.
.
.
.
.
.
.
.
.
.
.
.
.
.
.
.
.
.
.
.
.
.
.
.
.
.
.
.
.
.
.
.
.
.
.
.
.
.
.
.
.
.
.
.
.
.
.
.
.
.
.
.
.
.
.
.
.
.
.
.
.
.
.
.
.
.
.
.
.
.
.
.
.
.
.
.
.
.
.
.
.4
2b
.
Choos
ing
a
de
f
in
it
ion
for
WS.
.
.
.
.
.
.
.
.
.
.
.
.
.
.
.
.
.
.
.
.
.
.
.
.
.
.
.
.
.
.
.
.
.
.
.
.
.
.
.
.
.
.
.
.
.
.
.
.
.
.
.
.
.
.
.
.
.
.
.
.
.
.
.
.
.
.
.
.
.
.
.
.
.
.
.
.
.
.
.
.
.
.
.
.
.
.
.
.
.
.
.
.
.
.
.
.6
3.
Methods
to
measure
WS...
7
3a
.
DPSIR.
.
.
.
.
.
.
.
.
.
.
.
.
.
.
.
.
.
.
.
.
.
.
.
.
.
.
.
.
.
.
.
.
.
.
.
.
.
.
.
.
.
.
.
.
.
.
.
.
.
.
.
.
.
.
.
.
.
.
.
.
.
.
.
.
.
.
.
.
.
.
.
.
.
.
.
.
.
.
.
.
.
.
.
.
.
.
.
.
.
.
.
.
.
.
.
.
.
.
.
.
.
.
.
.
.
.
.
.
.
.
.
.
.
.
.
.
.
.
.
.
.
.
.
.
.
.
.
.
.
.
.
.
.7
3b
.
Ind
icators
descr
ipt
ion.
.
.
.
.
.
.
.
.
.
.
.
.
.
.
.
.
.
.
.
.
.
.
.
.
.
.
.
.
.
.
.
.
.
.
.
.
.
.
.
.
.
.
.
.
.
.
.
.
.
.
.
.
.
.
.
.
.
.
.
.
.
.
.
.
.
.
.
.
.
.
.
.
.
.
.
.
.
.
.
.
.
.
.
.
.
.
.
.
.
.
.
.
.
.
.
.
.
.
.
.
.
.
.
.
.
. 8
3c
.
Ca
lcu
lat
ing
a
Water
Vu
lnerab
i
l
ity
Index
(WVI)
as
a
contr
ibut
ion
to
the
Aquastress
pro
ject
..
.
.
.
.
.
.
.
.
.
.
.
.
.
.
.
.
.
.
.
.
.
.
.
.
.
.
.
.
.
.
.
.
.
.
.
.
.
.
.
.
.
.
.
.
.
.
.
.
.
.
.
.
.
.
.
.
.
.
.
.
.
.
.
.
.
.
.
.
.
.
.
.
.
.
.
.
.
.
.
.
.
.
.
.
.
.
.
.
.
.
.
.
.
.
.
.
.
.
.
.
.
.
.
.
.
.
.
.
.
.
.
.
.
.
.
.
.
.
.
.
.
.
.
.
.
.
.
.
.
.
.
.
.
.
.
19
4.
Policy
relevance
-
Major
gaps
–
Uncertainty
–
Sensitivity
to
change...20
4a
.
Ma
jor
Gaps:.
.
.
.
.
.
.
.
.
.
.
.
.
.
.
.
.
.
.
.
.
.
.
.
.
.
.
.
.
.
.
.
.
.
.
.
.
.
.
.
.
.
.
.
.
.
.
.
.
.
.
.
.
.
.
.
.
.
.
.
.
.
.
.
.
.
.
.
.
.
.
.
.
.
.
.
.
.
.
.
.
.
.
.
.
.
.
.
.
.
.
.
.
.
.
.
.
.
.
.
.
.
.
.
.
.
.
.
.
.
.
.
.
.
. 22
4b
.
Uncerta
int
ies:.
.
.
.
.
.
.
.
.
.
.
.
.
.
.
.
.
.
.
.
.
.
.
.
.
.
.
.
.
.
.
.
.
.
.
.
.
.
.
.
.
.
.
.
.
.
.
.
.
.
.
.
.
.
.
.
.
.
.
.
.
.
.
.
.
.
.
.
.
.
.
.
.
.
.
.
.
.
.
.
.
.
.
.
.
.
.
.
.
.
.
.
.
.
.
.
.
.
.
.
.
.
.
.
.
.
.
.
.
.
.
. 22
4c
.
Sens
it
iv
ity
to
change:.
.
.
.
.
.
.
.
.
.
.
.
.
.
.
.
.
.
.
.
.
.
.
.
.
.
.
.
.
.
.
.
.
.
.
.
.
.
.
.
.
.
.
.
.
.
.
.
.
.
.
.
.
.
.
.
.
.
.
.
.
.
.
.
.
.
.
.
.
.
.
.
.
.
.
.
.
.
.
.
.
.
.
.
.
.
.
.
.
.
.
.
.
.
.
.
.
.
.
. 23
4d
.
These
cons
iderat
ion
lead
to
cr
iter
ia
for
the
cho
ice
of
ind
icator:.
.
.
.
.
.
.
.
.
.
.
.
.
.
.
.
.
.
.
.
.
.
.
.
.
.
.
.
.
.
.
. 23
Annex:
Results
on
the
definition
of
water
stress...25
Doc Name: Deliverable ID: WP2.1-D2.1-1 doc Date: 30/7/2005
Final Report Public
Ce m OA : a rc hi ve o uv ert e d'I rs te a / C e ma gr ef
1
.
Introduct
ion
Water scarcity is a globally significant and accelerating condition for roughly 1–2 billion people worldwide, leading to problems with food production, human health, and economic development. Rates of increase in a key water scarcity measure (water use relativeto accessible supply)from 1960tothe present averaged nearly 20% per decade globally, with values of 15%to morethan 30% per decadeforindividual continents.
Although one maythink that this problem is limited to (semi-) arid regions, it may occur in more moderate and continental climates not affected bylimited rainfall.
In a general way, water stress is the symptomatic consequence of water shortage (Abrams, 2000), endangering citizens’ health, economic development and (last but not least) natural ecosystems, thus producing conflicts between different sectoral usages, a decline in the level of services, and social insecurity. That these conflicts between sectors will increase over the coming years may be clear from for example the 17% increase of agricultural water use needed to meet the food requirements in the business as usual scenario (Rijsberman and Molden, 2001) and the 8% decrease in water allocation to irrigated agriculture advocated by the environmental sustainability lobby (e.g. see Alcamo et al. 2000). Smakthin et al. (2004) showed in a first order attempt that the present human water use alreadyimpactedthe health of ecosystems significantly.
The major advantages that make simple indicators such as the “water stress index” by Falkenmark et al. (1989) almost unbeatable are those: the data are readily available; and its meaning is intuitive and easy to understand. As a result this indicator dominates the popular discussion of water scarcity, even though its disadvantages are clear as well. Usuallythese relatively simpleindicators are well suitedto servefor among others political awareness rising at the national level. However, the national analysis of water stress is of verylimited use in assessing whetherindividuals or communities are water secure. To assurethat measuresto mitigate or adaptto water stress are sustainable,itisimportantto assessthe effect ofthese measures at a scale suitableto encompass possible feedbacks, both in time and space. Because of the wide array of interrelationships with the hydrologic cycle, addressing water stress goes beyond water quality and quantity issues. Social issues including equity, benefits from water use, sustainability, economic resources, and the ability of a country or regions institutions to adapt, all determine whether a region is at risk of facing water stress. With the knowledge that is now available regarding increasing climate change, it is necessary to incorporate climate change forecasts when forecasting future water stress conditions.
In the indicator based assessment of EEA of Europe’s water (Nixon et al., 2003) agriculture, industry and waste water treatment plants were identified as the sectors with the major influence on water quantity and quality. For industry and waste water treatment plants it is primarily the pollution by oxygen-consuming substances, phosphorus and heavy metals that are a major causes for the decreased water quality, although there has been a major improvement over the last couple of years. Agriculture causes decreased water quality due to nitrate and pesticideleaching, as well asincreased water consumption. As a possiblefuture sourcethat can potentially pollute both surface and groundwaterthelarge nitrogen surplusinthe agricultural soils wereindicated.In addition, coastal habitats are under intense pressure from high population densities, tourism and agriculture in coastal zones. Traditionally, water-relatedlegislation has largelyfocused on controlling emissionsfrom point sources. However,to reach good ecological status of surface waters, this focus will need to be broadened to ensure that all human-related pressures are controlled, including those from diffuse sources, such as agricultural use of fertilisers and pesticides. Changes to the structures of water bodies as well as water abstractions and other physical changes such as damming and channelisation are also possible causes of water stress and should be addressed. Over-abstraction of water is a major cause of water stress in parts of Europe, such as the coast and islands of the Mediterranean. In the case of groundwater, over-abstraction can lead to the intrusion of saltwater into aquifers, makingthe water unsuitable for most purposes. Measures to control demand for water, such as water pricing, and technologies that improve water use efficiency are contributing to reductions in water demand. However, in some countries losses of water by leakage from water distribution systems can still be significant. The accession of countries to the EU with a relatively extensive farming system may lead to more intensive systems as their economies areintegratedintothe EU, andthus increased pressures ontheir water resources.
Objective
The objective of this paper is to describe water stress indicators that enable the characterization of the severity of water stress in different sectors at the regional levels. These indicators will become the basis for ajoint framework of analysis that will enable the assessment of water stress, inter-sectoral integration and the identification of response strategies. Althoughthe catchment scale seemsthe most appropriate scaleto ensurethe inclusion of possible feedbacks, the challenge is to even become specific at the sub-catchment scale, without excluding possible outsidelinks.
Doc Name: Deliverable ID: WP2.1-D2.1-1 doc Date: 30/7/2005
Final Report Public
Ce m OA : a rc hi ve o uv ert e d'I rs te a / C e ma gr ef
2
.
S
teps
into
an
adequate
“Water
S
tress”
def
in
it
ion
2a
.
State
of
the
art
Beforefocusing onthe analysis of water stressindicators,itis usefulto report afew definitionsinvolvedin the concept of water stress and ofthe different andinterrelated concepts of water shortage and water scarcity.
During the last decades in which different problems with water distribution among humans have arisen, water stress has been defined by different scholars. The term of “ water stress” (WS) has been first used in the environmental research regarding mostly the stress conditions that some plants or animals have suffered due to changesin water availability. Water stress may be manifested as water scarcity (toolittle water),flooding (too much water), fluctuating water supplies (leading to temporary periods of either drought or flooding, or both) and water quality problems. Several definitions of stress existin ecology. Most havein commonthatthere are exceptional or external unfavourable conditions,foreign tothe system or natural butthen applied at an excessivelevel, which are called stressors,thattrigger an “alarm” response, cause an excessive or unnatural perturbation, a (functional) effect that is characterized by a direction, magnitude and persistence (Wickam et al., 1997 and references therein). In generalthe state of well-being of an organism orthefunctioning of an ecosystemis endangered by stressors, which causes a response (stress). Barrett (1981) distinguishes between anthropogenic stressors (e.g. habitat fragmentation; pollution;introduction ofexotic species), natural stressors (e.g. extreme weather events) and natural covariates (prevailing climate,topography, streams, wetlands,..)
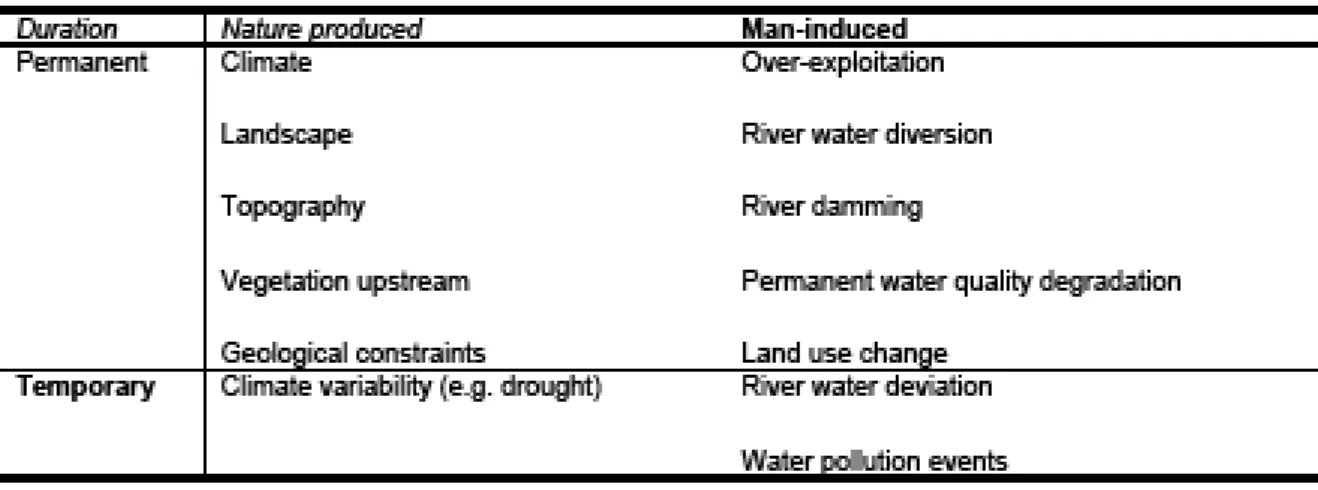
Water stress with respect to ecosystems can then for our use be defined as the responses in state and functioning of an ecosystem to an excessive or unnatural shortage of good quality water (see table 1). This shortage may be natural but excessive/exceptional (extreme weather events) or anthropogenic. Translating this to thefour xeric regimes distinguished by Pereira et al. (2002), aridity cannot be considereda stressor, butis a natural covariate. The three other xeric regimes cause stress in natural ecosystems. Aridity can be defined as a natural permanent imbalance in the water availability consisting in low average annual precipitation resulting in overall low moisture and low carrying capacity of the ecosystems. Drought is a natural but temporary imbalance of water availability resulting in diminished water resources availability, and reduced carrying capacity of the ecosystems (UNESCO, 2002). Droughts are extremes of the normal climatic variation and as such may lead to temporary changes in ecosystem functioning. Healthy ecosystems should then return to their pre-drought state. However, if ecosystem resilience is decreased through other –anthropogenic- stresses, drought may induce a series of catastrophic eventsthatleadtothe collapse ofthe systeminto another – often considered degraded- state.
table
1:
Examples
of
factors
affecting
water
availability
Duration Natureproduced Man-induced Permanent ClimateLandscape Topography
Vegetation upstream Geological constraints
Over-exploitation River water diversion River damming
Permanent water quality degradation Land use change
Temporary Climate variability (e.g. drought) River water deviation Water pollution events
Man-induced water scarcity also can be either permanent or temporary. Both will decrease the resilience ofthe system, which may or may not eventuallyleadto a different domain of attraction and a collapse ofthe system to a different state. Hence, although one maythink that this problem is limited to (semi-) arid regions, it may occur in more moderate and continental climates not affected bylimited rainfall.
The European Environmental Agency (EEA) defines WS as: “Water stress occurs when the demand for water exceeds the available amount during a certain period or when poor quality restricts its use. Water stress causes deterioration of fresh water resources in terms of quantity (aquifer over-exploitation, dry rivers, etc.) and Doc Name: Deliverable ID: WP2.1-D2.1-1 doc Date: 30/7/2005
Final Report Public
Ce m OA : a rc hi ve o uv ert e d'I rs te a / C e ma gr ef
quality (eutrophication, organic matter pollution, saline intrusion, etc.)”1. Cortes (2003) differentiated between hydrological stress and scarcity when he talks about WS, defining the first as water deficit because of meteorological adverse conditions and the second as hydrological stress due to population pressure and contamination. Another definition is given by the Commonwealth Water Resource Comission: A stressed basin is defined as a basin or sub-basinin whichthe quantity of streamflow has been significantlyreduced, orthe quality of the streamflow is degraded, or the key habitat factors are impaired2. Abraams defines water stress as “the symptomatic consequence of scarcity which may manifestitself asincreasing conflict over sectoral usage, a decline in servicelevels, cropfailure,foodinsecurity, etc ".
It is generally recognised (EEA, 1999; Abrams, 2000; Pereira et al., 2002) that water shortage is an absolute concept for describing a situation where levels of available water do not meet certain defined minimum requirements.
Conversely, water scarcity is a more relative concept, describing the relationship between water demand and its availability (Abrams, 2000). The concept of scarcity also embraces the quality of water because degraded water resources are unavailable or at best only marginally availablefor usein human and natural systems.
Water availability, sufficiency or scarcity, greatly depend on the demand placed upon the existing water resources. Water scarcity may be produced by natural causes, may be induced by human activities or may result from the interaction of both. Between the natural causes, those linked to the climatic conditions, such as aridity or drought, play an important role. Critical situations associated with water scarcity might be of a temporary (drought, shortage) or permanent (aridity, desertification) nature.
Unfavourable climatic conditions coupled with unfavourable topography, geology, demand for irrigation or water supplies for concentrated populations in excess of the available supply are processed leading to water scarcity. Moreover, water scarcity is exacerbated as a result of mismanagement of the available limited water resources. Besides, water demand should beitselfthe subject of proper managementto preventthetriggering and exacerbating of water stress episodes. In this sense, water policies should work on both sides: effective management ofthe available resources andthe sustainability of demand.
Inthe scientificliteraturethere are several definition of water stress, mostly relatedtothe water availability for human life. Some of them fix thresholds of water availability pro-capita in terms of m3of water per person per year. These thresholds have been used to indicate that a region is water stressed since under these conditions populations face very large problems when a drought occurs or when man-made shortages are created. These definitions, mainly related to the quantity of the available water, have been largely used in the scientific literature and to support decision process in water resources management. The assessment of quantitative indicators to evaluatethe water scarcities andthe environmentalimpacts has been given priority attentions by researcherinthe past.
In a general way, water stress is the symptomatic consequence of water shortage (Abrams, 2000), endangering citizens’ health, economic development and (last but not least) natural ecosystems, thus producing conflicts between different sectoral usages, a decline in the level of services, and social insecurity. The level of water stress is certainly linked to the ratio between water availability and water demand (Alcamo et al., 2003). However, this is not an exhaustive description of a more complex problem. The social and economic aspects of water use, and the implementation of strategies to compensate for the scarcity of renewable water have not been 1
h
t
tp
:
/
/g
lossary
.eea
.eu
.
in
t
/
EEAG
lossary
/W
/wa
ter_s
tress
2
Quant
ity:
A
s
ign
i
f
ican
t
reduc
t
ion
in
s
tream
f
low
is
de
f
ined
as
a
decrease
in
key
low
and
h
igh
s
tream
f
low
s
ta
t
is
t
ics
.
Low
f
lows
in
mos
t
o
f
Massachuse
t
ts
re
f
lec
t
ground
wa
ter
leve
ls
and
are
a
good
ind
ica
tor
o
f
the
hea
l
th
o
f
a
sys
tem
.
Reduced
low
f
low
s
can
impac
t
aqua
t
ic
hab
i
ta
t
and
wa
ter
qua
l
i
ty
.
In
add
i
t
ion
,
low
f
lows
are
o
f
ten
the
f
irs
t
ind
ica
tor
o
f env
ironmen
ta
l
impac
ts
.
However
,
where
f
lood
sk
imm
ing
opera
t
ions
or
dam
regu
la
t
ions
occur
,
reduc
t
ions
in
h
igh
f
low
s
ta
t
is
t
ics
can
be
a
lso
be
s
ign
i
f
ican
t
.
Qua
l
ity:
A
degraded
wa
ter
qua
l
i
ty
is
de
f
ined
as
wa
ter
in
a
s
tream
tha
t
does
no
t
mee
t
sur
face
wa
ter
qua
l
i
ty
s
tandards
.
Hab
itat
Factors:
A
degraded
hab
i
ta
t
is
de
f
ined
as
a
r
iver
reach
in
wh
ich
key
hab
i
ta
t
fac
tors
,
such
as
tempera
ture
,
qua
l
i
ty
,
cover
, subs
tra
te
and
access
ib
i
l
i
ty
,
necessary
to
sus
ta
in
a
b
io
log
ica
l
ly
d
iverse
commun
i
ty
are
degraded
.
The
s
tress
can
be
due
to
a
lack
o
f
s
tream
f
low
,
qua
l
i
ty
degrada
t
ion
,
presence
o
f
dams
,
channe
l
mod
i
f
ica
t
ions
,
cu
lver
t
ing
and
o
ther
fac
tors
.
Ind
ica
tors
o
f
s
tressed
hab
i
ta
t
inc
lude
the
absence
or
degrada
t
ion
o
f
a
targe
t
f
ish
or
o
ther
aqua
t
ic
commun
i
ty
or
the
absence
o
f
the
ab
i
l
i
ty
o
f
f
ish
to
move
be
tween
mu
l
tip
le
hab
i
ta
ts
necessary
to
the
ir
l
i
fe
cyc
les
.
Fac
tors
tha
t
l
im
i
t
movemen
t
inc
lude
lack
o
f
f
low
,
or
re
aches
w
i
th
no
f
low
,
and
the
presence
o
f
dams
or
o
ther
res
t
r
ic
t
ions
tha
t
preven
t
passage
.
Doc Name: Deliverable ID: WP2.1-D2.1-1 doc Date: 30/7/2005
Final Report Public
Ce m OA : a rc hi ve o uv ert e d'I rs te a / C e ma gr ef
taken into consideration. Thus, these definitions give no considerations to the social, institutional and economic capacity of countries to deal with water scarcity. Water stress, indeed, is not experienced in the same wayin each sector andin each region but depends onthe vulnerability of a sector and a regiontoit, as well as ontheir abilityto cope withit.
Some attempts have been made to take into account the social dimension of water stress, defining the social water stress index (SWSI) which combines standard hydrological resource data with measures of the adaptive capacity of a societyto deal with water scarcity (Appelgren and Klohn, 1999). Therefore, accordingtothe SWSIthe scarcity of water availability can be compensated by a higher social adaptive capacity.
Traditionally, measuresimplementedto cope with water stress (mainlyin arid and semi-arid regions) have generally relied onthe development of supplyinfrastructures andtechnology-intensive solutions, ratherthan onthe control of demand (EEA, 2001; Hamdy et al., 2003). This limited “cultural approach” has often compromised the effectiveness of the outcomes and caused worsening of the state of the environment and of freshwater resources. Other measures are aimed at reducing or controlling the demand for water including water pricing, water-saving devices and reduction of waterleakagein distribution systems.
Water is essential to human life. It is also a thread that inextricably links the systems of the environment: the economy andthe environment. Water resources areindispensabletothe survival of both systems and boththe quantity and quality of water resources are impacted upon by economic and natural systems. The earth's renewable supply of wateris governed bythe hydrologic cycle, a system of continuous water circulation. Enormous quantities of water are cycled through this system, though only a fraction of circulated water is available each year for human use. Available supplies are derivedfromtwo rather different sources: surface water and ground water.
If surface and ground water were available in unlimited quantities, at constant cost of extraction, no scarcity value (reflecting the opportunity cost associated with the unavailability in the future of any unit of water used in the present) would be generated for in situ water. However, since water resources exhibit natural supply constraints (both in terms of quantity and quality), the scarcity value of that water must be imposed on current users. Onlyin this way will the proper incentive for conservation be created and the interests of future generations of water users be preserved. Alternatively, if water withdrawals exceed recharge, the resource will be mined over time until either supplyis exhausted orthe marginal cost of extracting additional water becomes prohibitive. Hence, the efficient pricing of water entails a unit price equaltothe sum of marginal extraction cost plusthis scarcity value.
Starting around the 1870, the economics profession concentration on scarcity value allowed both sides of the market, i.e. the supply and demand, to be analysed simultaneously. Economists compared the amount of a resource that was available (supply) with the amount required (demand). The interaction of supply and demand then determinedthe equilibrium market priceforthe commodity. Under appropriate market conditions,the efficiency price would also be the market price of extracted water. But in the absence of clear ownership rights and viable efficient water markets, including the scarcity value in water prices is rather difficult because there is limited price and quantity datafrom which the benefit offoregoing water usage currently as a means of reducingfuture costs of acquiring water, can be estimated.
Is an efficient allocation of water likely to be achieved in real world economies? If water could be purchased in a perfectly functioning market, efficient pricing and allocation of the resource would be achieved through Adam Smith's "invisible hand" and water management would not be an important policy matter. However, the difficulty of establishing clear ownership rights in water exploitation makes it improbable or even impossible for markets for this resource to function competitively. For common property resources, the neoclassical economic paradigm suggests that the relevant scarcity value is ignored, which has several dynamic consequences for water allocation: extraction costs rise too rapidly, the initial price is too low, and too much water is consumed by the earliest users to the detriment of the welfare of future users, both in quantity and quality terms. How much water abstraction rights should be allocated to ecosystems? Regarding elementary water needs for human survival it is doubtfulfrom an ethical point of viewifthese can beleftto allocation by market based mechanisms? Allin all water stressis mostlikelyto arise.
2b.
Choosing
a
definition
for
WS
One of the first steps into the definition of water stress is the description of “stress” for a location-specific situation. Defining the point at which a region or human population moves from being non-water-stressed to water stressed requires a definition of‘normal conditions’.‘Normal conditions’ may be reflectedin a certain quality of life; for example, water scarcity in one region may simply be having enough water to grow sufficient food to live, whereas in another region it may be having enough water to irrigate a lawn. These examples of what is ‘normal’ depend largely upon environmental factors, e.g. climate, landscape, and the water resources available. Possibly Doc Name: Deliverable ID: WP2.1-D2.1-1 doc Date: 30/7/2005
Final Report Public
Ce m OA : a rc hi ve o uv ert e d'I rs te a / C e ma gr ef
more importantly, in terms of moving from a non-water-stressed (normal) state to water stressed (abnormal) state, they also depend upon human interaction with the above factors and the resulting impact of this interaction, e.g. over-exploitation, water shortages and pollution.
A workshop in Porto was organised for WB2 to develop the framework for the characteriziation of water stress. Duringthe meeting different definitionsfor WS were worked out amongthe participants of WB2. Following a first choice of a set of definitions, one was choosen due to mayority acceptance among the AquaS tress-Participants. This definition should be the definition for WS for the AquaStress project. The definition covers the needs of the test-site rooted and stakeholder driven project. The time-cultural-local-ecosystem frame of the definition of water stress will give us an accurate adaptive definition for each of the test-sites with their respective characteristics:
Water
stress
occurs
when
the
funct
ions
of
water
in
the
system
do
not
reach
the
standards
3(o
f po
l
ic
ies) and or percept
ions (of the popu
lat
ion) on an appropr
iate
quant
ity
and
qua
l
ity
,
at
an
appropr
iate
sca
le
and
the
adaptab
i
l
ity
for
reach
ing
those
is
not
g
iven
.
43
.
Methods
to
measure
WS
3a.
DPSIR
DPSIR, as a general framework, can be used to characterize and manage any kind of environmental problem (Dhakal and Imura 2003, Odermatt 2004). A review of current literature indicates that this approach has been extensively applied to water-related environmental issues. DPSIR has been proposed to assess problems in coastal environments,including bays and estuaries (Jorge et al. 2002, Bidone and Lacerda 2004, Cassazza 2002); river basins (Dietrich et al 2004, Walmsley 2002); or a combination of both (Trombino et al. 2003); groundwater studies (Cools et al. 2002), and wetlands (Turner at el. 2004), to cite some examples ofthe most recentliterature.
One of the reasons for the widespread use of DPSIR lies in the fact that regional or global organizations such as the European Environment Agency (EEA) have adopted it as a general protocol to tackle environmental issues (European Environment Agency 1999). EEA underlinesthe adequacy of DPSIR asan approachthat permits the establishment of causalrelationships between human activities andtheir environmentalimpacts, andthe effects of societal responses (European Environment Agency 1999). Despite the great number of studies that utilize DPSIR as an analysis framework, few reports explicitly address its advantages. These studies seem to exclusively agree on its ability to organize and present environmental problems, and to help scientists and managers to think about processes in terms of causality (Jorge et. al 2002, Caeiro et al. 1999, Turner et al. 2004). Among its advantagesit can be addedthat DPSIR (together withits predecessor, PSR) represents one ofthefirst generalized attemptto deal with environmental problemsin which human needs andimpact are anintegral part ofthe scheme. Also, since DPSIR requires the establishment of causal relationships between a sequence of indicators, it undoubtedly constitutes an improvement over the simple use of environmental indicators or aggregates of indicators, whichfrequentlyinduce an over simplification ofthe problems.
Several disadvantages of the DPSIR approach have been put forward. In some cases, isolated chains of indicators may not be enoughto reproducethe complexityof systems (Bassel 1999, Rekolainen et al. 2003, Caeiro et al. 1999, Jorge et al. 2002), whichtendto behave morelike a network ratherthan alinear chain. Also,the need to assign a specific role (driver, pressure, state, etc.) to environmental indicators induces the creation of static categorizations, whereasin reality,for example, under certain conditions a response can become a driver.
3
Under
“standard”
shou
ld
be
understood
the
“
leve
l”
needed
for
the
who
le
ecosystem
(understand
ing
humans
as
a
part
o
f
the
ecosystem)
.
Usua
l
ly
these
standards
are
descr
ibed
by
po
l
it
ica
l
bod
ies
.
S
ince
ecosystems
can
not
ta
lk
,
the
po
l
it
ica
l
bod
ies
for
ecosystems
wou
ld
be
NGO
as
we
l
l
as
any
sc
ient
i
f
ic
pub
l
icat
ion
4
The
e
lect
ion
processs
for
th
is
de
f
in
it
ion
is
documented
in
the
annex
.
Doc Name: Deliverable ID: WP2.1-D2.1-1 doc Date: 30/7/2005
Final Report Public
Ce m OA : a rc hi ve o uv ert e d'I rs te a / C e ma gr ef
In other words, DPSIR’s strength is also its weakness: on one hand it helps organize concepts and information, and to focus on certain correcting actions to solve problems that otherwise may seem too complex to address. Onthe other hand, oncethe characteristics ofthe problem have been defined,the DPSIR approach might leavelittle roomfor expansion orimprovement, withoutthe needto redefinethe whole structure.
It should be emphasized, however, that DPSIR is not a model, but an organizational scheme. This needs to be kept in mind to avoid excessive expectations over consistency of defining criteria or specific outcomes. With these constrains and shortcomings of DPSIRtakeninto consideration, we have decidedto adoptit as aframework for our study.
3b.
Indicators
description
Inthefollowing we usethe wordindicator onlyfor a directly measurable variables.Index refersto some aggregation of individual indicators or even indices. It would be more useful to have a consistent use of these terms in the literature.
Existingindices
Examplesfor quantityindex:
WPI (water poverty index,): the index tries to show the connection between water scarcity issues and soc io-economic aspects, this index consists of five major components (resources, access, capacity, use, environment), each with several sub-components.
WEI (water exploitation index): measures the relative pressure of annual production on groundwater resources; sum ofthe volumes of annual conventionalrenewable naturalfreshwater productionfor all usesincluding alllosses overthe volume of average annualflows of renewable groundwater resources (recharge).
WSI (Falkenmark water stressindicator;): available waterresourcesin a given region per year andthe number of inhabitants, regardlesstothetemporal and spatial distribution
of waterresources.
WAI (water availabilityindex):theindexincludes surface water as well as groundwater resources, and compares thetotal amounttothe demands of allsectors,i.e. domestic,industrial and agricultural demands; The surface water availabilityis calculated as the 90% reliable runoff. The groundwater availabilityis estimated either asthe potential recharge that is calculated from the monthly surface water balance, or as the potential aquifer yield, and the lower figureis consideredinthe calculation.
RWS (water scarcityindex): combinesinformation about water abstractions and water availability,itis defined by the intensity of use of water resources,i.e. the gross freshwater abstractions as percentage of the total renewable water resources or as percentage of internal water resources ; RWS=(W-S)/Q; where RWS is the water scarcity index, W are the annual freshwater abstractions, S are the desalinated water resources and Q is the annual available water.
WF (water usefactor): describes how often wateris used beforeit needsto be substituted. For example, a water use factor of 3 means that freshwater water input of 1 m³ is sufficient to run processes that actually need 3 m³ primarily by regenerating and recycling used volumesinstead.
Annual Withdrawals of Ground and Surface Water as a Percent of Total Renewable
Water: this indicator has several important limitations, most of them related to the computation of total renewable water resources
Examples for quality indicators: nitrate in groundwater, organic matter in rivers, nutrients in rivers, phosphorus in lakes, nutrientsin coastal and marine waters
Examples ofintegratedindices and assessment systems
Ladson (2000) and coworkers developed the multimetric Index of Stream Condition for waterway management in Australia. The index is composed of 5 subindices (hydrology, Physical form, Streamside zone, Water quality and Aquatic life). Each subindex is built up of several indicators and then scaled between 0-10. They are added to the Index of Stream Condition, ranging between 0-50. The valuing of individual indicators is based on a comparison with what modeled or measured pristine conditions, and thus gives an estimate of anthropogenic effect on the ecosystem. Abiotic and bioticindicators are combinedinto one value.
Doc Name: Deliverable ID: WP2.1-D2.1-1 doc Date: 30/7/2005
Final Report Public
Ce m OA : a rc hi ve o uv ert e d'I rs te a / C e ma gr ef
The Swedisch Environmental Protection Agency uses a similar approach, where indicator values determine quality classes, which arethen summarizedto oneindex.Indices have been developedfor groundwater, combining water table and chemical characteristics, for seas and coastal zones, for lakes and watercourses, combining chemical, physical (transparency) and bioticindicators,forforests andfor agriculturallandscapes.
Walmsley et al (2001) reviewed five indices for sustainable catchment development used by catchment management agencies, NGO’s, government agencies and international organizations. All five had some indicators of water availability, four out of five used indicators for socio-economic data, water quality data, and resource condition data. Three out of five had indicators for policy and management. Resource condition included both Biodiversity and ecosystem integrity and Landuse change. Biodiversity and ecosystem integrity is measured using species data (salmon, macroinvertebrates, fish, birds) but also by structural characteristics (length of stream protected or rehabilitated, estuarine pollution, area affected by erosion,…). The comparison focused on similarities inindicator-ingredients, ratherthaninindex calculationfromtheindicators, sofewinformation aboutthisis given. Lasage and Aerts () developed an approach that is based on chemical and hydrological state indicators and structural (land-use) and biotic (fish) decision indicators. The different indicator values are not combined to a multimetric index but are used separately to compare for which indicators the ecosystems under study are most threatened.
The examples showthat most (not all)integrated indices have been developedfor aquatic systems. I.Indicators for water stressin theindustrial sector
To describethe economic, environmental, social and/orinstitutional conditions of a country, region, community, etc. indicators are used. The well-known and frequently used economic indicators gross domestic product (GDP) and gross national product (GNP) arejusttwo examples ofindicators usedinthe economy.
Indicators are instruments of simplification. The simplification is achieved by summarising large amounts of measurements to a simple and understandable form in order to stress the main characteristics of a system. Informationis reducedtoits elements, maintainingthecrucial meaningforthe questions under consideration. Inindustrial water managementindicators can be usedto describethe waterintensity of a process. Cooling wateris the largest industrial demand for water and as such is the predominant industrial water reuse either for cooling towers or cooling ponds.Industrial uses vary greatly andwater quality requirementstendto beindustry-specific. To provide adequate water quality, supplemental treatment may be required beyond conventional secondary wastewatertreatment and hastherefore aninfluence onthe costs.
Water in industry is used for cooling, transportation and washing, as a solvent, and also sometimes entering the composition of the finished product. The volumes of industrial water withdrawal are quite different within individual industrial branches and also within different kinds of production, depending on thetechnology ofthe manufacturing process. It depends on climatic conditions since, as a rule, industrial water withdrawal seems to be considerably lessin northernthanin southern regionswhere higher airtemperatures prevail.
In addition to thermal power, the other principal industrial water users are chemical and ferrous and non-ferrous metallurgy, the wood pulp and paper industry, and machinery manufacture. The major characteristics of industrial water use - the volume of fresh water withdrawal, water consumption, water diversion - depend to a very large extent onthe water supply systemin use.
II.Indicators for water stressin the domestic sector
Domestic water use is dependent upon local population demographics, climate variability and water use efficiency. As well as addressingthese demandfactors,the development of a set ofindicator variablesforthe domestic sector must also explore indicators of the quality and quantity of water resources available, the current capacity of the water supply network, and the regional social and institutional capacity. This section will therefore be structured aroundfourindicator categories asfollows:
• Demandindicator variables • Supply indicator variables • Network capacity
• Social andinstitutional capacity Domestic demandindicator variables
The simplest indicator of domestic water demand is daily, monthly or annual volumetric per capita use. A simple measure of water use efficiency can use a comparison between water uses in different regions or a hypothetical Doc Name: Deliverable ID: WP2.1-D2.1-1 doc Date: 30/7/2005
Final Report Public
Ce m OA : a rc hi ve o uv ert e d'I rs te a / C e ma gr ef
comparison between basic human needs and actual water consumption. Basic human needs vary for different regions due to climate, cultural, and economic factors. One approach is to use a volume based on the minimum human water requirements. The WHO/UNICEF (2000) adopt a figure of 7.3 m3/capita/year (20 l/day/capita) accessible from a source within 1 km of a user's dwelling as achieving "reasonable access" to water. Because of economic and cultural reasons, the volume of water consumed in any society varies significantly and the WHO/UNICEF figure is far below the level of domestic water use in most developed countries and makes no allowanceforthe needsto maintain even a non-agricultural economy. Afigure of 18.3 m3/cap/year (50l/day/capita), as suggested by Gleick (1996) could be taken as a minimal domestic water requirement, but this figure makes no allowance for industrial needs since it is based only upon estimates of the amounts of water required for drinking, sanitation, bathing and food preparation at a minimal acceptable basic level. For this reason, when estimating the cost of supplying an adequate volume of potable water to all people at all times, the figure of 125 m3/capita/year could be adopted, as proposed by Shuval (1992). Domestic needs as well as modest industrial and gardening needs areincorporatedinthisfigure.
The success of any demand management strategy to reduce residential water use using water conservation tools (e.g. household retrofits, education, pricing policies, metering)is susceptible tothe attitudes ofthe partiesinvolved, i.e. consumers and suppliers. Consumer attitudestowardsdemand management strategies determinethe uptakein voluntary participation programs. Water service providers who supply water are at risk of suffering reduced revenues due to increased efficiency, as well as paying for the implementation of conservation tools. Suitable policies are therefore required which allow water utilities to implement conservation strategies without incurring losses, whilst maintaining equitable conditions among consumers. In the UK, this issue is addressed by the water regulator OFWATthrough regulating water prices and allowingfor changesin revenues and operating costs dueto demand management. In reducing volumetric throughput within a water supply network, a further economic output is requiredforinfrastructure changes (e.g. pipe widths, pumping requirements etc). Anindicator signallingthe need for suitable policy mechanisms to encourage and allow for water utilities to encourage water conservation is therefore required.
Accurate forecasting of domestic water demand usually involves an intensive data collection exercise. Virtually all variables used to forecast water demand are uncertain: population and household formation, employment and industrial growth, income and water use characteristics by customer sectors, conservation targets and performances, and weather. Reported ranges for co-efficient of water use versus water price, population demographic and climatefactors are shownin Table 2 below.
Tab
le
2
-
E
last
ic
it
ies
of
factors
affect
ing
the
magn
itude
of
urban
water
consumpt
ion
(Kanakoud
is
,
2001)
Fac
tor
E
las
t
ic
i
ty
range
Mean
Wa
ter
pr
ice
-0
.1
to
-1
.0
-0
.51
Res
iden
t
ia
l
Income
+0
.144
to
+0
.458
+0
.23
No
. o
f person per wa
ter
b
i
l
l
+0
.26
to
+2
.51
+1
.39
Type
&
no
.
o
f
res
idenc
ies
-0
.24
to
-1
.0
-0
.93
C
l
ima
te
-0
.1
to
-0
.3
-0
.169
Indicators used for demographic variability include the Gini coefficient and, for income variability, Lorenz curves. These indicators can be used where the resources are not available to collect large data sets. The Gini coefficient is the most common statistical index of diversity or inequality in social sciences. It is widely used as a standard measure ofinter-individual orinter-householdinequalityinincome and wealth. The Lorenz (or concentration) curve is the most common device for a full description of distribution of income in a population. It represents cumulative income share as a function of the cumulative population share. These indicators are utilised by regressing demographic variables (e.g. household income, household occupancy, plot size etc) on water demand, and predictingtheimpact of population changes and demand management needs (Shkolnikov et al, 2003).
Demographic indicators which address spatial variations are used in urban planning and understanding residential access to water supplies. As shown previously (Figure 4) the proportion of the population connected to water and sewerage servicesin rural areasis oftenfarlowerthan in urban areas. Population density (population/hectare) can be usedto distinguish between rural and urban areas. Comparative DispersionIndex (CDI) uses population density toindicateinefficientland use,i.e. where high populationdensities arefoundinfar reaching suburbs oflarge cities. Doc Name: Deliverable ID: WP2.1-D2.1-1 doc Date: 30/7/2005
Final Report Public
Ce m OA : a rc hi ve o uv ert e d'I rs te a / C e ma gr ef
The CDI for a number of European cities is shown in Figure 5 below. A CDI below 1.00 indicates inefficient land use.
Figure 5 Comparative dispersionindex (SCDS, 2001)
In the above figure similar CDI’s are reported for eastern and central European cities, e.g. Cracow, Ljubljana, and Prague, caused by high-density residential neighbourhoodsinfar away suburbs.
Whenforecasting monthly residential water consumption, atleast 80 percent ofthetotal variation can be explained bythe seasonal pattern (Weber, 1993). The deviations of consumptionfromthe normal consumption dueto rainfall andtemperature can be defined bythe seasonal pattern orindex. For example,ifthetemperaturein July of a given yearis consistently 20oF higherthanthe normal (average) Julytemperature, consumption would be expectedto be greater than normal. This method produces very well defined measurements of weather effects. The table below (Table 3) shows how monthly consumption varies in Athens due to climate variability. The additional columns on the rightindicatethe changein demand dueto anincreasein price.
Tab
le
3
Factors
of
the
month
ly
consumpt
ion
and
sav
ings
in
Athens
(1989-1993)
(Kanakoud
is
,
2001)
Mon
th
Fac
tor
o
f
Mon
th
ly
consump
t
ion
Sav
ings
(1989-92)
due
to
300%
pr
ice
increase
Sav
ings
(1992-1993)
due
to
doub
l
ing
in
pr
ice
January
0
.86
-4
.8
-10
.5
February
0
.79
-4
.9
-27
.2
March
0
.89
-8
.5
-27
.8
Apr
i
l
0
.91
-11
.9
-28
.3
May
1
.04
-7
.8
-29
.9
June
1
.12
-6
-30
.6
Doc Name: Deliverable ID: WP2.1-D2.1-1 doc Date: 30/7/2005
Final Report Public
Ce m OA : a rc hi ve o uv ert e d'I rs te a / C e ma gr ef
Ju
ly
1
.21
-18
.1
-27
.4
Augus
t
1
.17
-16
.7
-29
.6
Sep
tember
1
.1
-17
.3
-27
.6
Oc
tober
1
.05
-13
.8
-23
.6
November
0
.93
13
.7
-22
.3
December
0
.93
17
.2
-15
.6
Major losses of water due to leakages have recently been reported in a number of countries including Italy (30%) and Bulgaria (50%) (EEA, 2003). Leakagelosses are an appropriateindicator ofinefficient water use.
Supplyindicator variables
Temporal variations in water supply at abstraction points caused by changes in surface or groundwater levels can lead to domestic water shortages. The withdrawal-to-availability (wta) combines demand and supply data to indicate whetherthereis a risk of water shortage occurring.
Forecasting droughts provides critical information for implementing drought contingency planning. A number of models for predicting occurrences of drought have been developed. Research initiated by the ARIDE Project (Assessment of the Regional Impact of Drought in Europe) has also developed a method to estimate regional meteorological and hydrological drought characteristics in a case study in Denmark. The method used generates drought severity–area–frequency curves derivedfromthe probability distributionfunctionsforthe area covered by a drought combined withthe drought deficit volumes. These curves allowed an estimation ofthe probability of an area of a certain extent to have a drought of a given severity, and thereby return periods can be assigned to historical drought events (Hisdal & Tallaksen, 2003). There may also be potential for using crop system models based on the philosophy ofthe FAO (e.g. GIEWS, FEWS, AGRHYMET–EWS). These systemstryto optimizethe combination of several kinds of data: punctual (meteorological data) or continuous (satellite data), historical orin-time data,to seek forthe best yield forecasting (FAO, 2003).
Network capacityindicator variables
The following section discusses indicators of network’s capacity to serve the local population. The capacity of a water network can be understood in terms of leakage, water service connections, water service performance indicators, and water quality (potable and wastewater) indicators. Therefore network capacity is also useful as an indicator ofthelevel of sustainable human development and adaptive capacity.
Leakagelosses duetofailinginfrastructure are discussesfurtherin section 5e. Levels of urban waterinfrastructure leakagefor 15 European countries are shownin Figure 6.
Urban/ rural drinking water and sewerage connection have been discussed previouslyin section 5b (see Figure 4) and are a useful indicator of public health and human development used by the World Health Organisation and United Nation Children’s Fund Joint Monitoring Programme, 2002. Performance indicators are used by regulatory bodies and stakeholder initiatives to understand problems and challenges facing water service providers (WSPs). The UK water industry regulator OFWAT assesses overall performance of water companies using four categories: water supply; sewerage service andflooding; customer service; and environmentalimpact. The English and Welsh water utilities provide OFWAT with annual data regarding their performance against various ‘levels of service’. Annual OFWAT reports compare water company performance againstindustry averages. Table 4 below showsthe assessment criteria for overall performance score assessment for English & Welsh WSPs. An example of a sectoral initiative involved in the design of performance indicators is the publication of a manual on performance indicators for water supply services by the IWA. A parallel IWA initiative is now considering a similar application to sewerage. There are 133 IWA water supply service indicators, in six categories, complemented by contextual data forthe WSP, asillustratedin Table 5 (Ashley and Hopkinson, 2003).
Figure 6 Estimatedlosses for urban water networks (EEA, 2003)
Doc Name: Deliverable ID: WP2.1-D2.1-1 doc Date: 30/7/2005
Final Report Public
Ce m OA : a rc hi ve o uv ert e d'I rs te a / C e ma gr ef
The data intensive nature of some performance indicators listed below may make them unfeasible for use in the Aquastress context. However, indicators such as non-payment of bills, bills not based on meter readings, and properties subject to planned / unplanned cut-offs would be useful (and feasible) as domestic water stress indicators.
Water quality (potable and wastewater effluent) indicators also indicator a failing water network. The main water quality parameters whichfailed EC drinking water standards between 1996 and 1998 are shownin Figure 7 below. These parameters are discussedin more detailin section 5e.
The major parameters addressed bythe UWWTDfor monitoring domestic wastewater
effluent and the most suitable indicators of efficient treatment are Nitrogen, Phosphorus and biological oxygen demand (BOD5).
Table 4 assessment criteria for overall performance score assessment for English & Welsh WSPs (Ashley and Hopkinson, 2002)
DG
NO
.
DESCR
IPT
ION
ASSESSMENT
APPROACH
* = Absolute assessment** =Comparative assessment
EXAMPLES
3 Properties subject to unplanned supply interruptions of 12 hours or more.
* Primary criteria: % complaints answered within 10 working days
6 Billing contacts not responded to in *Good >99.5%
Doc Name: Deliverable ID: WP2.1-D2.1-1 doc Date: 30/7/2005
Final Report Public
Ce m OA : a rc hi ve o uv ert e d'I rs te a / C e ma gr ef