HAL Id: hal-01997851
https://hal.archives-ouvertes.fr/hal-01997851
Submitted on 13 Feb 2019
HAL is a multi-disciplinary open access
archive for the deposit and dissemination of sci-entific research documents, whether they are pub-lished or not. The documents may come from teaching and research institutions in France or abroad, or from public or private research centers.
L’archive ouverte pluridisciplinaire HAL, est destinée au dépôt et à la diffusion de documents scientifiques de niveau recherche, publiés ou non, émanant des établissements d’enseignement et de recherche français ou étrangers, des laboratoires publics ou privés.
Retrieving Ice-avalanche basal friction law parameters
from a back-analysis of the collapse of Altels glacier
(1895, Bernese Alps, Switzerland). Application to
Taconnaz glacier instability (French Alps)
Emmanuel Thibert, Thierry Faug, Adrien Gilbert, Christian Vincent, Olivier
Gagliardini, Mohamed Naaim, Mylène Bonnefoy-Demongeot, Martin Funk
To cite this version:
Emmanuel Thibert, Thierry Faug, Adrien Gilbert, Christian Vincent, Olivier Gagliardini, et al.. Re-trieving Ice-avalanche basal friction law parameters from a back-analysis of the collapse of Altels glacier (1895, Bernese Alps, Switzerland). Application to Taconnaz glacier instability (French Alps). International Snow Science Workshop, Oct 2018, Innsbruck, Austria. �hal-01997851�
RETRIEVING ICE-AVALANCHE BASAL FRICTION LAW PARAMETERS FROM A
BACK-ANALYSIS OF THE COLLAPSE OF ALTELS GLACIER (1895, BERNESE ALPS,
SWIT-ZERLAND). APPLICATION TO TACONNAZ GLACIER INSTABILITY (FRENCH ALPS)
Emmanuel Thibert1*, Thierry Faug1, Adrien Gilbert2, Christian Vincent2
Olivier Gagliardini2, Mohamed Naaim1, Mylène Bonnefoy-Demongeot1 and Martin Funk3
1 Univ. Grenoble Alpes, Irstea, UR ETGR, F-38402 St Martin d’Hères, France 2
IGE, Université Grenoble Alpes CNRS, Grenoble, France 3
Laboratory of Hydraulics, Hydrology and Glaciology (VAW), ETH Zürich, Zürich, Switzerland
ABSTRACT: High-elevation glaciers are undergoing substantial warming in response to current climate change. This warming is affecting the ice/rock interface temperature, the primary control of glacier stability on steep slopes. Instability may give rise to the collapse of large parts of hanging glaciers. The rheology of ice-avalanches is still poorly known but expected to deviate from snow-ice-avalanches rheology. Here we retrieve the avalanche basal friction law parameters (Voellmy model) from a back-analysis of the largest historical ice-avalanche which occurred in the Alps at Altels glacier in 1895 (Bernese Alps, Switzerland). Prior simula-tions with a (1-D) sliding block model are performed to initiate 2-D simulasimula-tions with a shallow-flow model. The parameters found to fit of the avalanche runout are associated to very low basal friction processes compared to snow avalanches. These friction parameters are applied to possible ice avalanches released from a glaci-er in the French Alps (Taconnaz) that may become tempglaci-erate and potentially unstable by the end of the 21st century. Flow height and velocity are analyzed as a function of friction coefficients and release conditions (glacier thickness) revealing strong contrasts with snow-avalanches dynamics.
KEYWORDS: Glacier collapse, volume scenarios, ice avalanches, depth-averaged flow model.
1. INTRODUCTION
High-elevation glaciers are undergoing substantial warming in response to current climate change (Gil-bert et al., 2010; Vincent et al., 2007). This warming is affecting the thermal regime of high-elevation cold glaciers (Haeberli et al., 1997; Pralong and Funk, 2006; Faillettaz et al., 2015) and particularly at the ice/rock interface, the primary control of hanging cold glacier stability on steep slopes (Alean, 1985; Huggel, 2008; Faillettaz et al., 2011; Gilbert et al., 2015). Warming of the glacier at bedrock up to or close to the melting point yields to conditions under which the glacier can slide on the bedrock (Cuffey and Paterson, 2010). Changes in glacier dynamics are therefore expected such as increased mass fluxes of the ice flow, changes in serac calving from icefalls, or glacier instability over large area. Insta-bility may give rise to the collapse of large parts of hanging glaciers. The resulting release of ice ava-lanches may lead to major disasters in relation to the huge volumes involved glacier-ice avalanches (Lliboutry, 1975; Evans et al., 2009; Du Pasquier, 1896; Kääb et al., 2018). Ice-avalanches rheology is poorly documented but it is expected to deviate from snow-avalanche rheology due to the involved
volumes and thickness of the flow, the granular feature of the material, its temperature, etc., sug-gesting lower friction processes and longer runout distances (Margreth et al., 2011; Roth, 2016; Kääb et al., 2018). The back-analyses of past events such as Altels glacier collapse in 1895 (Heim, 1895) are thus important to improve our understanding of ice-avalanches dynamics.
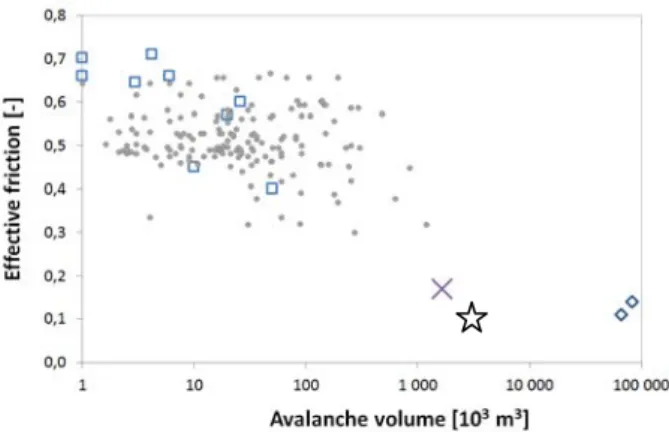
Figure 1 shows the effective friction as a function of the avalanche volume for a number of observed snow avalanches in France (data extracted from (Ancey, 2005)), compared to the back-calculated friction for two major ice avalanches which occurred in Western Tibet (Kääb et al., 2018). This plot clear-ly highlights the decrease of effective friction with volume (see more details by Ancey (2005)) and the high mobility of large ice avalanches. Typical values of the effective friction and the avalanche volume for the centennial snow avalanche event calculated by Naaim et al. (2010) at Taconnaz avalanche path, in the French Alps in Chamonix/Mont-Blanc valley, are also drawn on Figure 1. The present study address-es the Taconnaz case regarding glacier collapse and ice avalanche hazard. The glacier volumes that are likely to become instable in the future and then produce large ice avalanches are first studied (sec-tion 2). Those volumes scenarios are then used as input conditions to a series of numerical simulations based on a depth-averaged model (section 3) in order to predict ice-avalanche dynamics at Tacon-naz path, considering a virtual avalanche path free of the existing defense structures currently-built in the run-out zone (section 4).
* Corresponding author address:
Emmanuel Thibert, Univ. Grenoble Alpes, Irstea, UR ETGR, 2 rue de la Papeterie BP 76, F-38402 Saint Martin d’Hères;
tel: +33 4 76 76 28 13; fax: +33 4 76 51 38 03 email: emmanuel.thibert@irstea.fr
Figure 1: collection of data about the effective friction as a function of the avalanche volume. Data extracted from observed snow avalanches in France (squares and circles by Ancey (2005)) and back-calculated ice avalanches in Western Tibet (diamonds by Kääb et al. (2018)). The cross symbol shows the typical value of the centennial snow avalanche for Taconnaz path (Naaim et al., 2010). The star is the Altels ice-avalanche (Heim, 1895).
2. ICE-COLLAPSE VOLUME SCENARIOS
Taconnaz glacier is a north-facing hanging glacier in the Mont-Blanc range (Chamonix, France) with an upper accumulation area stretching from Dôme du Goûter (4300 m a.s.l.) down to 1700 m a.s.l. in Chamonix valley. It is divided in 2 parts by a 600 to 700–wide ice cliff at an altitude of about 3300 m a.s.l.. The ice cliff (maximum height of 100 m) is below the steepest part of this hanging glacier. Considering the important warming of high altitude cold glaciers observed over the last 20 years, Ta-connaz has been subjected to various observations and simulations in relation to the dynamics of the icefall (Vincent et al., 2014) and to its thermal re-gime (Gilbert et al., 2015). In the later study, chang-es in the thermal regime have been simulated under various climate scenarios (RCPs) with a thermo-mechanical model (Gilbert et al., 2014), indicating that large parts of the glacier should become tem-perate and potentially unstable by the end of the 21st century.
We used the “median” RCP6.0 scenario corre-sponding to a warming of +4.5°C by the end of the 21st century with respect to 1961-1990 average air temperatures. Under RCP6.0, the glacier bedrock is expected to reach the melting point around 2050-2080 for 2 areas Z2 and Z3 displayed in Fig. 3 (Gil-bert et al., 2015). The glacier thickening should be limited to 10-20 m, and the average glacier thick-ness is expected to remain significant with 71 and 66 m, respectively (within 45-80 m). These potential zones of instability have basal surface area of 0.019 and 0.028 km2. Ice volumes underlying basal ice at melting point are 1.4 and 1.9 Mm3 for Z2 and Z3, respectively.
3. ICE AVALANCHE MODELLING 3.1 Depth-averaged propagation model
The dense flows resulting from ice-collapse are in the present study modelled using a depth-averaged model supplemented with Voellmy’s rheology, which was initially developed at Irstea for the modelling of dense snow avalanche propagation (Naaim et al., 2004). The mass and momentum conservation equations in their depth-averaged form, under the shallow-water assumption, is relevant to a myriad of geophysical flows, including for instance submarine landslides (Heinrich et al., 2001), debris flows and mudflows (Iverson, 1997; Laigle and Coussot, 1997), rock avalanches (Naaim et al., 1997) and snow avalanches (Naaim et al., 2004). In the pre-sent study, both one-dimensional (1D) and two-dimensional (2D) models are considered. The Voellmy law in the form µb=µ g/ Fr2 was initially
developed for flowing snow and is still largely used for snow avalanche modelling. Its success stems from the fact that it does take into account two cru-cial contributions to resistive forces generally en-countered in geophysical flows, such as snow ava-lanches: the basal friction µb is the sum of (i) a dry
(purely) Coulomb friction µ and (ii) an inertial veloci-ty-square-dependent term in the form g/ Fr2 where g is the gravity acceleration (g=9.81 m s-2),
Fr=u/(gh)1/2 is the Froude number defined on the flow thickness h and the depth-averaged velocity u, and holds for the inertial friction coefficient. It should be stressed that the Voellmy rheology has also been applied with some success to other geo-physical flows than snow avalanches, including rock avalanches and landslides (Hungr, 1995; Poisel et al., 2008). Here, we propose to use the Voellmy rheology applied to ice avalanches. A key step is to predetermine the values of the rheological parame-ters µ and that are relevant to a large ice ava-lanche resulting from the sudden collapse of a glac-ier.
3.2 Back-calculation of Altels ice-avalanche
This section briefly describes the back-analysis of the collapse of Altels glacier which occurred in 1895 in the Bernese Alps, Switzerland (Forel, 1895; Heim, 1895 and Du Pasquier, 1896; Failletaz et al., 2011). It is the largest known and well documented glacier collapse in the Alps at the historical scale. At the end of the 19th century, the north-west face of Altels summit (3629m a.s.l.) was covered by a hanging glacier on a steep 35–40° slope (Pralong and Funk, 2006). On 11 September 1895, a large part of the glacier collapsed generating an ice-avalanche of 3.5-4.5×10⁶m3. The flow lasted ∼1min between the elevations of 3170 and 1850m and along a 3.6 km track. The ice-avalanche reached the pasture situated underneath and killed six peo-ple and 170 caws. Four huts and large forest areas
were also destroyed. In the runout area, the ava-lanche piled up to 300m on the opposite counter-slope. An area of ∼1km2
of the pasture was buried under an ice layer 3–5m thick. In the back analysis above, we used the detailed map and altitudinal profile compiled by Heim (1895) delineating the avalanche dense deposit.
A series of preliminary numerical tests using a 1D model (1DSV) were conducted in the first step and 2D simulations (2DSV) were carried out in the sec-ond step. In order to reproduce reasonably well the high mobility of the Altels ice avalanche and the mass spreading in the run-out zone, it was neces-sary to use relatively unusual values of the rheolog-ical parameter in the Voellmy friction law: =0.1 and =5000 m s-2
. In the following we propose to con-sider a wide spectrum of avalanche scenarios through the values chosen for and , including an extreme yet plausible scenario based on that back-analysis of the Altels ice avalanche. Note that such a small value of effective friction was also report-ed in a recent back-analysis of two major ice ava-lanches which occurred in Tibet (Kääb et al., 2018).
Figure 2: Profiles for elevation, velocity (red) and flow height deposit (blue) along the main track for Altels ava-lanche. The runout from Heim (1895) is d=5000 m on the X-axis.
4. RESULTS FOR TACONNAZ CASE 4.1 Main assumptions made for calculations
The digital terrain model (DTM) used in the present study does not account for the existing protection structures currently built at Taconnaz avalanche path. A virtual case without any structures in the run-out zone is considered instead (see Figure 2). Such a choice is partly justified by a number of questions raised regarding the resistance of the currently-built structures to the impact of ice ava-lanches. Those flows are made of ice blocks with a density (917 kg m-3) that is much higher than the density of snow aggregates in snow avalanches (250-500 kg m-3, typically). Also, it is worthy to note that we use here the 1D depth-averaged model. The overarching aim of the present study was to conduct many preliminary simulations using the 1DSV model, as already done for the
back-calculation of the Altels ice-avalanche. This is much less time-consuming and thus allows investigating a larger number of scenarios in terms of rheological properties of the flowing material. Simulations with the 2DSV model are under preparation and will be the topic of a future paper.
Figure 3: DTM used and main altitudinal profiles consid-ered for the 1DSV simulations. Z2 and Z3 are the 2 de-parture zones where the glacier bedrock is expected to reach the melting point around 2080 under RCP6.0. Ele-vation contour lines have 25 m interval.
4.2 Examples of 1D SV simulations
This section presents some examples of simulation results. The profiles along the slope of maximum flow height and maximum velocity for two scenarios in terms of the rheological parameters of the Voellmy law are considered. The dynamics of a large ice avalanche (=0.1; =5000m s-2
) is com-pared to the dynamics of a more common snow avalanche (=0.3; =1000m s-2
), as depicted in Figure 4. While both the maximum height and veloc-ity are very similar in the upper part of the ava-lanche track (the dynamics being controlled by the dam-break release mechanics), the velocity starts to be largely influenced by the values of and once the flow has developed. The extreme values of and for the large ice avalanche scenario produce much higher velocities all along the track. The large ice avalanche is able to reach a maximum velocity
of 120m s-1 and its velocity is still 100m s-1 at the location of the current catching dam (we remind here that these 1D simulations were performed without any defense structures). This is in strong contrast with the more common snow avalanche scenario (=0.3; =1000 m s-2
), leading to a maxi-mum velocity of about 60 m s-1. Note that for this snow avalanche scenario the 1DSV model predicts that such an avalanche would stop before the loca-tion of the currently-built catching dam. A number of other scenarios were simulated and a brief sum-mary of the results is provided in Sec. 4.3.
Figure 4: profiles along the slope (example for the profile Z2p3) of maximum flow height (top) and velocity (bottom) for two scenarios: a large ice avalanche (blue) versus a common snow avalanche (magenta).
4.3 Expected scenarios for ice avalanches
In this section, we present the predictions of the 1DSV simulations made considering the maximum velocity reached at the location of the currently-built snow avalanche protection dam, without consider-ing any defense structures in the run-out zone (see Sec. 4.1 for the DTM used for the calculations). The results are presented in Figure 5 for one single profile (Z2p3) considering a relatively wide spectrum of the rheological parameters (from 0.1 to 0.5) and (from 1000 to 5000 m s-2
). This approach allows us to highlight the major differences between three scenarios: (i) large ice avalanches based on the ice-volume scenario described in Sec. 2 and back-calculated and values for the Altels glacier-collapse, (ii) very large snow avalanches and (iii) more common snow avalanches. The 1DSV calcu-lations done in the present study show that the
max-imum velocity of ice avalanches, at the location of the currently-build avalanche dam, can reach 100 m s-1. Note that those calculations are consistent with the back-calculations recently made by Kääb et al. (2018) on major ice avalanches observed in West-ern Tibet.
Figure 5: maximum velocity reached at the currently-built snow avalanche dam as a function of for three values of . Results are shown for the profile Z2p3.
4.4 Dam-break versus snow avalanche-like
release
Depending on the initial geometrical conditions of the glacier, and on the ice and substratum proper-ties in the release area, the collapse of the glacier and its transformation into a granular avalanche made of ice blocks is expected to be more or less rapid over time. The physics of such a process is complicated and still remains far from being mod-eled in detail. Using the present approach based on a depth-averaged continuum model with constant rheological parameters during the solid-to-fluid tran-sition may be questionable. In order to partly deci-pher that complicated question, the ratio of the typi-cal height H of the volume initially released to its typical length L was varied over a wide range from the high values measured at the Taconnaz glacier (H/L about 0.5-1) to much lower values that are more typical of avalanche-like release conditions (H/L equal to 10-2 -10-3). Note that the depth-averaged numerical code used in the present study fully resolves the pair of oppositely propagating rarefaction wave and dispersive shock wave occur-ring duoccur-ring a dam-break release, so that initial re-lease conditions with a H/L close to unity can be modelled.
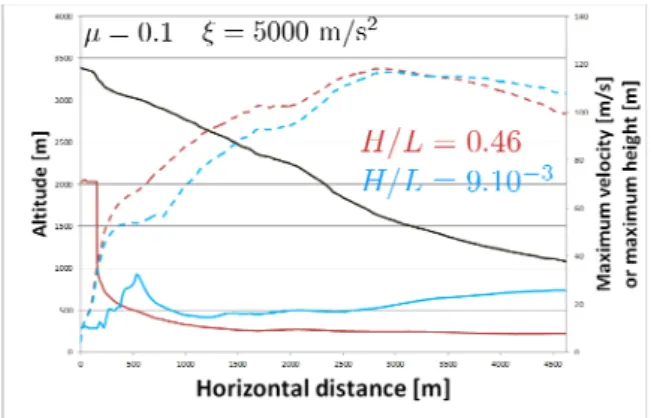
Figure 6 depicts two examples of maximum velocity and height profiles along the slope for H/L=9.10-3 and H/L=0.46. The latter corresponds to the typical ratio measured at Taconnaz glacier (on profile Z2p3): H=71 m and L=155 m. The former corre-sponds to the same volume of ice but distributed on a much larger distance considering a typical height of 10 m. The maximum velocity profile along the slope is weakly influenced by H/L. In contrast, the maximum height is sensitive to varying H/L. The
Large ice avalanches
Large snow avalanches
Common snow avalanches
simulated ice avalanche with a snow-avalanche release condition (small H/L) is much thicker in the run-out zone whereas the ice avalanche with a dam-break release (H/L1) produces a much more rapid and thinner flows in the run-out zone thus capable of propagating further downstream.
Figure 6: profiles along the slope (profile Z2p3) of maxi-mum flow height (continuous line) and velocity (dashed lines) of large ice avalanches for two scenarios of H/L. 5. DISCUSSION AND CONCLUSION
In the present study, simulations were performed with a depth-averaged model supplemented with Voellmy’s rheology. The back-analysis of Altels avalanche provides Voellmy’s friction coefficients revealing very low friction processes for this ice-avalanche. Studying Taconnaz avalanche scenarios with these extreme coefficients results in finding very high velocities for ice-avalanches (100m s-1) at the location of the current defense structure (note that we used a terrain model without the currently-built defense structure). Analyzing release condi-tions, the glacier thickness in the departure zone does not affect too much the velocity along the ava-lanche track, but rather controls the flow thickness. Thick glaciers collapse in much more rapid and thinner flows in the run-out zone, thus capable of propagating further downstream. Our preliminary findings show that the risk induced by this glacier hazard is high for the populated region below and makes the understanding of such avalanches a priority. The present series of preliminary simula-tions will help in preparing further 2DSV simulasimula-tions and investigating in more details the mass spread-ing in the run-out zone considerspread-ing the most appro-priate scenario in terms of closure relations and input conditions (2D effects such as location and shape of the initial ice volume, the friction law and the associated rheological parameters).
REFERENCES
Alean, J., 1985. Ice avalanches: Some empirical information about their formation and reach, J. Glaciol., 31(109), 324–333.
Ancey, C., 2005. Monte Carlo calibration of avalanches described as Coulomb fluid flows. Philosophical Transactions of the Royal Society of London, 363, 1529-1550.
Cuffey, K., and W. B. S. Paterson, 2010. The Physics of Glaciers, 4th ed., Academic Press, Amsterdam.
Du Pasquier, L., 1896. L’avalanche du glacier de l’Altels le 11 septembre 1895. Ann. Geophys., 5(23), 458–468.
Evans, S., O. Tutubalina, V. Drabyshev, S. Chernomorets, S. McDougall, D. Petrakov, and O. Hungr, 2009. Catastrophic detachment and high-velocity long-run out flow of Kolka glacier, Caucasus mountains, Rus-sia in 2002, Geomorphology, 105, 314–321, doi:10.1016/j.geomorph.2008.10.008.
Faillettaz, J., D. Sornette, and M. Funk, 2011. Numerical modeling of a gravity-driven instability of a cold hanging glacier: Reanalysis of the 1895 break-off of Altelsgletscher, Switzerland, J. Glaciol., 57(205), 817–831.
Faillettaz, J., M. Funk, and C. Vincent, 2015. Avalanching glacier instabili-ties: Review on processes and early warning perspectives, Rev. Ge-ophys., 53, 203–224, doi:10.1002/2014RG000466.
Forel, F.-A. 1895. L’´eboulement du Glacier de l’Altels. Arch. Sci. Phys. Natur. [Genève], 34, 513–543.
Gilbert, A., P. Wagnon, C. Vincent, P. Ginot, and M. Funk, 2010. Atmos-pheric warming at a high elevation tropical site revealed by englacial temperatures at Illimani, Bolivia (6340 m above sea level, 16°S, 67°W), J. Geophys. Res., 115, D10109, doi:10.1029/2009JD012961. Gilbert, A., O. Gagliardini, C. Vincent, and P. Wagnon, 2014. A 3-D
ther-mal regime model suitable for cold accumulation zones of polytherther-mal mountain glaciers, J. Geophys. Res. Earth Surf., 119, 1876–1893, doi:10.1002/2014JF003199.
Gilbert, A., C. Vincent, O. Gagliardini, J. Krug, and E. Berthier, 2015. Assessment of thermal change in cold avalanching glaciers in relation to climate warming, Geophys. Res. Lett., 42, doi:10.1002/ 2015GL064838.
Haeberli, W., M. Wegmann, and D. Vonder Muehll, 1997. Slope stability problems related to glacier shrinkage and permafrost degradation in the Alps, Eclogae Geol. Helv., 90, 407–414.
Heim, A. 1895. Die Gletscherlawine an der Altels am 11 September 1895. In Neujahrsblatt der Z¨ urcherischen Naturforschenden Gesellschaft auf das Jahr 1896. Z¨urich, Z¨ urcher & Furrer.
Heinrich, P., A. Piatanesi, and H. Hebert, 2001. Numerical modelling of tsunami generation and propagation from submarine slumps: the 1998 Papua New Guinea event. Geophysical Journal International 145, 97-111.
Huggel, C., 2008. Recent extreme slope failures in glacial environments: Effects of thermal perturbation, Quat. Sci. Rev., 28(11–12), 1119– 1130, doi:10.1016/j.quascirev.2008.06.007.
Hungr, O., 1995. A model for the runout analysis of rapid flow slides, debris flows, and avalanches. Canadian Geotechnical Journal, 32(4), 610-623.
Iverson, R., 1997. The physics of debris flows. Reviews of Geophysics 35, 245-296.
Kääb, A. and others, 2018. Massive collapse of two glaciers in western Tibet in 2016 after surge-like instability. Nature Geosciences, 11, 114-120.
Laigle, D. and P. Coussot, 1997. Numerical modelling of mudflows. Jour-nal of Hydraulic Engineering - ASCE 123, 617-623.
Lliboutry, L., 1975. La catastrophe du Yungay (Perou), in Proceedings of the Snow and Ice Symposium, pp. 353–363, Moscow, August 1971. Margreth S., J. Faillettaz, M. Funk, M. Vagliasindi, F. Diotri, M. Broccolato,
2011. Safety concept for hazards caused by ice avalanches from the Whymper hanging glacier in the Mont Blanc Massif. Cold Region Sci-ence and Technology 69, 194-201.
Naaim, M., F. Naaim-Bouvet, T. Faug, and A. Bouchet (2004). Dense snow avalanche modeling: flow, erosion, deposition and obstacle ef-fects. Cold Regions Science and Technology, 39(2/3), 193-204. Naaim, M., T. Faug, F. Naaim-Bouvet, and N. Eckert, 2010. Return period
calculation and passive structure design at the Taconnaz avalanche path (France), Annals of Glaciology, 51 (54), 89-97.
Naaim, M., S. Vial, and R. Couture (1997). St Venant Approach for Rock Avalanches Modelling, in Multiple Scale Analyses Coupled Phys. Syst.: Saint Venant Symp. Paris (Presse Ecole Nationale des Ponts et Chaussées).
Poisel, R., A. Preh, and Hungr, O., 2008. Run Out of Landslides – Contin-uum Mechanics versus DiscontinContin-uum Mechanics Models. Geo-mechanik Tunnelbau, 1: 358-366.
Pralong, A., and M. Funk, 2006. On the instability of avalanching glaciers, J. Glaciol., 52(176), 31–48, doi:10.3189/172756506781828980. Roth, F., 2016. Simulation der Altels-Eislawine 1895 mit
RAMMS::AVALANCHE. Projektarbeit im Rahmen des Masterstudi-ums der Umweltingenieurwissenschaften an der ETH Zurich. 50p. Vincent, C., E. Le Meur, D. Six, P. Possenti, E. Lefebvre, and M. Funk,
2007. Climate warming revealed by englacial temperatures at Col du Dôme (4250 m, Mont-Blanc area), Geophys. Res. Lett., 34, L16502, doi:10.1029/2007GL029933.
Vincent, C., E. Thibert, M. Harter, A. Soruco, and A. Gilbert, 2014. Volume and frequency of ice avalanches from the Taconnaz hanging glacier (French Alps), Ann. Glaciol., 56(70), 17–25, doi:10.3189/2015AoG70A017.