HAL Id: hal-01521082
https://hal.sorbonne-universite.fr/hal-01521082
Submitted on 11 May 2017
HAL is a multi-disciplinary open access
archive for the deposit and dissemination of sci-entific research documents, whether they are pub-lished or not. The documents may come from teaching and research institutions in France or abroad, or from public or private research centers.
L’archive ouverte pluridisciplinaire HAL, est destinée au dépôt et à la diffusion de documents scientifiques de niveau recherche, publiés ou non, émanant des établissements d’enseignement et de recherche français ou étrangers, des laboratoires publics ou privés.
Micellization of dodecyltrimethylammonium bromide in
water–dimethylsulfoxide mixtures: A multi-length scale
approach in a model system
Véronique Peyre, Sabah Bouguerra, Fabienne Testard
To cite this version:
Véronique Peyre, Sabah Bouguerra, Fabienne Testard. Micellization of dodecyltrimethylammonium bromide in water–dimethylsulfoxide mixtures: A multi-length scale approach in a model system. Jour-nal of Colloid and Interface Science, Elsevier, 2013, 389 (1), pp.164-174. �10.1016/j.jcis.2012.08.014�. �hal-01521082�
Micellization of dodecyltrimethylammonium bromide in
water-dimethylsulfoxide mixtures: a multi-length scale
approach in a model system
Véronique PEYRE1,*, Sabah BOUGUERRA2, Fabienne TESTARD3
1
Université Pierre et Marie Curie-Paris6, UMR7195 (PECSA), Paris, F-75005 France; ENSCP, UMR7575, Paris, F-75005 France;
CNRS, UMR7575, Paris, F-75005 France
2
Laboratoire de Physico-Chimie des microstructures et microsystèmes .I.P.E.S.T- La Marsa-University of Carthage-Tunisia
3
CEA, DSM/IRAMIS/SIS2M/Laboratoire Interdisciplinaire sur l'Organisation Nanométrique et Supramoléculaire, UMR 3299, Saclay, F-91191 Gif-sur-Yvette, France
*Corresponding author. Address: Université Pierre et Marie Curie-Paris6, UMR7195, case courrier 51, 4, place Jussieu, 75252 PARIS Cedex 05, FRANCE; Email: veronique.peyre@upmc.fr
ABSTRACT:
The micellization in mixed solvent was studied using conductimetry, density measurements (molar volumes) and small angle neutron scattering (SANS) to explore dodecyltrimethylammonium bromide (DTABr) micelle formation throughout the entire composition range of water-dimethylsulfoxide (DMSO) mixtures. As the concentration of DMSO was increased in the mixture, the critical micelle concentration (CMC) increased, the aggregation number decreased and the ionization degree increased, until no aggregates could be detected any more for DMSO molar fraction higher than 0.51. The results were consistent with the presence of globular micelles interacting via a coulombic potential. The experimental CMC values and aggregation numbers were successfully reconciled with a molecular thermodynamic model describing the micellization process in solvent mixtures (Nagarajan et al., Langmuir, 16;5242, 2000). The structural and thermodynamic characterization of the micelles agreed with the prediction of a dissymmetric solvation of the surfactant entity: the hydrocarbon chain was surrounded only by DMSO while the polar head was surrounded only by water. The decrease of the ionization degree was due to the condensation of the counterions and was definitely linked to the geometrical characteristics of the aggregates and by no means to the CMC or salinity. This multi-technique study provides new insight into the role of solvation in micellization and the reason for the decrease in ionization degree, emphasizing the dissymmetric solvation of the chain by DMSO and the head by water. This is the first time that, for a given surfactant in solvent mixtures, micellization is described using combined analysis from molecular to macroscopic scale.
KEYWORDS: dodecyltrimethylammonium bromide, water-DMSO mixtures, micellization, SANS, conductimetry, molar volume, solvation
INTRODUCTION
The existence of micelles in organic or hydro-organic solvents has drawn considerable attention over the past decades [1-26] for their fundamental and industrial applications, and there is still much interest in the nature of the micellization mechanism in polar organic solvent and their aqueous mixtures. In the delicate balance of forces that rules micellization, a solvent’s capability to enable micellization is said to relies on its cohesive energy density, which encompasses all of the solvent’s intermolecular forces (comprising H-bonds) [25]. It is remarkable that this parameter be sufficient and does not request any information on the surfactants specificity. For instance, in the case of ionic surfactants, the electrostatic interactions between surfactants heads indeed plays a particularly important role in the formation of the aggregates. We address the question of the solvent key parameter for micellization by studying a cationic surfactant in water-DMSO mixtures. Continuously changing the solvent’s quality by mixing two solvents with different properties provides an opportunity to finely explore the dependence of the micellization mechanism upon the surrounding medium. Moreover, many properties of water-DMSO mixtures present an extremum at the molar fraction xDMSO = 0.33, but the existence of an
extremum of micellization for the same solvent composition is not obvious.
Among the aprotic solvents able to promote micellization, DMSO is indeed controversial. DMSO is a polar solvent completely miscible with water and water-DMSO mixtures have been studied extensively, from experimental points of view (e.g., dielectric constants, viscosity, surface tension, partial molar volumes, densities, heat capacities, etc.) and theoretically [27-34]. The molar fraction of DMSO, xDMSO
= 0.33 was found to be a threshold for many properties such as viscosity, excess enthalpy of mixing, and the chemical shift of protons[31], due to the formation of the complex containing 1 DMSO : 2 H2O[30].
By varying the composition of water-DMSO mixtures, the solutions range between a highly structured solvent with many H-bonds (water), to a solvent with no H-bonds (DMSO). Micellization has been studied in such mixtures and the composition xDMSO = 0.33 was also found to be a limit after which no
most common, cannot report of the various aspects of micellization and can only render a partial view of the phenomenon. The question is thus still open whether micellization also presents an extremum or a threshold at this DMSO composition. For this purpose, we established a set of data about the micellization of dodecyltrimethylammonium bromide (DTABr), using several complementary techniques to provide a description of the micelles from several points of views.
Although DTABr has been well characterized in water by various techniques including surface tension, X-rays, conductivity[35,36], small angle neutron scattering (SANS) [37-39], light scattering [40] or combinations of several techniques[35,41], little is known about its behavior in a mixed solvent, since homologues of DTABr with longer chains are studied more frequently. The scope of this study was first to link the main parameters of the micelles (i.e., critical micelle concentration [CMC], aggregation number and ionization degree) to the relevant solvent characteristics (i.e., cohesive energy density, surface tension and dielectric constant) and secondly, to determine some of the details of the micellization process at the molecular level and describe the solvation phenomenon in water-DMSO mixtures having compositions below and above xDMSO = 0.33. The onset of micelle formation was
determined by conductimetry and volumetry, whereas the size and effective charge of the micelles were obtained from SANS. Molecular thermodynamics according to the model proposed by Nagarajan et al.[23] was used to calculate the CMC and clarify the forces driving micellization. This model is widely cited but seldom tested and, to our knowledge, it has not been validated on solvents other than alcohols mixed with water (e.g., ethyleneglycol[23] and ethanol[24]). In parallel, the changes of the DTABr environment were explored through density measurements, which allowed us to determine partial molar volume values and provided insight to the molecular organization of the DTABr environment. This multi-view approach at different length scales rendered valuable information that ultimately improved our understanding of the solvent effects on the self-assembly of amphiphilic compounds.
DTABr obtained from Acros Organics was recrystallized twice from acetone-ether before use. DMSO obtained from SDS-Carlo Erba was distilled under vacuum and used rapidly afterward. Tetraethylammonium bromide was obtained from Janssen Chimica and used as received. Water was ultrapure quality (18 MΩ-cm).
Solvents (i.e., mixtures of water and DMSO) were prepared by first adding the desired amount of DMSO to a volumetric flask. Almost all the necessary amount of water was added immediately and the flask was left at room temperature for 24 hours before adjusting the final volume with water. Since the mixture of DMSO and water is exothermic, this procedure allowed spontaneous degassing, cooling down and changes in the volume of the solution to take place before the final solution was obtained. The solvents named y v% DMSO thus contained a volume y of pure DMSO mixed with water in a total volume of 100. The notation xDMSO stands for the final DMSO molar fraction. All DTABr solutions in
the solvents were formulated by weight and, if needed, the concentrations were calculated by their densities.
Conductimetry
Conductimetry measurements were made at 298.0 ± 0.1 K, with a Philips PM6303 conductimeter operating at 1000 Hz and calibrated with KCl. Aliquots of DTABr stock solutions (between 0.4 and 0.6 mol kg−1) in the solvent were added to a sample volume of the same solvent, and the conductance was recorded after the signal stabilized (2−5 min). In the solvent of composition xDMSO = 0.50, the stock
solution was 0.21 mol kg−1 to avoid crystallization of DTABr at higher concentrations. The curves were drawn in two runs: one in which the stock solution samples were diluted by adding solvent and the other in which the stock solution samples were added to samples of solvent.
Densities and molecular volume determination
density values was ± (5 × 10⁻⁶) kg dm−3. For calibration, the density of pure water at 298.15 K was taken as 0.997043 kg dm−3.
The apparent molar volumes Vapp for DTABr in different solvents were calculated from the experimental density values of solutions using the following equation[42]:
(1)
where m is the molality of a solution of DTABr in the solvent, M the molecular weight of DTABr, and ρ and ρ° are the densities of the solution and the solvent, respectively.
Phase diagram
The transitions between a clear solution and a precipitate were determined by visual inspection of the DTABr solutions in water-DMSO mixtures. To avoid supersaturation effects, all samples were first placed at 277 K until crystals formed. They were then left at ambient temperature (~295 K) for one week before being analyzed. The whole procedure was repeated twice on the same samples.
Small angle neutron scattering (SANS)
We used D2O and deuterated DMSO to enhance the scattering contrast of the micelles/solvent and to
minimize the incoherent hydrogen background. Experiments were performed at the Laboratoire Léon Brillouin (LLB), Saclay (France) using the PAXE spectrometer of the Orphée reactor. Quartz optical cells with a 1 mm path length were mounted on a thermostated brass block at a temperature of 298 ± 0.5 K. The overall angular range (0.011 < q (Å-1) < 0.46) was accessed with three configurations: λ = 4.5 Å, D = 105 cm; λ = 6 Å, D = 254.7 cm; and λ =10 Å, D = 505 cm. The acquisition time was between 30 and 60 minutes for each sample, depending on the configuration used. Neutron detection and counting was achieved with a built-in two-dimensional sensitive detector composed of 64 × 64 cells. Standard LLB data treatments were used for radial averaging and correction for the empty cells and electronic
ρ + ° ρ − ρ = M m Vapp 1 1 1
The samples were prepared by weight and the concentrations are listed in Table 1. For the solvents containing the higher DMSO concentrations, the DTABr concentrations were chosen to avoid precipitation (see phase diagram section).
solvent composition (xDMSO d6) 0 0.14 0.26 0.37 0.51 0.67 ρN (cm-2) 6.34 × 10¹⁰ 5.92 × 10¹⁰ 5.72 × 10¹⁰ 5.60 × 10¹⁰ 5.50 × 10¹⁰ 5.40 × 10¹⁰ ε 78 76 72 69 63 57
[DTABr]tot (mol L−1) 0.46 0.50 0.51 0.28 0.20 0.22
Table 1: Scattering length densities ρΝ (see text) and dielectric constants ε (from [32]) of the solvents
used for SANS. [DTABr]tot is the total concentration of DTABr used for SANS in the corresponding
solvent.
Model for the adjustment of SANS spectra.
For the micelle model, we used anisotropic particles with an ellipsoid shape, interacting with a spherical potential. Using the decoupling approximation, the absolute intensity scattered by a solution of such interacting objects can be written as [43,44]:
(2)
where q is the scattering vector, Cmicelles is the concentration of micelles, is the contrast between
the objects and the solvent, V is the volume of one micelle, f(q) is the amplitude of the form factor and S(q) is the structure factor. Assuming monodispersed ellipsoidal particles, the bars represent the average on the solid angle between the anisotropic particle and the q vector. For the particles concerned in this study (i.e., only with a small anisotropy), it was assumed that the interactions were independent of
(
)
[
( ) ( ) ( ) 1)]
) ( ) ( = ∆ 2 2 2 + 2 − q S q f q f V C q I micelles ρN N ρ ∆particle orientation and dependent only on the average size of the particles. The interactions are described using a hard sphere potential of radius R and a classical DLVO repulsive part (equation (3)). v(r) = +∝ r < 2R
r > 2R
(3)
where Zeff is the effective charge of the micelle, LB is the Bjerrum length, κ = (8 πLBI)1/2 is the screening
constant, which is related to the ionic strength I = NA (CMC + 1/2 Cmicelles Zeff ), in the absence of added
salt, and NA is the Avogadro number.
Using the above potential, the pair correlation function g(r) and then the structure factor are calculated by iterative resolution, using the Ornstein-Zernike (OZ) equation with the hypernetted chains (HNC) equation[45]. For the systems interacting via long-range electrostatic potentials, the HNC closure relation is valid and requires no further refinements. We used a program kindly provided by Luc Belloni to calculate the scattered intensities; details are reported as Supplementary Material.
Fitting procedure
The adjustable parameters of the model are: R (the radius of the interacting spheres); Zeff (the
effective charge of the micelle); Cmicelles (the concentration of micelles); and R1 (the semi-biaxis of the
ellipsoid). The ionic strength I is calculated as described for equation 3, and the semi-monoaxis R2 of the
ellipsoid is imposed so that the volumes of the ellipsoid (4π/3 R12R2) and of the interacting spheres (4π/3
R3) are equal. HNC calculations are the results of an iterative convergence that makes difficult the use of the weighed nonlinear least-squares fit of the spectra[41].
Scattering length densities
We chose a simple model with two scattering length densities, one for the micelle and one for the solvent. This model is valid in the case of DTABr in water[37]. Assuming the condensation fraction of
2 B 2 eff ) R 1 ( )] R 2 r ( exp[ r L Z kT κ + − κ − =
Br− onto the micelles (1-β) is known by the conductivity experiments, one can calculate the mean scattering density ρN of a micelle as:
(4)
with bDTA and bBr the scattering lengths of the DTA+ cations and the Br− anions, respectively, and VDTA
and VBr their respective volumes. The mean value[46] of 31 cm3 mol−1 was used as the volume for Br−
throughout the entire solvent composition range. The volume of DTA+ was deduced by subtracting this value from that of the DTABr salt[47] (Vmic = 295 cm3 mol−1). The scattering lengths for each atom were
obtained from ref. [48]. The scattering length density of the micelles was virtually constant over the DMSO range studied and was −0.28 × 1010 cm−2. The scattering length densities ρN for the water-DMSO
solvents are reported in Table 1.
Determination of the aggregation number Nag and micellar ionization degree β The aggregation numbers can be determined in two ways:
Nag = V / Vmono
or Nag = (Ctot−CMC) / Cmicelle
(5a)
(5b)
with the volume of the micelle V = 4π/3 R3
and Ctot the total concentration of surfactant monomers. The
first equation relies on a correct value for the volume of the monomer in the scattering micelle, Vmono.
We took the volume of DTA+, with the condensed counter-ion:
Vmono = VDTA + (1-β)VBr (6)
The second equation is largely dependent on the determination of Ctot−CMC (the concentration of
monomers involved in micelles). In the same manner, the micellar ionization degree β = Zeff / Nag can be
calculated using (5a) or (5b) for Nag.
Br DTA Br DTA N V ) 1 ( V b ) 1 ( b β − + β − + = ρ
RESULTS
Conductimetry
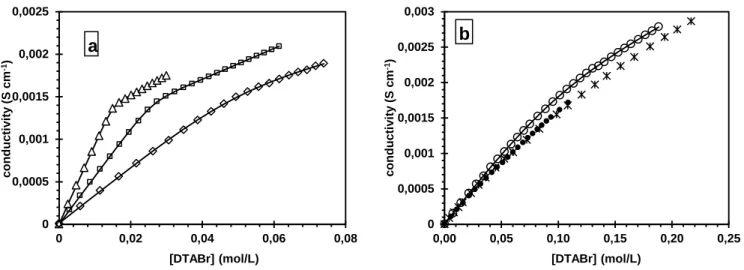
The conductivity curves for DMSO molar fractions of 0, 0.06, 0.14, 0.26, 0.35, and 0.50 are shown in Figure 1. Except for the compositions xDMSO = 0.35 and 0.50, the conductivity curves consisted
of three domains: two straight parts joined by a curved transition. As the concentration of DMSO increased, the curved junction became larger. This result indicated micellization occurred over a range of DTABr concentrations rather that at an abrupt threshold. The CMC is classically taken as the intersection of the two straight portions of the curve. However, the treatment for conductivity data of surfactants proposed by Carpena et al[49] allows the CMC to be determined more precisely. The conductivity Κ vs concentration C is modeled with:
° − + ° − + − + + = d / C e d / ) C C ( e ln ) A A ( d C A ) ( K ) C ( K 1 1 0 1 2 1 (7)
K(0) is the conductivity of the pure solvent, A1 and A2 are the slopes of the limiting straight lines
linked by a transition whose position is controlled by C° and whose width is d. The CMC is taken as C°. The values for A1 and A2, C° and d are reported in Table 2. The conductivities in xDMSO = 0.35 and 0.50
could not be fitted to this model and we only report the initial slope A1 of the curve. The conductivity of
DTABr was compared to the conductivity of a classical electrolyte with similar structure and no micellization properties (tetraethyl ammonium bromide, Et4NBr) (Supplementary Material). Since
DTABr and Et4NBr exhibited similar non-linear conductivity responses, we concluded that no CMC
existed for DTABr at xDMSO = 0.35 and 0.50.
The decrease of the initial slope A1 with the increase of DMSO content in the solvent might be
due to enhanced ion pairing of DTABr in the mixed solvent or to an increase in the viscosity of the solvent. We verified that the plot of A1 vs the reciprocal of the solvent viscosity 1/η [34] describes a
A1 (S cm2 mol−1) = 88 ×1/η − 5.6 with R2 = 0.9944 (8)
where R2 is the determination coefficient (figure SM-3 in Supplementary Material). The linearity confirms that the decrease in molar conductivity due to the addition of DMSO is indeed attributable to viscosity only and that the addition of DMSO in the solvent does not favor ion pairing. In this case, though the exact thermodynamic treatment of these conductivity data is not obvious[50], the ionization degree β remaining on the micelle after counterion condensation can be approximated as A2/A1 (Table
2).
Figure 1: Conductivity data at 298 K (a) ∆: water; : xDMSO = 0.06 (20v%); ◊: xDMSO =0.14 (40v%); (b)
O: xDMSO = 0.26 (60v%); : xDMSO = 0.35 (70v%); *: xDMSO = 0.50 (80v%). The straight lines
correspond to the fit with equation (7) and the parameters listed in Table 2.
Using the conductivity data (CMC and β), and supposing large aggregation numbers, the molar free enthalpy of micellization, ∆Gmic, was calculated according to the following equation [51]:
∆Gmic= (2−β) RT ln CMC (9)
where the CMC is expressed as a molar fraction (Table 2). The CMC slightly increases as the fraction of DMSO increases (∆Gmic increases), while aggregation occurs more gradually: the width of the transition,
d, increases to a greater extent than the CMC increase (Table 2). The ionization degree β also increases
0 0,0005 0,001 0,0015 0,002 0,0025 0 0,02 0,04 0,06 0,08 co n d u ct ivi ty ( S cm -1) [DTABr] (mol/L) a 0 0,0005 0,001 0,0015 0,002 0,0025 0,003 0,00 0,05 0,10 0,15 0,20 0,25 co n d u ct ivi ty ( S cm -1) [DTABr] (mol/L) b
xDMSO [v%] water 0.03 [10] 0.06 [20] 0.10 [30] 0.14 [40] 0.19 [50] 0.26 [60] 0.35 [70] 0.50 [80] A1 (S cm 2 mol−1) 93±3 56 ±1 33 ±0.5 21±0.5 18 18 A2 (S cm2 mol−1) 23±2 18±1 11 ±3 9.0 ±1 C° =CMC (mol L−1) (1.5±0.1) × 10−2 (2.6±0.1) × 10−2 (4.8±0.5) × 10−2 (9.1±0.5) × 10−2 d (mol L−1) (9±5) × 10−4 (2.5±1) × 10−3 (10±1) × 10−3 (3±1) × 10−2 β = A2 / A1 0.25 0.32 0.34 0.43 ∆Gmic (kJ mol -1 ) −36 −31 −28 −23 CΦ = CMC (mol L−1) 1.6 × 10⁻² 2.0 × 10⁻² 2.6 × 10⁻² 3.4 × 10⁻² 3.9 × 10⁻² 5.4 × 10⁻² 6.7 ×10⁻²
Table 2: A1, A2, C°, d: fitting values for conductivity (equation (7).A1 values in xDMSO = 0.35 and 0.50
are the initial slopes. ∆Gmic: free enthalpy of micellization. CΦ: CMC from the molar volumes. The
compositions of the solvents are given as molar fractions and in v%.
Phase diagram
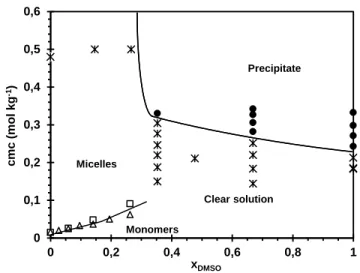
Figure 2: CMC and precipitation vs composition of the solvent. □: CMC by conductimetry. ∆: CMC from density measurements (molar volumes) •: solid samples. *: clear, liquid samples. The solid lines are guides that indicate trends. Micelles are assigned on the basis of SANS data.
0 0,1 0,2 0,3 0,4 0,5 0,6 0 0,2 0,4 0,6 0,8 1 cm c (m o l kg -1) xDMSO Micelles Monomers Clear solution Precipitate
The Krafft temperature of DTABr in water-DMSO mixed solvent is above the ambient temperature (~295 K) for the highest concentrations of DMSO (xDMSO > 0.366 [14]). We determined the
physical state of a series of samples, as observed by eye at ambient temperature (Figure 2).
Molar volumes
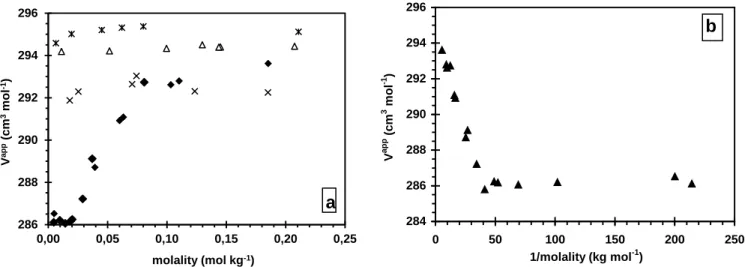
We next explored the solvation during the micellization process through molar volumes (Figure 3). Two different behaviors were observed that depended on the solvent composition. For solvents with compositions lower than xDMSO = 0.35 (70v%), two volumes (VCMC and Vmic) and a CMC can be
determined. The plot of the apparent molar volume of DTABr vs. molality displays a classical shape for ionic surfactants[42] as exemplified by the solvent xDMSO = 0.06 (20v%) (Figure 3a). At concentrations
below the CMC, DTABr behaved like a 1:1 electrolyte and Vapp (the apparent molar volume of the monomeric form) remained virtually constant. The departure from this plateau indicates the CMC (CMC = 0.025 mol kg−1 for xDMSO = 0.06 in Figure 3a). At concentrations above the CMC, Vapp is a
combination of the volumes of the monomeric and micellar forms of the surfactant in solution. If we consider that the concentration of the monomeric form is equal to the CMC, Vapp is given by:
mic mic CMC ) m ( app V m ) V V ( CMC V = × − 1 + (10)
where CMC(m) is the critical micelle concentration expressed in molality, VCMC is the apparent
molar volume of free surfactant (monomer) at the CMC and Vmic is the apparent molar volume of
micellized monomers.
The plot of Vapp vs. 1/m is shown in Figure 3b for xDMSO = 0.06 and in the Supplementary
Material for the other solvent compositions (figures SM-4 and SM-5). At high 1/m values, only monomers are present in the solution and, within experimental error (around ± 0.5 cm3 mol−1), Vapp is independent of 1/m. We can thus take VCMC to be the mean value of Vapp at DTABr concentrations
below the CMC (VCMC = 286 ± 0.5 cm3 mol−1 for the solvent xDMSO = 0.06). At low 1/m values, the
of the total concentration in the studied range of concentration. The CMC may be determined from Figure 3b by the intercept between the two lines. These CMC values are shown in Figure 2 and listed in Table 2 (CΦ, after conversion of molalities in molarities). They are in good agreement with the values obtained by conductimetry.
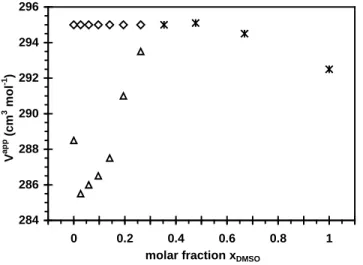
Figure 3: Apparent molar volumes Vapp vs. molality of DTABr in water-DMSO mixtures. T =298.0 K. (a) ♦: xDMSO = 0.06 (20v%); *: xDMSO = 0.50 (80v%); ∆: xDMSO = 0.67 (90v%); ×: xDMSO = 1. (b)
Apparent molar volume of solutions Vapp vs. reciprocal of molality in water-DMSO mixtures (xDMSO =
0.06 (20v%).
At higher DMSO contents (xDMSO > 0.35), the Vapp = f(m) plot is a constant for DTABr
concentrations between 0 and 0.20 mol kg−1 (Figure 3a). The volumes of the monomeric form VCMC and
the micellar form Vmic are shown in Figure 4 for conditions in which they can be determined separately
(xDMSO < 0.35). The unique volume V determined afterwards (for xDMSO > 0.35) is shown on the same
figure. The numerical values of VCMC and Vmic, are provided in the Supplementary Material. The
surfactant volume in the micelle Vmic is independent of the DMSO content (295.0 cm3 mol−1). As the
DMSO content increases in the solvent, the monomeric volume first decreases from 288.5 to 285.5 cm3 mol−1 and then increases to the micellar volume at xDMSO ≈ 0.35. It then remains constant up to xDMSO ≈
3 −1 286 288 290 292 294 296 0,00 0,05 0,10 0,15 0,20 0,25 V ap p (c m 3 m ol -1) molality (mol kg-1) a 284 286 288 290 292 294 296 0 50 100 150 200 250 1/molality (kg mol-1) V a p p (c m 3 m ol -1 ) b
Figure 4: (∆) Apparent molar volumes in the monomeric form at the CMC VCMC and (◊) in the micellar
phase Vmic for conditions in which they can be determined separately. (*) indicate an equal value of V
for monomeric or micellar species throughout the molality range of DTABr. T = 298.0 K.
SANS:
Micelles in D2O and H2O may have slightly different properties depending on the number of
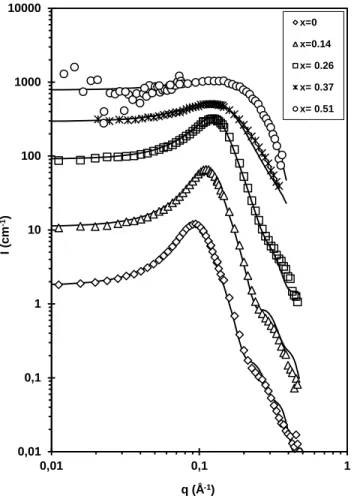
carbon atoms in the chain. However, DTABr behaves nearly the same in either fluid[38]. We assumed that this would also be true if hydrogenated DMSO was replaced by deuterated DMSO, and that the micelles characterized by SANS would be very similar to those characterized by other techniques in hydrogenated solvents. The SANS spectra are displayed in Figure 5 along with the fits. The spectrum in the solvent xDMSO = 0.67 (90v%) with a DTABr molality 0.20 mol kg−1 is not shown as it was a constant
at I = 0.13 cm−1 above the solvent intensity. The parameters used for the fits of the other spectra are detailed in Table 3. The sample in xDMSO = 0.51 contained a very small amount of scattering objects. The
surfactant concentration in this solvent could not be increased due to precipitation. For this reason, the overall signal was weak and a very precise fit could not be achieved. However, the presence of small charged objects was clearly evident.
284 286 288 290 292 294 296 -0.1 0 0.1 0.2 0.3 0.4 0.5 0.6 0.7 0.8 0.9 1 1.1
molar fraction xDMSO
V a p p (c m 3 m ol -1 )
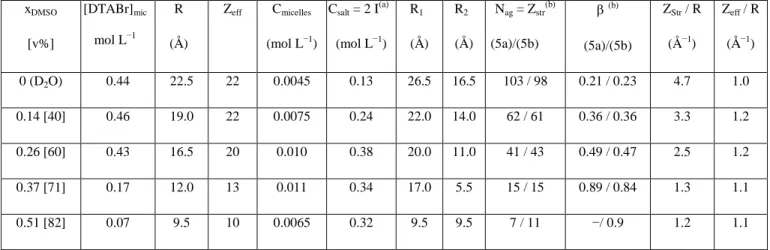
xDMSO [v%] [DTABr]mic mol L−1 R (Å) Zeff Cmicelles (mol L−1) Csalt = 2 I(a) (mol L−1) R1 (Å) R2 (Å) Nag = Zstr(b) (5a)/(5b) β (b) (5a)/(5b) ZStr / R (Å−1) Zeff / R (Å−1) 0 (D2O) 0.44 22.5 22 0.0045 0.13 26.5 16.5 103 / 98 0.21 / 0.23 4.7 1.0 0.14 [40] 0.46 19.0 22 0.0075 0.24 22.0 14.0 62 / 61 0.36 / 0.36 3.3 1.2 0.26 [60] 0.43 16.5 20 0.010 0.38 20.0 11.0 41 / 43 0.49 / 0.47 2.5 1.2 0.37 [71] 0.17 12.0 13 0.011 0.34 17.0 5.5 15 / 15 0.89 / 0.84 1.3 1.1 0.51 [82] 0.07 9.5 10 0.0065 0.32 9.5 9.5 7 / 11 −/ 0.9 1.2 1.1
Table 3: Fitting parameters for SANS (R, Zeff, Cmicelles, R1) and the quantities deduced.
R1: semi-biaxis of the ellipsoid, R2:semi-monoaxis, R: radius of the sphere of volume V = (4π/3) R12 R2,
Zeff: effective charge (a) Csalt = 2I = 2 × CMC + Zeff × Cmicelles; [DTABr]mic is the concentration of
micellized DTABr (= [DTABr]tot− CMC) if the CMC could be determined from conductimetry or (for
xDMSO = 0.37 and xDMSO = 0.51) with a CMC estimated by linear extrapolation from Figure 2.(b)
Agregation numbers Nag and charge rates βwere calculated either using equation (5a) or equation (5b).
Uncertainties: R, R1 ± 1 Å; Cmicelles ± 5 %; Zeff ± 1.
In addition to oblate ellipsoids (semi-biaxis > semi-monoaxis), we also tried the form factor of monodisperse spheres and prolate ellipsoids. Monodisperse spheres were clearly not suited. Oblate ellipsoids led to slightly better fits than prolate ones, but this last shape cannot be ruled out with certainty. Both oblate and prolate shapes were described in the literature, depending on the technique and on the DTABr concentration explored [6,37-39]. The main parameters we derived from the SANS spectra were the aggregation numbers and the ionization degrees, which were calculated from the volume of the interacting objects and the interacting potential and were not sensitive to the shape. The exact shape of the object is thus of little relevance as long as they remain globular and we used oblate ellipsoids for all spectra. Polydispersity was not tested in order to limit the number of fitting parameters.
Figure 5: SANS spectra fitted with the parameters listed in Table 3 for DTABr in DMSO-water mixtures. The DTABr concentrations are listed in Table 1 (the spectra were multiplied by powers of 10 for the sake of clarity). The solvent compositions xDMSO are shown in the insert.
DISCUSSION
Aggregation in DMSO-water mixtures
The calculated SANS intensities matched the experiments for solvents with DMSO compositions between 0 and 80 v%, validating the use of the OZ and HNC equations for DMSO-water mixtures, even those with high DMSO content.
a) Aggregation numbers Nag
We analyzed a large DMSO composition range (0 < xDMSO < 0.67) by SANS. The aggregation
numbers decreased as the DMSO content increased. For very high DMSO contents (xDMSO > 0.51) no
0,01 0,1 1 10 100 1000 10000 0,01 0,1 1 I (c m -1) q (Å-1) x=0 x=0.14 x= 0.26 x= 0.37 x= 0.51
continuous, indicating that solvent composition has a predominant role in micelle formation. The solvent overwhelms the influence of slight sample-to-sample variations in the surfactant concentration (between 0.2 and 0.5 M) in the definition of the aggregates.
b) Micellar ionization degree
The SANS values for the ionization degree β are in good agreement with the conductivity results obtained at the CMC (Table 1 and Table 3). The value obtained in pure water (β ~0.25) is also in agreement with previously reported scattered values between 0.23 [52,53] and 0.34 [41,35], which depend on the technique used and on the DTABr concentration. As the DMSO content increased, the ionization degree β also increased. If it is assumed that aggregate structure remains constant, their ionization degree β is related to the solvent’s capacity to dissociate ions pairs (evaluated through the reciprocal dielectric constant 1/ε (Figure 6)). Using this criterion only, we predict that as the amount of DMSO present increases, the solvent becomes less dissociating. Thus, the ionization degree would be expected to decrease, the inverse effect of the experimental observation. As a consequence, the increase of β can only be attributed to a change in the structure of the micelles (aggregation numbers and shape) that counterbalances this dielectric effect. To explain the variation in β, the micelle may be described by a spherical colloid of radius R, with a structural charge Zstr and an effective charge Zeff. The structural
charge Zstr, which is equal to the aggregation number of the micelle, decreases by a factor of 10 in
solvent mixtures having xDMSO between 0 and 0.51 (Table 3). In contrast, the effective charge Zeff, (i.e.,
that obtained after the condensation of counterions) varies little as it decreased by only a factor of 2 in the same xDMSO range. This effect is expected from charged renormalization considerations[54], which
demonstrate that the ratio of the effective charge Zeff to the radius “R” of the colloid, Zeff/R, is
independent of the corresponding structural quantity Zstr/R (for the same solvent and ionic strength).
Counterions are more strongly attracted to charged micelles (i.e., those with high Zstr/R ratios) in
solvents having equivalent dielectric constants. This leads to a greater condensation and an equivalent effective charge (i.e., a constant Zeff/R ratio). Structural charge Zstr and radius R are related in an
equation derived from equation (5a): Zstr/R = Nag/R= (4π/3) R2/Vmono. A decrease in the aggregation
number results in a decrease in the aggregate’s size R and also in Zstr/R. As a consequence, because
Zeff/R remains constant regardless of the value of Zstr/R, the ionization degree β = Zeff / Zstr increases.
The increase in the ionization degree β is thus a direct consequence of the decrease in the aggregation number and is only slightly influenced by the variation of the dielectric constant of the DMSO-water mixture as xDMSO increases. This interpretation, taking into account the size of the
aggregate and the related change in counterion condensation as the cause for the increase in β, is seldom used to explain the increase in β despite the decrease of ε. The same increase in β was observed for other surfactant micelles in different water-organic solvent mixtures, along with a decrease in the aggregation numbers [25,26]. However, these authors did not link the thermodynamic and the geometric properties of the micelles and proposed that the variation in the ionic strength in the bulk phase was due to an increase in the CMC.
Figure 6. The reciprocal dielectric constant 1/ε (◊; values taken from [32]) vs solvent composition xDMSO
and the Gordon parameter G= γ/V1/3 (*; where γ = solvent/air surface tension and V = molar volume of
the solvent; values taken from [32]) vs solvent composition xDMSO
c) Onset of micellization: CMC 0 0,5 1 1,5 2 2,5 3 0 0,005 0,01 0,015 0,02 0,025 -0,1 0 0,1 0,2 0,3 0,4 0,5 0,6 0,7 0,8 0,9 1 1,1 G o rd o n P ar amet er ( N m -²) 1/ ε xDMSO
A classical increase in the CMC of DTABr occurred with increasing DMSO content. This effect has been reported for cetyltrimethylammonium bromide (CTAB), DTAB, sodium dodécylsulfate (SDS) and other surfactants[14-18,21,22,55] but generally for more narrow DMSO composition ranges. Using the Rico and Lattes’ criteria[56], the increase in CMC that coincides with increasing DMSO content can be linked to a decrease in the dielectric constant of the solvent, a decrease in solvent structure and also to a decrease in solvating properties. However, these effects are difficult to evaluate and quantify. Other attempts have been made to link the capacities of solvents to solubilize hydrocarbon and to promote micellization[55]. One widely used approach[11,57] is the Gordon parameter G defined by G= γ / V1/3
(where γ is the solvent/air surface tension and V is the molar volume of the solvent). G is related to the cohesion of the solvent, which is the driving force for aggregation. This force decreases with a decrease in cohesive energy density, which, in turn, increases the CMC. The effect of xDMSO on G is shown in
Figure 6. The change in G is of a larger magnitude than that of 1/ε, confirming that the cohesion of the solvent has a greater bearing on micellization in this system than the dielectric properties of the solvent.
The Gordon parameter is controversial since it cannot predict all situations[58], but as its simplicity can provide a first approximation of the capacity of a solvent to promote micellization, we tested G against the free enthalpies of micellization ∆Gmic and the aggregation number Nag (Figure 7).
Nearly all the experimental data fit on a straight line, both for ∆Gmic and Nag. This trend for the
aggregation number versus G has been reported previously [25,57]. The decrease in the aggregation number is continuous, and by no means shows an abrupt change at xDMSO = 0.33 (which corresponds to
G = 1.6 N m−2). A threshold of G = 1.3 N m−2 is generally thought to be necessary for micellisation to be possible. Our results for Nag agree with this assertion. However, in our case, the value of 1.3 N m−2 for G
coincides with the onset of oligomerization rather than micellization, if we define micellisation as the cooperative aggregation of a large number of monomers, as explained in the following.
Figure 7: Plots of the molar free enthalpy of micellization ∆Gmic (O) and the aggregation number Nag (♦)
vs the Gordon parameter G of solvents having various DMSO contents (obtained from Figure 6). The lines are visual guides.
Role of solvation in the micellization process
a) Solvation of the free monomer
To further explore how micellization properties are affected by changing DMSO content, we examined the molar volume of the monomers in the presence of different DMSO contents in the solvent. This relationship provides new insight about the solvation of the monomers and the role of solvophobicity. Since the concentrations of DTABr are very low, we assume that apparent and partial molar volumes are identical.
Experimentally, the molar volumes of the monomeric and of the micellized surfactant are different for DMSO compositions less than xDMSO = 0.35 whereas they are equal for higher DMSO
contents (Figure 4). The partial molar volume of a solubilized species can be artificially split into an intrinsic volume, which is independent of the surrounding environment, and a volume that depends on its alteration of the solvent structure. This latter quantity can be positive or negative, depending on the reorganization of the solvent around the dissolved compound[59]. Amphiphiles make two contributions
-38 -36 -34 -32 -30 -28 -26 -24 -22 -20 1,0 1,5 2,0 2,5 3,0 0 20 40 60 80 100 120 A ggr e ga ti on num be r N ag G = γ/V1/3 (N m-2) ∆ Gm ic ( kJ m o l -1)
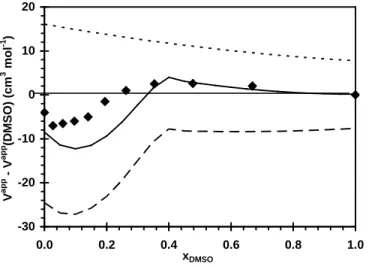
Figure 8: Experimental (this study; ♦) and calculated (from equation (11) partial molar volumes of monomeric DTABr at different DMSO contents relative to the volume in pure DMSO.
V∞chain ( )V∞head ( ) V∞DTABr ( ).
For DTABr, these two contributions can be evaluated from volume data for tetraalkylammonium bromides (R4NBr, with R = methyl [Me], n-butyl [Bu], n-pentyl [Pen]) in DMSO-water solvents[ 46,60].
The partial molar volumes of DTABr can be calculated, assuming the additivity of the volumes of each chemical group, using the following equations:
V∞chain = ¼ × V∞Pen + 7 × ¼ × (V∞Pen− V∞Bu) − ¼ V∞Br
V∞head = ¾ × V∞Me + ¼ V∞Br
V∞DTABr = V∞chain + V∞head
(11a)
(11b)
(11c)
where V∞R is the partial molar volume at infinite dilution of R4NBr; ¾ × V∞Me is the volume of the polar
head; ¼ × ( V∞
Pen − V∞Bu) is the volume of one CH2 group in the chain; [¼ × V∞Pen + 7 × ¼ × ( V∞Pen −
V∞Bu)] is the volume of the dodecyl chain; V∞Br is the volume of the bromide ion (31 cm3).
The difference between the partial molar volume of DTABr in the solvent xDMSO and its partial
molar volume in pure DMSO is plotted in Figure 8; pure DMSO was used as the reference behavior. This plot shows the extra perturbation of the water on the surfactant in the mixed solvent. For the experimental as well as the calculated values, minima are observed at low xDMSO values and maxima
-30 -20 -10 0 10 20 0.0 0.2 0.4 0.6 0.8 1.0 xDMSO V a p p - V a p p (D M S O ) (c m 3 m ol -1 )
appear near xDMSO = 0.4. The assumptions made for the calculation (additive rule to calculate the
different group contributions of the volume and equality of partial and apparent volumes) lead to slight differences between the experimental values and the calculated values, but the trend was accurately reproduced.
The first part of the curve (xDMSO < 0.4) is due to the contribution of the polar head and the
aliphatic chain, with the chain being responsible for the initial U-shape of the curve. In the second part of the curve, the small volume changes are due to reorganization around the polar head, with the chain environment remaining unchanged.
The determination of the partial molar volumes of tetraalkylammonium R4N+ in several organic
solvents[59] showed that, for a given large alkyl group R, this volume is constant, independent of the nature of the organic solvent and much higher than it is in water. In water, these large ions undergo hydrophobic hydration, resulting in a lower volume (destructuration of the water network), whereas they are not affected in this way by an organic solvent. This suggests that for organic solvents, the solvent structure is unaffected by these solutes. For DMSO-water mixtures, the final volume of the chain of the surfactant is reached at xDMSO≈ 0.4−0.5. Therefore, for the highest DMSO contents, the introduction of
the chain in the mixed solvent produces no volume change (no extra perturbation of the solvent, compared to pure DMSO). This suggests that the chain is only surrounded by DMSO. This better solvation leads to an increase in the solubility of the chain in the presence of high DMSO contents. The partial molar volume of the chain remains constant with xDMSO and the changes of the overall partial
molar volume are solely attributable to perturbation of the solvent around the head.
b) Solvation of surfactant in micelles
As can be seen on Figure 4, up to xDMSO ≈ 0.6, the micellized volume Vmic remained constant.
This means that the perturbation of the solvent around the micelle is independent of the DMSO content and is identical to that in pure water: the micellized surfactant encounters the same environment whether in water or in mixed solvents. It is unlikely that the two contributions to the volume detailed in equation
volume, each contribution must be invariant with the DMSO content in this composition range, and equal to the corresponding value in water. This implies that: 1) the micellar core is composed of aliphatic chains that are either free of solvent, as it has been established for water[61] or, if DMSO can penetrate the core, it does not affect the volume (vide supra); and 2) the solvation of the head is independent of the presence of DMSO and thus must be composed of water molecules only. This latter point is confirmed in Figure 8, which indicates that the main contribution to the molar volume of free DTABr is due to the solvation of the chain. Once this contribution is suppressed by aggregation, the only remaining contribution is that of the heads, which have a much lower impact. The highly charged surface of the micelle could promote the approach of the more polarizable water molecules and enhance the phenomenon by repelling DMSO from the vicinity of the surface.
If the volume of micellization (i.e., the difference between the volume of a monomer in solution and its volume in an aggregate) decreases as the solvent DMSO content increases, the tendency toward micellization (the release of solvent perturbation upon micellization) is weaker. As a consequence, the ∆Gmic is less favorable and the CMC increases.
Thermodynamics of micellization
Experimentally, DTABr aggregates were characterized throughout the entire DMSO-water composition range. We determined the variation in the partial molar volume of the surfactant and related these changes to the differences in solvation of the head and chain in the solvent. The first conclusion is that the insolubility of one part of the surfactant drives the process of aggregation[51] in DMSO-water mixtures like for pure water solvent.
The free enthalpy of micellization experimentally obtained from the CMC value (Table 2 and Figure 2) can be decomposed into different contributions [51]:
∆G0
mic = (∆µg°)tr + (∆µg°)int + (∆µg°)def + (∆µg°)(HG)
where (∆µ°)tr is the hydrophobic free enthalpy contribution, related to the transfer of a hydrocarbon
The other contributions counteract aggregation: (∆µ°)int is the cost of creating the interface; (∆µ°)def
(deformation or packing) is the term related to the restriction of the different conformations of the chain in the micelles; (∆µ°)(HG) is the most positive contribution, and is related to the interactions between head groups. This final term can be divided into a contribution from steric repulsion (∆µ°)ste and another
one from electrostatic interactions (∆µ°)ionic. In a first approximation, for ionic surfactants, it is related to
the Debye screening length, which at constant ionic strength is proportional to the reciprocal of the dielectric constant 1/ε of the solvent.
We used the formalism developed by Nagarajan et al[23] to calculate the various contributions to the free enthalpy of micellization in the DMSO-water mixtures. For an aggregate of aggregation number
g, the expressions and details of calculations are summarized in supplementary materials, only the results
of the calculation are discussed in the article.
An interesting result from this formalism is the volume fraction in the vicinity of the micellar surface which can be calculated from equation (15):
(12)
NDMSO is the ratio of the molecular volume of DMSO to the molecular volume of water and is
equal to 3.96 at 298 K.
v
W is the molecular volume of water. and are thehydrocarbon-DMSO and hydrocarbon-water) interfacial tensions, respectively. Their estimated values are = 50 mN m−1 ([23]) and = 11 mN m−1 ([62]). S DMSO ϕ ) 2 1 ( 2 1 ) 2 1 ( 4 3 v kT ) 1 )( 1 ( ) / (
ln 2W/3 w DMSO DMSO w DMSO DMSOS
S DMSO S W DMSO S DMSO N / 1 DMSO S DMSO DMSO σ σ χ ϕ χ ϕ ϕ ϕ ϕ ϕ − − − + − = − − − − S DMSO σ S W σ S W σ S DMSO σ
Figure 9: DMSO volume fraction ϕS
DMSO at the interface between a hydrocarbon core and the mixed
solvent (water-DMSO) vs DMSO bulk volume fraction ϕDMSO in the mixed solvent. Calculated from
equation (12).
The resulting surface composition is plotted vs. the bulk volume fraction ϕDMSO in Figure
9, which shows that the hydrocarbon-solvent interface is clearly enriched in DMSO. The very steep slope at the beginning reflects the high affinity of DMSO for the aliphatic chain. It is comparable to the steep decrease in the partial molar volume of the chain shown in Figure 8, which is caused by the same phenomenon. Depends on Transfer (∆µ°g)tr Deformation (∆µ°g)def Interface (∆µ°g)int Steric (∆µ°g)ste Ionic (∆µ°g)ionic
Chain length Y Y (little) Y Y (little) Y (little)
Aggregation number g N Y Y Y Y Solvent composition xDMSO Y N Y N Y Monomer molar fraction X1 N N N N Y
Table 4: Dependency of the various contributions to the free enthalpy ∆G°mic on micelle and solvent
parameters. Y = dependency; N = No dependency.
0 0.2 0.4 0.6 0.8 1 0 0.2 0.4 0.6 0.8 1 ϕDMSO ϕ S D M SO S DMSO ϕ
For a given xDMSO, the sum of the five contributions (∆µ°g = ∆G°mic) is calculated with the
monomer molar fraction X1 and the aggregation number g (between 1 and 60) as independent variables.
The mole fraction Xg of each g-aggregate arises from:
∆ − = kT µ exp g X Xg g 0 1 (13)
The total molar fraction Xtot = X1 + ΣgXg (or the molar concentration: Ctot = C1 + ΣgCg) is deduced.
Table 4 summarizes the dependencies of these five contributions on the various parameters. (∆µ°g)tr can
be calculated for each solvent composition, independently of the size of the aggregates g. For a given solvent composition, the other contributions to ∆G°mic depend on the aggregation number and must be
calculated for each size. The ionic contribution depends on all parameters: g, xDMSO, monomer
concentration (i.e, CMC).
Figure 10: Free enthalpy contributions calculated according to Nagarajan’s model. Solid lines: xDMSO =
0; Ctot = 1.12 ×10⁻² mol L−1 and X1 = 0.000203. Dashed lines: xDMSO = 0.26; Ctot = 1.32 × 10⁻¹ mol L−1
and X1 = 0.0038 -25 -20 -15 -10 -5 0 5 10 15 0 10 20 30 40 50 60 70 ∆ µ °/ k T Aggregation number g (∆µ°)interface (∆µ°)ionic (∆µ°)total (∆µ°)transfert
The various free enthalpy contributions calculated for pure water and for xDMSO = 0.26 according to
Nagarajan’s model are shown in Figure 10. The surfactant concentration X1 was chosen at the onset of
micellization (vide infra for the definition of micellization). The contributions that depend most highly on the solvent composition are: the free enthalpy of transfer (∆µ°g)tr, the creation of the interface
between the core and mixed solvent (∆µ°g)int, and the electrostatic repulsion between polar heads
(∆µ°g)ionic[23]. For this reason, we considered only these three.
As the DMSO content in the solvent increases, the transfer free enthalpy ∆µ°tr increases rapidly:
the solubilization of the chains becomes more favorable since it induces a limited perturbation of the solvent (Figure SM-6 in Supplementary Material). Under these same conditions, the electrostatic and interfacial contributions change to far lesser extents. The balance between the forces that dominate micellization is modified, which results in altered DTABr micellization when DMSO replaces water in the solvent.
Figure 11: Comparison of calculated (solid line) CMC values to experimental CMC values determined from density measurements (∆) and from conductivity measurements (□).
This model also allows the calculation of the CMC. Evans[51] suggested defining the CMC as the concentration at which the probability that a monomer remains in solution is equal to its probability of aggregation. On a plot dC1/dCtot vs Ctot, this criterion corresponds to the concentration Ctot for which
0 0,02 0,04 0,06 0,08 0,1 0 0,1 0,2 0,3 0,4 c m c ( m o l/L ) xDMSO
dC1/dCtot = 0.5. However, since our experimental determination of CMC using molar volumes is based
on the detection of the very beginning of aggregation, we modified this definition and used two conditions to determine the CMC: (i) the onset of aggregation was given as the concentration for which dC1/dCtot = 0.95. (ii) this onset of aggregation was defined as a CMC (i.e., a cooperative aggregation
process) only when aggregation was steep enough, with the quantitative criterion that the concentration difference between dC1/dCtot = 0.95 and dC1/dCtot = 0.5 should be smaller than one CMC value. This
procedure is illustrated in Figure SM-7 for the limiting case xDMSO = 0.26. We compared the calculated
CMC values to the ones determined experimentally (Figure 11).
For xDMSO between 0.26 and 0.30, the calculated CMC vanishes. Indeed, for xDMSO higher than
0.26, aggregation could be predicted but no cooperative CMC could be defined. This is in agreement with the experimental features. For higher DMSO contents, aggregates are characterized (Figure 5 and Table 3) but the micelle formation cannot be described by a cooperative aggregation (Figure 1 and Table 2).
The changes in the weight-average aggregation numbers according to the different water-DMSO compositions can also be obtained from the model according to equation (14):
g g app , w gX X X ² g X n Σ + Σ + = 1 1 (14)
The weight-average aggregation numbers decrease continuously with increasing DMSO content (for example, nw,app decreases from 30 to 2.5 between pure water and xDMSO=0.51 for Ctot = 0.4 mol L−1), as
observed experimentally (Table 3). Qualitative agreement is obtained between the experimental data and the model.
The xDMSO = 0.33 composition, which corresponds to the formation of a 1 DMSO: 2 H2O complex, is
indeed a threshold for many properties of DMSO-water mixtures (e.g., viscosity, excess volume, excess dielectric constant, excess enthalpy of mixing, etc.). These properties undergo progressive changes between xDMSO = 0.3 and 0.4. Aggregation of DTABr behaves similarly, changing from a clearly defined
observed and theoretically predicted. The transition between these two behaviors occurs at approximately xDMSO = 0.3, where we observed a zone of oligomerization. The process was continuous
as micellar properties (Nag and CMC) increased continuously until the aggregates vanished. These
changes in the aggregation properties of the surfactant were a direct consequence of the mixed solvent properties, which were the input parameters of the model.
CONCLUSION
Using a combination of different techniques (SANS, conductivity and density measurements) and complementary approaches for the interpretations (statistical physics using the HNC equation, molecular thermodynamics with Nagarajan’s model, and group additivity for partial molar volumes), we studied the aggregation properties of a cationic surfactant, DTABr, in water-DMSO mixtures having compositions between pure water and pure DMSO. This complete study allowed us to follow the aggregation properties of this surfactant in water-DMSO mixtures at different length scales (molecular to supramolecular).
The global methodology we used here is certainly not specific to DTABr and could be extended to other surfactants in solvent mixtures. Several main conclusions emerged from this work. (i) The DMSO composition threshold, xDMSO = 0.33, observed for many properties of the binary DMSO-water
mixture remains valid for micellization, although a third component (the surfactant) is involved. For high DMSO composition solvents, no micellization occurred. Micellization is thus more controlled by the properties of the solvent than by the nature of the surfactant in a mixed solvent. (ii) The previously described phenomenon of increasing effective micelle charge with increasing xDMSO [25,26] is explained
here in the framework of SANS and statistical physics and can be solely attributed to the decreasing size of the micelles. (iii) Although controversial, the Gordon parameter was used to interpret the experimental data. In this system, aggregates are observed for Gordon parameter values higher than 1.3, which is a generally accepted threshold value for the presence of aggregates. (iv) The micellization
composition using the thermodynamic model described by Nagarajan et al[23] for another solvent mixture (water-ethyleneglycol) containing various surfactants. (v) Finally, analysis of the molar volumes of DTABr as a function of increasing DMSO content revealed information about the organization of the solvent around the surfactant molecules. These results are compatible with a dissymmetric solvation for the amphiphile, in which the hydrocarbon chains would be preferentially surrounded by DMSO and the polar heads surrounded by water molecules. This finding reveals that the motor for micellization (i.e., the unfavorable solvation of the chains) decreases as water is replaced by DMSO around the hydrocarbon chains.
ACKNOWLEDGMENTS: We thank Luc Belloni from SIS2M, CEA, Saclay (France) for the HNC program for SANS analysis and Jacques Jestin and José Teixeira, from the LLB, CEA, Saclay, (France) for their help in recording and interpreting the neutrons spectra.
Supplementary Material available: Additional graphs or fitting parameters, model for SANS spectra fitting, apparent molar volumes values, equations reported from [23] are available free of charge via the internet.
REFERENCES
[1] S. Dev, K. Gunaseelan, Ismail, K., Langmuir, 16 (2000) 6116
[2] T. Perche, X. Auvray, C. Petipas, R. Anthore, I. Rico-Lattes, A. Lattes, Langmuir, 13 (1997) 1475 [3] Gopal, R., Singh, J.R., J. Phys. Chem, 77 (1973) 554
[4] (a) D.F. Evans, A. Yamauchi, R. Roman, E.Z. Casassa, J. Colloid Interface Sci., 88 (1982) 89 (b) Jezequel, D., Mayaffre, A., Letellier, P., J. Chim. Phys., 88 (1991) 391
[5] J. Aguiar, J.A. Molina-Bolívar, J.M. Peula-García, C. Carnero Ruiz, J. Colloid Interface Sci.,255 (2002) 382
[6] C. Seguin, J. Eastoe, R.K. Heenan, I. Grillo, J. Colloid Interface Sci., 315 (2007) 714
[7] C. Seguin, J. Eastoe, R. Clapperton, R.K. Heenan, I. Grillo, Colloid Surf. A., 282-283 (2006) 134 [8] C. Seguin, J. Eastoe, R.K. Heenan, I. Grillo, Langmuir 23 (2007) 4199
[9] M.J. Hollamby, R. Tabor, K.J. Mutch, K. Trickett, J. Eastoe, R.K. Heenan, I. Grillo, Langmuir 24 (2008) 12235
[10] M. Sjöberg, U. Henriksson, T. Wärnheim, Langmuir, 6 (1990) 1205
[11] M.S. Ramadan, D.F. Evans, R. Lumry, S. Philson, J.Phys. Chem., 89 (1985) 3405
[12] I. Rico, A. Lattes, in Organized Solutions-Surfactant in Science end Technology; S.E. Friberg, B. Lindman, Eds.; Marcel Dekker, New York, 1992, p 115
[13] E.J. Fendler, V.G. Constien, J.H. Fendler, J. Phys. Chem., 79 (1975) 917
[14] L.G. Ionescu, T. Tokuhiro, B.J. Czerniawski, E.S. Smith, in Solution Chemistry of Surfactants, vol 1, K.L. Mittal, Ed., Plenum Press, New York, 1979, p 487
[15] M.S. Bakshi, J. Chem. Soc., Farad. Trans., 89 (1993) 4323
[16] F. Jalali, M. Shamsipur, N. Alizadeh, J. Chem. Thermodyn., 32 (2000) 755 [17] H.N. Singh, S.M. Saleem, R.P. Singh, K.S. Birdi, J. Phys. Chem., 84 (1980) 2191 [18] Z.B. Alfassi, W.G. Filby, Chem. Phys. Lett., 144 (1988) 83
[19] J. Chrisment, J.J. Delpuech, F. Hamdoune, J.C. Ravey, C. Selve, M.J. Stébé, J. Chem. Soc., Farad. Trans., 89 (1993) 927
[20] J. Chrisment, M. Galin, J.C. Galin, New J. Chem., 19 (1995) 303 [21] M. Almgren, S. Swarup, J.E Löfroth,. J.Phys. Chem, 89 (1985) 4621
[22] M.L. Moyá, A. Rodriguez, M. Muñoz, M.M. Graciani, G. Fernández, J.Phys. Org. Chem., 19 (2006) 676
[23] R. Nagarajan, C.-C. Wang, Langmuir, 16 (2000) 5242
[25] A. Rodriguez, M.M. Graciani, M.L. Moyá, Langmuir, 14 (2008) 12785
[26] A. Rodriguez, M.M. Graciani, G. Fernandez, M.L. Moyà, J. Coll. Interf ; Sci., 338 (2009) 207 [27] A. Luzar, J.Chem. Phys., 91 (1989) 3603
[28] A.K. Soper, A. Luzar, J.Phys. Chem., 100 (1996) 1357 [29] A. Luzar, D. Chandler, J.Chem. Phys., 98 (1993) 8160
[30] I.I. Vaisman, M.L. Berkowitz, J.Am.Chem. Soc., 114 (1992) 7889 [31] J. Catalán, C. Díaz, F. García-Blanco, J.Org. Chem., 66 (2001) 5846 [32] E. Tommila, A. Pajunene, Suomen Kemistilehti B, 41 (1968) 172
[33] C. de Visser, V.J.M. Heuvelsland, L.A. Dunn, G. Somsen, J. Chem. Soc, Farad. Trans.I, 74 (1978) 1159
[34] J. Makurkiewicz, P. Tomasik, J. Phys. Org. Chem., 3 (1990) 493 [35] K.M. McGrath, Langmuir, 11 (1995) 1835
[36] J.E. Brady, D.F. Evans, G.G. Warr, F. Grieser, B. Ninham, J.Phys. Chem, 90 (1986) 1853 [37] M. Bergström, J.S. Pedersen, Phys. Chem. Chem. Phys., 1 (1999) 4437
[38] S.S. Berr, J. Phys. Chem, 91 (1987) 4760
[39] V.K. Aswal, P.S. Goyal, Chem. Phys. Lett, 368 (2003) 59 [40] A. Rohde, E. Sackman, J.Phys. Chem, 84 (1980) 1598
[41] H. Preu, C. Schirmer, M. Tomšic, M. Bešter Rogac, A. Jamnik, L. Belloni, W. Kunz, J. Phys. Chem. B, 107 (2003) 13862
[42] L. Gaillon, J. Sirieix-Plenet, P. Letellier, J. Sol. Chem., 33 (2004) 1333
[43] J.S. Pedersen, In Neutrons, X-rays and light : Scattering Methods Applied to soft Condensed Matter, P. Lindner, Th. Zemb, Eds.; North-Holland : Amsterdam, 2002; Chapter 16
[44] M. Kotlarchyk, S.-H Chen,. J. Chem. Phys. 79 (1983) 2461.
[45] R. Klein, In Neutrons, X-rays and light : Scattering Methods Applied to soft Condensed Matter, P. Lindner, Th. Zemb, Eds.; North-Holland : Amsterdam, 2002; Chapter 14
[47] S. Causi, R. De Lisi, S. Milioto, N. Tirone, J. Phys. Chem., 95 (1991) 5664
[48] L. Koester, W.B. Yelon, Summary of low energy neutron scattering lengths and cross sections, ECN: Petten, Netherlands, 1982
[49] P. Carpena, J. Aguiar, P. Bernaola-Galván, C. Carnero Ruiz, Langmuir, 18 (2002) 6054 [50] L. Gaillon, R. Gaboriaud, J. Chim. Phys., 94 (1997) 728 (in French)
[51] D.F. Evans, H. Wennerström, "The Colloidal Domain, Where Physics, Chemistry biology and Technology meet", Wiley-VCH, New York (1999), chapter 4, p153
[52] L. Gaillon, M. Hamidi, J. Lelièvre, R. Gaboriaud, J. Chim. Phys., 94 (1997) 707 (in French) [53] R. Zana, J. Colloid Interface Sci., 72(2) (1980) 330
[54] L. Belloni, Coll. Surf. A, 40 (1998) 227
[55] J. Wang, L. Zhang, C. Wang, J. Wu, J. Phys. Chem. B, 115 (2011) 4955 [56] A. Lattes, I.Rico, Colloids Surf., 35 (1989) 221
[57] M.L. Moyá, A. Rodriguez, M.M. Graciani, G. Fernández, J. Colloid Interf. Sci., 319 (2007) 787 [58] O. Zech, W. Kunz, Soft matter, 7 (2011) 5507
[59] B.S. Krumgalz, J.C.S. Faraday I, 76 (1980) 1887
[60] E. Garcia-Pañeda, C. Yanes, E. Muñoz de Miguel, A. Maestre, J Chem Eng Data, 41 (1996) 1149 [61] M. Jorge, Langmuir, 24 (2008) 5714
![Table 1: Scattering length densities ρ Ν (see text) and dielectric constants ε (from [32]) of the solvents used for SANS](https://thumb-eu.123doks.com/thumbv2/123doknet/13476201.413007/8.918.77.821.178.436/table-scattering-length-densities-dielectric-constants-solvents-sans.webp)
![Figure 6. The reciprocal dielectric constant 1/ε (◊; values taken from [32]) vs solvent composition x DMSO](https://thumb-eu.123doks.com/thumbv2/123doknet/13476201.413007/20.918.92.452.601.864/figure-reciprocal-dielectric-constant-values-taken-solvent-composition.webp)