Department of Geosciences, Geography
University of Fribourg, Switzerland
Geospatial modelling of the glacial
archaeological potential in the Pennine Alps
THESIS
Presented to the Faculty of Science of the University of Fribourg (Switzerland) in
consideration for the award of the academic grade of Doctor rerum naturalium
by
Stephanie R. Rogers
from
Canada
Thesis No: 1858
UNIprint
2014
C
ONTENTS
Summary ... 5 Résumé ... 6 List of Figures ... 7 List of Tables ... 9 List of Abbreviations ... 11 1 General Introduction ... 13 1.1 Motivation ... 13 1.2 Objectives ... 171.3 Structure of the thesis ... 18
2 The Pennine Alps ... 20
2.1 Glaciological context ... 21
2.2 Production of a geospatial database for the Pennine Alps ... 23
3 Geospatial Analysis & Glacial Archaeology ... 27
3.1 Paper I: An overview of selected GIS methods available for use in glacial archaeology ... 29
4 Integrative Approach ... 47
4.1 Paper II: Least cost path analysis for predicting glacial archaeological site potential in central Europe ... 49
4.2 Paper III: Least cost path analysis for predicting archaeological potential: scale and parameter investigations ... 72
4.3 Paper IV: Combining glaciological and archaeological methods for gauging glacial archaeological potential ... 89
5 General Discussion ... 118
5.1 Summary of results ... 118
5.2 The use of geospatial technologies... 121
5.3 Future outlook ... 123
6 Bibliography... 125
Acknowledgements ... 130
5
S
UMMARY
Humans have a longstanding relationship with frozen environments. Although this relationship is not fully understood, humans are known to have frequented frozen regions for thousands of years to obtain resources or to move between locations. Recent changes in climate have increased melting of glaciers, ice patches, and permafrost at high latitudes and altitudes. In some regions, thawing of these environments has led to the accidental discovery of archaeological remains or artefacts. As a result, archaeologists have shifted their research to frozen areas in an attempt to collect and preserve unique glacial archaeological findings.
The Pennine Alps, located between the canton of Valais in Switzerland and the provinces of Aosta and Piedmont in Italy, is a region of glacial archaeological interest due to its vast glaciated terrain and rich cultural history dating back to the Mesolithic (12,000 – 9,000 years BP). The high altitude passes located on the border between Switzerland and Italy have been used as trade, commerce, and migration routes for thousands of years. The melting of glaciers in this region is freeing-up archaeological remains on passes or surrounding areas that support their prehistoric and historic use. Due to the organic composition of many potential remains (e.g. wood, clothing), there is an urgent need to collect these items before they are destroyed. However, the high altitudes at which potential sites are located are not conducive to regular systematic archaeological prospection due to their remoteness and inaccessibility.
Geospatial analyses, incorporating information from geographical, historical, and archaeological sources, offer a unique opportunity to determine glacial archaeological potential. In this thesis, geospatial analyses using Geographic Information Systems (GIS) and glaciological methods were employed to determine areas of highest glaciological potential in the Pennine Alps to help locate, collect, and preserve unique glacial archaeological objects in partnership with archaeologists and historians as part of a multidisciplinary project funded by the Swiss National Science Foundation (SNSF).
Using various geospatial methods, including least cost path and locational analyses and glaciological modelling, 31 high altitude passes of glacial archaeological interest and potential were identified in the Pennine Alps. A Bronze Age artefact was discovered after the archaeological prospection at one of these sites which was previously unknown to archaeologists and historians. This demonstrates that geospatial analyses can be used to focus archaeological prospection by narrowing down large, remote, study regions to sites of a few square kilometers to support decisions about where to conduct current and future archaeological prospection. Future efforts should continue to use geospatial analyses to focus on the archaeology of frozen regions to identify areas of potential in order to avoid losing unique information about past cultures and climates.
6
Les humains fréquentent les environnement froids et englacés depuis des milliers d'années, comme passage permettant de relier deux régions ou dans le but d’en exploiter les ressources. Dans certaines zones de haute montagne et situées sous les hautes latitudes, la fonte et le retrait des glaciers, des névés et du pergélisol, liés à des changements climatiques récents, a ainsi permis la découverte, souvent accidentelle, d’artéfacts et de restes archéologiques. Ces découvertes ont éveillé l’intérêt des archéologues pour ces régions englacées et ont ainsi contribué au développement de l’archéologie glaciaire. Le but des recherches dans ce domaine étant de collecter et de conserver ces objets uniques, fraîchement libérés des glaces, avant qu’ils ne disparaissent pour toujours.
Les Alpes pennines désignent la région comprise entre le canton du Valais en Suisse et les provinces d'Aoste et du Piémont en Italie. En raison de l’étendue des masses glaciaires et de sa longue histoire culturelle qui a débuté au mésolithique (12'000-9'000 années BP), cette région représente un grand intérêt pour l'archéologie glaciaire. Les cols de hautes altitudes situés à la frontière entre la Suisse et l'Italie ont servi de routes commerciales, ainsi que de voie de migration depuis des milliers d'années. Des objets archéologiques, mis à jour par le retrait glaciaire sur les cols et dans leurs environs, apportent des indices quant à leur utilisation historique et préhistorique. Or, ces artéfacts, étant fréquemment de composition organique (comme le bois ou les pièces de vêtements), se décomposent rapidement au contact de l'air. Il y a par conséquent une urgence de les collecter avant qu'ils ne se dégradent. Toutefois, ces sites potentiels sont souvent situés à une altitude élevée et donc inaccessibles, ce qui rend difficile toute prospection systématique et représente donc un défi pour les archéologues.
Pour répondre à ce défi, et dans le but d’identifier les zones de fort potentiel archéologique dans les Alpes pennines, cette thèse de doctorat se base sur les analyses géospatiales. Ces dernières ont la particularité de permettre l’intégration à la fois des informations géographiques, historiques et archéologiques. L’outil développé, basé sur des systèmes d'information géographique (SIG, ou GIS en anglais) et des méthodes d’étude glaciologiques, a pour ambition, à terme, de permettre de localiser, de collecter et finalement de conserver ces artéfacts archéologiques uniques libérés des glaces.
Une approche intégrative utilisant différentes méthodes géospatiales a été développée. Elle inclut deux types d’analyses spatiales, l’analyse du trajet optimal, et l’analyse de localisation, ainsi que des modélisations du retrait glaciaire. Cette approche permet d’identifier les zones archéologiques les plus intéressantes et de proposer des zones de prospection de quelques kilomètres carrés chacune. Trente et un cols d’intérêt pour l’archéologie glaciaire ont notamment été identifiés dans les Alpes pennines. Lors d'une prospection, un objet datant de l'âge du Bronze a été découvert dans une des zones définies, jusqu'à là inconnue aux archéologues et historiens. Ainsi, la méthodologie développée dans cette recherche fournit un outil d’aide à la décision aux archéologues, afin qu’ils puissent cibler et mener des campagnes de prospection sur les secteurs les plus prometteurs.
7
L
IST OF
F
IGURES
Figure 1.1. Examples of glacial archaeological finds………...16
Figure 2.1. Overview of the study area.………...20
Figure 2.2. The Last Glacial Maximum during its peak extent in the western Alps………...22
Figure 2.3. Glacier extents from 1850, 1973, and 2010 near the Theodulpass with retreat values for the Oberer Theodul Glacier and the Unterer Theodul Glacier………...23
Paper I Figure 1. Process of building a cost raster for locational and least-cost path analyses.………34
Figure 4.1. Schema of integrative approach………47
Paper II Figure 1. Map of the analysis site including the locations of interest Sion, Domodossola, and Aosta, and the overview map of Switzerland and its surrounding countries...………52
Figure 2. Least cost paths from Site 1 to the Cabin de Becs de Bosson shown on DEM-derived slope raster………..59
Figure 3. Least cost paths from Site 2 to the Cabin de Becs de Bosson shown with slope values……….………59
Figure 4. Least cost paths from Sion to Domodossola and vice versa on 1:500,000 topographic map………63
Figure 5. Least cost paths from Sion to Aosta and vice versa on 1:500,000 topographic map..……...64
Figure 6. Zoomed in area of Col de Cleuson from the results of least cost path analysis from Sion to Aosta and vice versa on 1:25,000 topographic map……….………...64
Paper III Figure 1. Overview of the study region…………..………...………...74
Figure 2. Results of LCPA from the point scale………..………77
Figure 3. Results of LCPA from the line scale.………78
Figure 4. Results of parameter weighting investigations………..79
Figure 5. Results of LCPs from the Rhone to Antigorio valleys using different parameter weights and cost rasters from the line scale………...80
8
Paper IV
Figure 1. Overview of study area…….………...………..92
Figure 2. Visualization of the locational analysis processing steps………..………..…..98
Figure 3. Results from locational analysis and glaciological modelling from the whole study area………...…101
Figure 4. GlaciArch results around the Mont Collon which includes the Col de Petit Mont Collon and the Col Collon…..………..………...………..…103
Figure 5. GlaciArch results around the Theodulhorn………..104
Figure S1. GlaciArch results for the S1 region depicted on Figure 3. ...………111
Figure S2. GlaciArch results for the S2 region depicted on Figure 3....……….112
Figure S3. GlaciArch results for the S3 region depicted on Figure 3……….113
Figure S4. GlaciArch results for the S4 region depicted on Figure 3……….114
Figure S5. GlaciArch results for the S5 region depicted on Figure 3……….115
Figure 4.2. Break values of Natural Breaks classification scheme for visualization of locational analysis results………..116
9
L
IST OF
T
ABLES
Table 1.1. Archaeological time periods defined for Alpine regions….………...………..………14 Table 2.1. List of fields and a sample of each type of data in the archaeological finds database…………..………24 Paper I
Table 1. List of criteria used in locational analyses in glacial archaeological studies……….…………34 Table 2. Example of reclassifying criteria into friction layers and weights of each layer..…………..……...35 Paper II
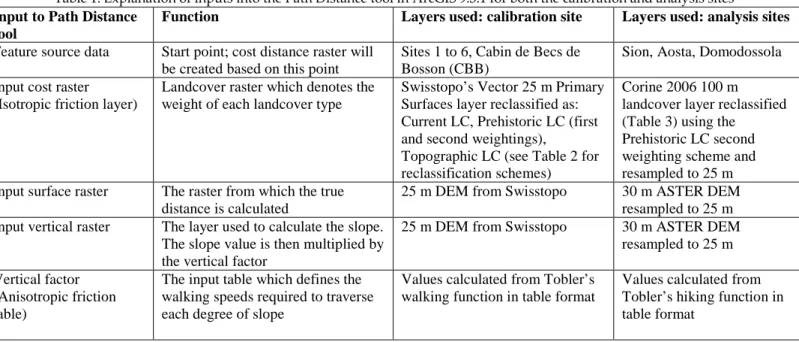
Table 1. Explanation of inputs into the Path Distance tool in ArcGIS 9.3.1 for both the calibration and analysis sites..………..………...55 Table 2. Reclassification and weighting values of the Vector25 landcover layer for the creation of current landcover, prehistoric landcover, and topographic landcover cost rasters using the calibration site of Haut-Val de Réchy, Switzerland………...………....56 Table 3. Reclassification and weighting values of Corine landcover layer for Sion/Aosta study area……….……….57 Table 4. Site numbers, geographic coordinates, altitudes, and calculated walking times from the starting locations to the CBB (away) and vice versa (return) at the calibration site…..………60 Paper III
Table 1. Landcover parameter weightings from respective landcover rasters………..…….…….76 Table 2. Results from point scale analysis including passes selected and the time required………....76 Table 3. Results, shown in average times, from line scale analysis…..……….………78 Paper IV
Table 1. Names and locations of high altitude passes on the border between Switzerland and Italy which were glacierized in 1973………..……….…97 Table 2. Weight values for the layers used in the locational analysis.……….……….97 Table 3. Locational analysis areas calculated for 2010 and the time periods between 2010-2030, 2030-2060, and 2060-2090. The high glacial archaeological potential areas are also calculated for each time period……….………...102 Table 5.1. Categorization description and criteria.………..……..118 Table 5.2. Categorization of identified passes.……….……..120
11
L
IST OF
A
BBREVIATIONS
% Percent ~ Approximately ° Degrees °C Degrees Celsius °E Degrees East °N Degrees North °S Degrees South °W Degrees West 2D Two Dimensional 3D Three DimensionalACDR Accumulative Cost Distance Raster AD After Death
ALM Archaeological Location Modelling asl Above Sea Level
ASTER Advanced Spaceborne Thermal Emission and Reflection Radiometer AT Austria
BP Before Present c.f. Confer cal. Calibrated
CBB Cabin de Becs de Bosson CH Switzerland
CLPs Current Landcover Paths
Corine Coordination of Information on the Environment DE Germany
DEM Digital Elevation Model
E East
e.g. For Example
ESRI Environmental Systems Research Institute FR France
GDEM Global Digital Elevation Model GIS Geographic Information Systems GPS Global Positioning System
GRASS Geographic Resources Analysis Support System HVR Haut-Val de Réchy
i.e. that is
IPCC Intergovernmental Panel on Climate Change IT Italy
IVS Inventory of Historical Traffic Routes in Switzerland ka One thousand years
km Kilometers km2 Square kilometers LCP Least Cost Path
LCPA Least Cost Path Analysis LGM Last Glacial Maximum LIA Little Ice Age
12
m Meters
MCDA Multi-Criteria Decision Analysis
N North
NASA National Aeronautics and Space Administration PLPs Prehistoric Landcover Paths
QGIS Quantum Geographic Information System RCM Regional Climate Models
S South
SAGA System for Automated Geoscientific Analyses SGI2010 Swiss Glacier Inventory 2010
SNSF Swiss National Science Foundation TLP Topographic Landcover Path U.S.A. United States of America
W West
WGS84 World Geodetic System 1984 WPs Wanderland Paths
13
1
G
ENERAL
I
NTRODUCTION
This research is part of the multidisciplinary Swiss National Science Foundation (SNSF) project “Modelling archaeological potential in the Pennine Alps using Geographic Information System (GIS) tools” (CR21I2 130279). Geographers, historians, and archaeologists collaborated to achieve the common goal of identifying regions of high archaeological potential in the Pennine Alps between Switzerland and Italy. Here, the results of the geographical aspect of the project are provided.
1.1
M
OTIVATIONHumans have a longstanding relationship with frozen environments. Although high latitudes and altitudes are relatively dangerous and inhospitable, they have proven to be prime locations for obtaining life’s basic necessities such as water (Reckin, 2013; Wiegandt and Lugon, 2008) and food (Dixon et al., 2005; Gotthardt et al., 1999; Hare et al., 2004, 2012; VanderHoek et al., 2012). These regions were also not an obstacle to travel, as high altitude mountain passes were often traversed for the purposes of commerce or migration (Ammann, 1992; Bezinge and Curdy, 1994 1995; Coolidge, 1912; Curdy et al., 2003; Curdy, 2007; Harriss, 1970, 1971). As a result of climate change, archaeological objects that have been preserved in glaciers, ice patches, and permafrost for hundreds or even thousands of years are melting out of their protective ice beds (Dixon et al., 2005; Molyneaux and Reay, 2010). The discovery of these objects has resulted in a new discipline within archaeology that is referred to by various names, such as ice patch (c.f. Andrews and MacKay, 2012; Reckin, 2013), Alpine (Hunt, 2007), frozen (Molyneaux and Reay, 2010), and glacial archaeology; the latter of which is used throughout this thesis. Glacial archaeological artefacts are at risk of being destroyed by decomposition if they are not located before, or soon after they have been exposed from their frozen environment, because they are often composed of organic materials such as leather, wood, or bones (Dixon et al., 2005). Because temperature increases are not expected to halt, (IPCC, 2013), additional glacial archaeological finds that provide deeper insights to past human cultures and climates are extremely likely to occur.
To date the majority of glacial archaeological discoveries have been encountered accidentally. Until recent decades, it was assumed that humans did not frequent areas above the treeline (2,000 m asl) during the Neolithic period (Hafner, 2012) (Table 1.1). Therefore, archaeologists did not originally undertake systematic prospection in these regions. After the chance discovery of the most famous glacial archaeological remain to date, Ötzi the Tyrolean Ice-man, archaeologists have shifted their research to frozen regions to prevent losing potentially irreplaceable objects which can provide important information about past cultures and climates (Dixon et al., 2005).
14
Ötzi was located by hikers in the Tyrolean Alps on the Italian side of the Italy/Austria border in 1991 (Prinoth-Fornwagner and Niklaus, 1994; Seidler et al., 1992) (Fig. 1.1a). The ice kept this approximately 5,300 year-old corpse in unprecedented condition, making Ötzi one of the most important archaeological finds to date (Dixon et al., 2005). Information such as origin, ancestry, diet, and disposition to diseases could be extracted from Ötzi due to his unique preservation (Janko et al., 2012; Keller et al., 2012). Other significant prehistoric and historic findings have been located on several continents. For example, in Asia melting permafrost surrounding previously frozen tombs located in the Altai mountains in Russia, Kazakhstan, Mongolia, and China are leading to the exposure and decomposition of hundreds of 2,500 year-old corpses (Goossens et al., 2007). There is a high level of cultural and societal significance associated with these frozen tombs; therefore, protective measures should be taken to protect the culture of the indigenous people of the region (Molyneaux and Reay, 2010).
Table 1.1. Archaeological time periods defined for Alpine regions (Hunt, 2007). BP refers to Before Present.
Name Year range (BP) Period Palaeolithic Pre-12,000 Prehistoric
Mesolithic 12,000 – 9,000 Neolithic 9,000 – 6,000 Copper Age 6,000 – 4,000 Bronze Age 4,000 – 2,800 Iron Age 2,800 – 2,200 Roman 2,200 – 1,500 Historic Medieval 1,500 – 500
Modern Era 500 - Present
In North America, the majority of glacial archaeological findings from high altitudes and latitudes in this region are associated with hunting. These finds date back to 13,000 BP and include dart shaft fragments (Kuzyk et al., 1999), throwing darts (Andrews et al., 2012; Hare et al., 2012; VanderHoek et al., 2012), and bow and arrows (Fig. 1.1d) (Dixon et al., 2005; Hare et al., 2004) which were all located on or surrounding ice patches (Reckin, 2013).
In South America, finds at high altitudes are associated with the religious ceremonial offerings of mummified children dating back to Inca times between 1438 – 1532 AD (Ceruti, 2004). Often located above 6,000 m asl, these are believed to be the world’s highest archaeological sites (Ceruti, 2004; Reinhard and Ceruti, 2010; Reinhard, 1999; Wilson et al., 2013).
In Europe, glacial archaeological finds have been discovered in Norway, Sweden, and the Alps, specifically in Italy and Switzerland. Finds from Norway and Sweden are similar to those from North America and are predominantly associated with hunting. Weapons such as arrowheads
15 and shafts have been discovered on the margins of ice patches in these Scandinavian regions (Fig. 1.1c) (Callanan, 2012, 2013; Farbregd, 1972). The oldest find dates back to the Neolithic period and were discovered in 2010 and 2011 (Callanan, 2013).
In the Alps, glacial archaeological remains older than about 12,000 years are not expected to be found due to the Last Glacial Maximum (LGM) and glacier dynamics (see section 2.1 for more information about Switzerland’s glacial history). As previously mentioned, Ötzi is one of the oldest (~5,300 years BP) and most famous glacial archaeological findings from the Alps. Also located in Italy was a pair of woolen leggings dated to 2,750 BP (Dal Ri, 1995), a worked green alder binding material, and a pine twig from 2,716 BP and 6,674 BP, respectively (Rom et al., 1999). The two latter artefacts were retrieved at the same site as Ötzi and indicate that the mountain pass on which he was located was probably used for millennia both before and after his time (Rom et al., 1999). In Switzerland, researchers have uncovered glacial archaeological finds in four locations: the Lötschenpass (2,690 m asl) and Schnidejoch pass (2,756 m asl) in the canton of Bern, the Porchabella glacier (2,680 m asl) in Graubünden, and the Theodulpass (3,000 m asl) in Valais (Hafner, 2012). At the Lötschenpass, bows from the late Neolithic/Early Bronze Age and Roman coins were discovered between 1934 and 1944 (Bellwald, 1992; Meyer, 1992). The site at Schnidejoch was recently under intensive archaeological investigation after hikers found artefacts in 2003 after an extremely warm summer led to glacial melt which had not been experienced for decades (Hafner, 2012; Zemp et al., 2006). Between 2004 and 2011, archaeologists collected a trove of artefacts ranging from the Neolithic, Early Bronze Age, Iron Age, Roman, and Medieval periods, making this one of the most prolific glacial archaeological sites in the Alps. Some of the oldest remains include fragments of an elm wood bowl and a bow kit made of birch bark dated to approximately 6,500 and 4,900 years BP, respectively (Fig. 1. 1b) (Hafner, 2012). In eastern Switzerland, the skeletal remains, hair, clothing, and other belongings of a 17th century woman who fell into a crevasse on the Porchabella glacier were located between 1988 and 1992 at the foot of the glacier (Rageth, 1995). Similar to that instance, the 16th century “Mercenary of Theodul” and his belongings were found on the margins of Oberer Theodul glacier just north of the Theodulpass beginning in 1985 and lasting until 1990. As the glacier continued to melt researchers discovered more of the Mercenary’s belongings which included bones, leather clothing and shoe soles, weapons, and coins (Lehner and Julen, 1991; Meyer, 1992). Since that time, archaeologists have continued to conduct research in this region, making it one of the most intensively studied high altitude archaeological sites in the Pennine Alps between Switzerland and Italy. Other non-glacial archaeological finds located near the Theodulpass include the Alp Hermettji, a rock shelter occupied between the Mesolithic and Bronze Age (Curdy et al., 2003), and a Neolithic axe made of eclogite which was discovered on a path leading to the Theodulpass (Bezinge and Curdy, 1994, 1995). Several hypotheses have
16
Figure 1.1. Examples of glacial archaeological finds from (a) Italian/Austrian border: Ötzi (~5,300 years BP) (South Tyrol Museum of Archaeology, 2014), (b) Birch case made of birch bark (~4,900 years BP) (Hafner, 2012), (c) slate point hafted on a shaft segment (~5,300 years BP) (Callanan, 2013), and (d) bow and arrow technology (370 years BP) (Dixon
17 attempted to explain the location of this axe, including: confirmation that high-mountain passes in the Pennine Alps were used for trade and commerce , that the axe was accidentally misplaced by a shepherd, or that it was left as an offering to ensure safe passage over the Theodulpass, located at 3,000 m asl (Bezinge and Curdy, 1994, 1995).
Other high altitude passes in the Pennine Alps, like the Theodulpass, have been used for thousands of years for the purposes of trade, commerce, and migration. Some passes are more familiar to archaeologists and historians than others. For example, the Grand Saint-Bernard, Fenêtre de Durand, Col Collon, Theodul, Monte Moro, Simplon, and the Albrun passes are considered to be the “principal” ones with well-documented use (Benedetti and Curdy, 2008; Curdy, 2007; Curdy et al., 2010). Other “secondary” passes were also used, although they are less well-documented and have likely become forgotten over time. Archaeologists believe, and recent evidence has demonstrated, that cultural artefacts are locked in the ice at high altitudes in the Pennine Alps between Switzerland and Italy. As snow and ice at high altitudes continue to melt, there is an urgent need to investigate these high altitude mountain passes as more archaeological finds, which hold the key to past cultures and climates, are expected to be revealed from their frozen environment. There are over 60 high altitude passes of potential archaeological interest between Switzerland and Italy. Ideally, each of these passes should be examined at the end of the summer each year, when snow and ice are at their minimum to promote prospecting conditions. However, the systematic prospection of each of these passes is constrained by limited resources.
Geospatial analysis technologies, like GIS, offer new, exciting opportunities to focus archaeological prospection on regions of greatest archaeological interest and potential. Information from various disciplines such as, geography (e.g. topographic information, landcover characteristics, glaciological modelling), archaeology (e.g. knowledge of previous archaeological sites), and history (e.g. archival texts and information about the past) can be spatially analyzed together. Thus, GIS provides an opportunity for an integrative approach to determine glacial archaeological potential in the Pennine Alps with the overall goal to obtain a better understanding about humans and their surrounding environments.
1.2
O
BJECTIVESThe main objectives of this thesis are:
1. To contribute to the identification of areas of glacial archaeological interest in the Pennine Alps.
o Determine which areas of the Pennine Alps could be most easily traversed by humans based on the physical characteristics of the terrain. This is based on the assumption that if areas are more accessible then they will have a higher glacial
18
archaeological potential. Least cost path analyses (LCPA) will be used to calculate high altitude pass accessibility in the Pennine Alps.
o Determine which high altitude regions in the Pennine Alps are best suited to preserve glacial archaeological remains. Locational analysis will be used to forecast areas of glacial archaeological potential based on human accessibility and topographic characteristics.
2. To determine the level of importance for each of the high potential areas in regards to the effects of climate change and the preservation of cultural heritage.
o Glaciological modelling will be used to define regions susceptible to glacial melt for the current and future time periods.
It is expected that the methods used here will help to narrow down a large study areas into smaller, more manageable, regions for current and future efficient glacial archaeological prospection.
1.3
S
TRUCTURE OF THE THESIS This thesis is organized into six chapters:• An introduction to the research project, the field glacial archaeology, the rationale for the study, thesis objectives and structure of the thesis are provided (Chapter 1: General Introduction).
• The geographical and glaciological characteristics of the Pennine Alps are presented, and information about the construction of the geographical database and the derivation of the data layers for the study area is provided (Chapter 2: The Pennine Alps).
• Geospatial analysis is defined and discussed in regards to the field of glacial archaeology and in relation to Paper I, “An overview of selected GIS methods available for use in glacial archaeology”. Additional commentary (section 3.1.10) is provided at the end of the chapter to give an update about the use of geospatial analyses in the field (Chapter 3: Geospatial Analysis & Glacial Archaeology).
• The proposed methodology to determine glacial archaeological potential in the Pennine Alps is presented and highlighted in three papers. Paper II, “Least cost path analysis for predicting glacial archaeological site potential in central Europe”, highlights how the use of one GIS method helped to discover a new archaeological site in the Pennine Alps based on the principles of movement across terrains (section 4.1). Paper III, “Least cost path analysis for predicting glacial archaeological site potential: scale and parameter investigations”, revisits the topics discussed in Paper II and further elaborates on the model (section 4.2). Finally, Paper IV, “GlaciArch: applying glaciological methods for gauging glacial archaeological potential using GIS”, proposes a linkage between
19 glaciology and archaeology, and how glacier melt patterns can help predict where archaeological remains could be located in the future (section 4.3). (Chapter 4: Integrative Approach).
• The results are summarized with respect to the thesis objectives, the four papers are discussed in context with the overall theme of geospatial analysis in glacial archaeology, and conclusions and future outlooks are given (Chapter 5: General Discussion).
20
2
T
HE
P
ENNINE
A
LPS
The Pennine Alps, also known as the Valais Alps, are the section of the central Alps located on the border of the canton of Valais in southwestern Switzerland and the provinces of Aosta and Piedmont in northern Italy (Fig. 2.1). Their central location (45°N, 7°E) in western Europe has made them also historically accessible from the neighbouring regions of France to the west and Germany to the north. They run in an east-west direction and are bounded by the Mont Blanc massif to the southwest, the Rhone valley to the north, the Nufenen-Gries area to the northeast, the Antigorio valley to the southeast, and the Aosta valley to the south (Fig. 2.1). This region covers approximately 4,500 km2 surface area and stretches between 372 m asl in the Rhone valley to 4,634 m asl at the highest peak, the Monte Rosa.
Figure 2.1. Overview of the study area. The study area is split into two sections; east and west. The two sections are separated by the Monte Rosa in the middle, the Mont Blanc Massif on the east and the Nufenen Pass on the west. High altitude passes of interest are shown with a cross while two of the highest peaks are symbolized by stars. Glacier
21
2.1
G
LACIOLOGICAL CONTEXTVariation between warm and cold periods over time has caused fluctuations in the extent and volume of glaciers in the Pennine Alps. These glacial changes have affected terrain geomorphology, causing some high altitude passes to have differing accessibility over time (Hafner, 2012). At the peak of the LGM, about 24,000 years ago, the Pennine Alps were covered by ice (Clark et al., 2009) (Fig. 2.2) with no human occupation at that time (Banks et al., 2008). Deglaciation of the Northern Hemisphere began approximately 20,000 to 19,000 years ago when the climate warmed, thus resulting in glacier retreat. According to geological time, we are currently living in the Holocene, which began around 10,500 years ago when the climate was considered to be similar to today (Holzhauser, 2007). The onset of the Holocene coincides with the beginning of the Mesolithic period in archaeological time (Hunt, 2007). Noncoincidentally, the oldest archaeological evidence in the Pennine Alps stems from the Mesolithic (c.f. Curdy, 2007). At this time, the newly ice-free Alpine biome, located on the margins of the receding glaciers, was a resource-rich area which humans were quick to benefit from (Pacher, 2003; Reckin, 2013). Between the onset of the Holocene and the Little Ice Age (LIA), i.e. the most recent glacial maximum occurring around the year 1850, glacier fluctuations in the region of the Pennine Alps varied between the LIA maximum (Ivy-Ochs et al., 2008), and a minimum which is significantly smaller than today (Grosjean et al., 2007; Holzhauser, 2007; Joerin et al., 2006, 2008). In fact, there were 12 major recession periods of Swiss glaciers during this time period (Joerin et al., 2006). Fluctuations in glacier extents have implications on the potential to locate and retrieve glacial archaeological remains. The discovery and retrieval of glacial archaeological remains is attributable to local ice conditions, characteristics, and dynamics as these can critically affect the probability of finding remains intact (Dixon et al., 2005). Large glaciers located on steep slopes would likely destroy any artefact located under or entrained in it within a few hundred years due glacier dynamics (Benn and Evans, 2010; Dixon et al., 2005; Hafner, 2012). Conversely, valley or small glaciers with slower movement could have a higher potential for the discovery of archaeological remains. The most ideal environment for retrieving in-tact archaeological remains would be ice with little or no movement, such as ice patches, slow-moving glaciers or dead ice (i.e. the ice that has been broken off from receding glaciers). An understanding of glacier dynamics and their effects on geomorphology of the terrain is required when prospecting for glacial archaeological artefacts or remains.
2.1.1
T
HE FUTURE OFS
WISS GLACIERSIn 1850, the total glacierized area in Switzerland was 1,735 km2 (Maisch, 2000). The most recent glacier inventory from 2010 shows a current area of 944 km2 (Fischer et al., in press), an approximate loss of 45% of the 1850 glacier area. Consequently, some glaciers in the Pennine Alps have retreated several kilometers into their Alpine valleys causing significant changes to the appearance of the landscape (Fig. 2.3). Currently, an imbalance exists between glaciers and
22
the current climate conditions. This imbalance is expected to cause glaciers to continue to retreat even if the temperature ceases to increase (IPCC, 2013). In contrast, reaction times of ice patches to changes in climatic conditions differ from those of glaciers due to their reduced size. While disequilibrium exists between glaciers and the current climate, it is assumed that ice patches are currently at the minimum they have been since millennia (Nesje et al., 2012). Since temperature increases are predicted for the future, there is a dire outlook for both European glaciers and ice patches that could result in the majority of glaciers in the Alps being deglacierizied within decades (IPCC, 2013; Zemp et al., 2006).
Figure 2.2. The Last Glacial Maximum (LGM) during its peak extent in the western Alps, approximately 24,000 years BP with 2003 (Paul et al., 2011) overlaid on top. Base map provided by the Swiss Federal Office of Topography
23
Figure 2.3. Glacier extents from 1850, 1973, and 2010 near the Theodulpass with retreat values for the Oberer Theodul Glacier (1) and the Unterer Theodul Glacier (2).
2.2
P
RODUCTION OF A GEOSPATIAL DATABASE FOR THEP
ENNINEA
LPSThe methods used in this thesis were largely geographically-based, but had a strong focus on the archaeological and historical components of the project. Thus, georeferenced data had to be collected from each of the three disciplines, i.e. history, archaeology, and geography, and organized into a geographic database so that the data could be compared and analyzed using a common frame of reference. Based on the objectives listed in section 1.2, the necessary data were obtained through the sources described below. These data were used as inputs to the models discussed in Papers II (section 4.1), III (section 4.2), and IV (section 4.3).
24
2.2.1
A
RCHAEOLOGICALI
NFORMATIONA database of all archaeological finds in the canton of Valais was provided by the Etat du Valais, Service des Bâtiments, Monuments et Archéologie (see Table 2.1. for list of fields and sample data). The database contains approximately 900 records ranging from prehistoric to historic time from both high and low elevations. Recent updates from high altitude regions were provided by the Musée d´histoire du Valais. The accuracy of each find ranged from a geographic coordinate to the location of the canton. The information in this database was important for determining the relationships between where archaeological finds were retrieved and the physical characteristics of the environments surrounding sites. An archaeological database for the Italian side could not be obtained due to data restrictions.
Table 2.1. List of fields and a sample of each type of data in the archaeological finds database.
Field Example
ID C1235
Site Mont-Chemin
Discovery type Prospection
X coordinate 575400 m E Y coordinate 105100 m N Z coordinate 1380 m asl Precision Plot Commune Martigny Year discovered 1995 Dating 500-700 AD
Description Notes about the find
2.2.2
H
ISTORICAL INFORMATIONHistorical information was obtained from two sources: archival text analysis of passes and the Inventory of Historical Traffic Routes in Switzerland (IVS) (Swiss Confederation, 2006). Both are described below.
2.2.2.1ARCHIVAL TEXT ANALYSES
Results from an archival text analysis conducted by another project member, historian Muriel Eschmann-Richon, were used as a source of information, additional to the geographic information datasets. For example, historical texts were used to validate the passes selected by the geospatial modelling procedures. If the pass was mentioned as a crossing place throughout history, the chances of finding archaeological objects at that pass were considered to be greater. Based on information given by geographers and archaeologists involved in the project, archival text analysis was conducted on the following high altitude passes: Theodulpass, col d'Hérens, col Collon, Antronapass, Monte Moropass, col de Crête-Sèche, Fenêtre de Durand, Grimselpass, Griespass, and the col de Cleuson. The historical work consisted of a collected of all information
25 relating to the previously mentioned passes for which the information was then verified in a critical manner and summarized into coherent documents for each pass. If the written sources did not provide exact information about the passes themselves or how frequently they were visited, the sources could still be used to demonstrate their regular usage thanks to related documentation linking political tensions or trade disputes between valleys. Thus, the research permitted the reassembly of various types of information sources related to these high altitude passes and improved the evaluation of the written sources which already existed. This analysis was conducted only for the Swiss side of the border.
2.2.2.2IVS DATABASE
The IVS is an inventory of historical traffic routes in Switzerland which are categorized based on their level of local, regional, or national importance for the purpose of protecting and preserving the cultural landscape (Swiss Confederation, 2006; ViaStoria, 2014). In this thesis, the IVS GIS data were used as supplementary information to the information collected during the archival text analysis at the high altitude passes mentioned above. The database was not used as a direct input for any geospatial analyses which will be discussed in the further sections of this thesis.
2.2.3
G
EOGRAPHICALI
NFORMATIONThe GIS layers relating to the physical characteristics of the terrain are listed and explained in the following sections.
2.2.3.1DIGITAL ELEVATION MODEL
Digital Elevation Models (DEMs) are an integral part of any geospatial analysis as they contain elevation information across the terrain. Here, two different DEMs were used. The first was the 25 m resolution DEM from swisstopo (swisstopo, 2014) which was used for all analysis within Switzerland. The second was the 30 m resolution Advanced Spaceborne Thermal Emission and Reflection Radiometer Global Digital Elevation Model (ASTER GDEM) (version 2) from NASA (NASA, 2012) used for cross border analyses between Switzerland and Italy. The use of the ASTER GDEM could have potentially introduced problems in some of the results as the resolution (30 m) is often too low to obtain a high level of certainty on the high altitude passes and ridges which are often smaller than 30 m in width. This DEM was used because a higher resolution one could not be obtained from the Italian authorities.
2.2.3.2GLACIER EXTENTS
Glacier inventories over time were crucial to determining areas of glacial archaeological potential. Inventories from 1850 (Maisch, 2000), 1973 (Paul et al., 2002), 2003 (Paul et al., 2011), and 2010 (Fischer et al., in press) were used to observe glacier change over time and how this could be used to find artefacts or remains. The 1850 and 1973 inventories were digitized from topographic maps thus are dependent on the accuracy of the quality of the maps and the person
26
responsible for digitization. The 2003 inventory, which was used for all analysis involving the Italian glaciers due to a lack of a national inventory, was derived from Landsat TM satellite imagery and the accuracy is assessed to be slightly lower than that of manually digitized outlines from high resolution imagery (Paul et al., 2011). The 2010 inventory was manually delineated from 25 cm resolution orthoimagery and has a very high accuracy.
2.2.3.3LANDCOVER
Landcover layers indicate the type of terrain covering a certain area on the ground (e.g. rock, grass, glacier, etc.). This information was important when calculating walking paths in the Pennine Alps region. The 25 m Primary Surfaces landcover layer (swisstopo, 2014) was used for analysis within Switzerland. The 100 m resolution, 2006 version of the Coordination of Information on the Environment (Corine) landcover layer (European Environment Agency 2012) was used for cross-border studies. The 100 m resolution of the Corine dataset could have led to some discrepancies in the results of this thesis as some of the research was based on the effects of the rock and glaciers landcover classifications on the walking paths across terrains.
2.2.3.4SWISSNAMES
The SwissNames dataset from swisstopo (2014) provides all named locations on the Swiss topographic map at the 1:25,000 scale. This layer was useful when selecting places of interest as inputs to model, as well as for selecting all high altitude passes in the region.
27
3
G
EOSPATIAL
A
NALYSIS
&
G
LACIAL
A
RCHAEOLOGY
In recent decades, technological advances have led to increased access to geographic and spatial information across all research domains and disciplines (Burrough and McDonnell, 1998). The field of GIScience, which is the scientific study of geographic information, was first defined in 1990 and has since grown into a significant research discipline and incorporates countless types of spatial information (Goodchild, 2014). Spatial technology is the all-encompassing term which refers to any technology used for the acquisition, storage, or manipulation of spatial information (Wheatley and Gillings, 2002). Thus, spatial information is acquired using a spatial technology, such as a satellite or a hand-held Global Positioning System (GPS). These spatial data “know” where they are in space because they are linked to a location on the Earth’s surface through the use of a geographic or projected coordinate system (Longley et al., 1999). Spatial analysis is the broad term used to describe the process of analyzing the relationship between geographic data objects, or entities, in space. The type of spatial analysis which relates directly to geographic information and georeferenced data, and is conducted within the GIS environment, will be referred to herein as geospatial analysis (De Smith et al., 2007). GIS is a computer software system used to create, store, and analyze spatially referenced information (Burrough and McDonnell, 1998). It is multidisciplinary in nature as it can link all types of spatial data such as cultural, social, physical, and temporal (see section 3.1.3 for more information about GIS). Data from multiple scales, times, and research areas can be visualised, analyzed, and mapped together. Consequently, GIS methods and techniques have been widely adopted in the field of archaeology as GIS allows archaeologists to obtain a spatial understanding about the relationship that humans have with one another and with their surrounding environment (Kantner, 2008). As glacial archaeology is a relatively new phenomenon, the use of GIS in this field is still in its infancy. To date, only a few studies have integrated GIS or other spatial analysis methods into their archaeological research of frozen environments (Andrews et al., 2012; Dixon et al., 2005; Goossens et al., 2007). The physical environment is the main factor which differentiates glacial archaeology from other types of archaeology. High altitudes and latitudes, where glacial archaeological remains are found, are often an obstacle for geospatial research both from the accessibility and data collection perspectives. In the Pennine Alps, accurate high resolution base data exist which facilitates the geospatial investigation of glacial archaeology in the region.
28
In Paper I (section 3.1), three common geospatial analysis methods used in archaeology, i.e. visibility, locational, and least cost path analysis (LCPA), are reviewed and discussed in terms of how these methods could be used for the specific requirements of glacial archaeology. Additional commentary about the use of geospatial analysis in glacial archaeology is provided in section 3.1.10 as an update to the research that has been conducted since the paper was written.
29
3.1
P
APERI:
A
N OVERVIEW OF SELECTEDGIS
METHODS AVAILABLE FOR USE IN GLACIAL ARCHAEOLOGYStephanie R. Rogers
Accepted June 2013; will be published December 2014
Full reference: Rogers, S.R., 2014. An overview of selected GIS methods available for use in glacial archaeology. Journal of Glacial Archaeology 1, 99–115. doi:10.1558/jga.v1i1.99
A
BSTRACTIn recent years, increased levels of glacial retreat and ice patch melt due to a warming climate in high altitudes have revealed new opportunities to study glacial archaeology. When artifacts become exposed, they are vulnerable to decomposition and should be collected promptly to protect their (pre)historic properties. Therefore, there is urgency to locate potential archaeological sites to avoid the loss of culturally significant remains. Geographic Information Systems (GIS) can be used to help focus or predict potential glacial archaeological study areas based on their environmental and cultural characteristics. Here, an overview of the possibilities for glacial archaeological research using the spatial analysis methods of visibility, locational, and least-cost path analyses (LCPA) in GIS is provided.
Keywords: archaeology, ice patch, glacier, GIS, spatial analysis, visibility analysis, locational analysis, least-cost path analysis
30
3.1.1
I
NTRODUCTIONSome of the most well preserved and complete prehistoric remains have been discovered in frozen environments (Dixon, Manley, and Lee 2005). Glacial archaeology pertains to the study of, and prospection for, these archaeological remains from glaciers, ice patches (sometimes referred to as snow patches in literature), and permafrost. Recent changes in global climate have produced regional warming events and subsequent glacial retreats that promote exposure of artifacts from ice. Because of the delicate nature of these artifacts, and in order to preserve their chemical and biological compositions, there is an urgency to collect these materials as decomposition begins almost immediately after exposure to the environment (Dixon, Manley, and Lee 2005; Andrews and MacKay 2012). In an attempt to locate these valuable materials, spatial technologies and predictive methods can be used to determine archaeologically sensitive areas and to focus search efforts by incorporating geographic (e.g. topography, geology), cultural (e.g. knowledge of previous archaeological remains), and historic (e.g. archival texts and information about the past) parameters into Geographic Information Systems (GIS).
Since Kvamme and Kohler (1988) introduced the field of archaeology to the “enormous” (Sebastian and Judge 1988, 17) archaeological prediction potential of GIS and its methods, most archaeologists have embraced the technology. To date, several detailed reviews highlight the uses of GIS and spatial technologies in archaeology (Kvamme 1999; Ebert 2004; McCoy and Ladefoged 2009). Spatial technologies have clearly benefitted archaeological endeavors. As the field of glacial archaeology is relatively new, and only few GIS-based studies have been conducted (Dixon, Manley, and Lee 2005; Andrews et al. 2012), it is appropriate to highlight the potential of GIS-based methods available to researchers. The purpose of this paper is to provide an overview of the current status of three GIS methods in archaeology: visibility, locational, and least-cost path (LCP) analyses. The aim is to stimulate the use of GIS methods for the specific purposes of frozen environments to potentially discover archaeological remains that will provide invaluable knowledge about (pre)historic cultures that traversed high altitude or mountainous terrains, but first I will briefly introduce the types of glacial archaeological environments and GIS.
3.1.2
G
LACIAL ARCHAEOLOGICAL ENVIRONMENTSIt is important to distinguish the differences between the archaeology of glaciers, ice patches, and permafrost as each represents a different geosystem with distinct dynamics and characteristics that require unique prospection and spatial analysis methods. Ice patches are formed after the gradual compression of many years of annual net snow accumulation that have gradually been compacted into ice (Andrews et al. 2012); whereas glaciers are usually much larger systems that involve inputs and outputs from the atmosphere, oceans, and rivers. Due to large masses of ice and their topographic locations, glaciers have an inherent potential energy
31 that forces ice downslope (Benn and Evans 2010). Unlike glaciers, where archaeological remains older than a few hundred years are not expected to be discovered due to their speed of movement and mechanics (Hafner 2012), ice patches left behind from receding glaciers may yield much older relicts. Permafrost, defined as bedrock, earth, or soil that has been below the freezing temperature of water for at least two consecutive years (Woo 1986), has also yielded significant prehistoric and historic archaeological remains (Rainey 1939). In the last century, glacial archaeology has revealed significant discoveries in high altitude, as well as in mountainous regions (Farbregd 1972; Farnell et al. 2004; Hare et al. 2004; 2012; Dixon, Manley, and Lee 2005; VanderHoek, Tedor, and McMahan 2007; Andrews et al. 2012; Callanan 2012; Hafner 2012; Lee 2012). Perhaps the most substantial frozen archaeological find to date has been a ~5300 year old frozen corpse in the Tyrolean Ötztaler Alps, bordering Austria and Italy that is now known as Ötzi (Seidler et al. 1992; Prinoth-Fornwagner and Niklaus 1994).
3.1.3
A
BRIEF INTRODUCTION TOGIS
A GIS is a computer software system that can be used for data processing, database management, statistical analysis, and a visualization and mapping interface for georeferenced data which represents real-world entities (Longley et al., 1999). GIS data are characterized by their geometric properties, attributes, and topology (how the objects relate to each other in space) (Burrough and McDonnell, 1998). Georeferenced GIS data “know” where they are in space and can be overlaid, calculated, manipulated and analyzed along with other data layers that use the same coordinate system, and are the basis of all GIS analysis. GIS data comes in two structures: vector and raster. Vector layers represent discrete features in space in the forms of points, lines, and polygons, while raster layers represent continuous data, such as elevation. The roots of GIS were established in the 1960s when the process of linking map layers was originally conducted (Tomlinson 1989). Afterwards, GIS grew into a natural resources development platform in the 1970s and 1980s along with the rise of the microcomputer and an increased interest in environmental issues by governmental institutions (Tomlinson 1989). During the past two decades, the use of GIS has increased exponentially into a robust data creation, storage, and analysis platform, and has expanded to incorporate various disciplines, such as earth science, urban planning, civil engineering, law enforcement, medical sciences, as well as archaeological prospection and prediction (Burrough and McDonnell 1998). Before GIS was used for predictive modeling in archaeology, predictive analyses were performed using algorithms and programming on an advanced calculator (Kvamme 1983; 1984; 1985; Verhagen and Whitley 2011). The rise of popularity and accessibility of GIS methods and tools in the 1990s saw more archaeologists embrace the diverse functionalities of the platform’s spatial technologies and predictive models (Verhagen and Whitley 2011) as programs and softwares become more user-friendly, less labour intensive, and more reliable (Kvamme 1999). Spatial
32
technologies can help to determine general or specific areas of archaeological interest in order to save time in the field, or to discover new archaeologically significant locations. These methods can act as a filter to narrow large study areas into smaller, more specific areas with potentially greater archaeological potential (Gietl, Doneus, and Fera 2008). In the following sections, visibility, locational, and LCP analyses will be discussed in terms of how they can be integrated in glacial archaeological research in order to locate potentially significant archaeological remains.
3.1.4
V
ISIBILITY ANALYSISThe use of GIS for visibility analysis in archaeology has been an efficient method for helping to better understand how (pre)historic people gave meaning to, and viewed, space (Wheatley 1995; Wheatley and Gillings 2000; Paliou, Wheatley, and Earl 2011). It has been speculated that humans relate to and interpret their landscapes through visibility, thus the analysis of this social characteristic has been investigated repeatedly in archaeological endeavours (Chapman 2006; Murrieta-Flores 2010). By associating vision with movement, visibility analyses could be beneficial for predicting hunting patterns between settlements and ice patches or for understanding commerce or migration routes over mountain passes. For example, in North America and Europe ice patches were used as refugia by caribou during the warm summer months as an escape from the heat and insects of lower altitudes (Ion and Kershaw 1989). Hunters were aware of these movement patterns and would travel to ice patches in pursuit (Farbregd 1972; Kuzyk et al. 1999; Farnell et al. 2004; Hare et al. 2004; 2012; Dixon, Manley, and Lee 2005; VanderHoek, Tedor, and McMahan 2007; Andrews et al. 2012; Callanan 2012; Lee 2012). The visibility between settlement locations and ice patches were of particular importance for monitoring and tracking game (Lake, Woodman, and Mithen 1998). In the Yukon, Canada, ice patch hunting locations were situated within a three hour walk from the adjacent valley bottom (Hare et al. 2004). Therefore, it could be assumed that hunters moved to ice patches when game were observed. Visibility analyses in glacial archaeology could also be applied in the Pennine Alps between Switzerland and Italy. For thousands of years, people have used high altitude mountain passes in this region to traverse terrains for migration and commercial purposes (Harriss 1970; 1971). Various archaeological remains dated to the Neolithic period have been found in ice patches and near glaciers of this region (Hafner 2012). From the tops of mountain passes such as Theodulpass (3301 m asl) valley bottoms can be seen. Perhaps visions of distant settlements encouraged travel for commerce, protection, or migration. This type of scenario could be of potential interest for future visibility research endeavours in glacial archaeology. In fact, glacial archaeological studies could be the perfect candidate for visibility analyses. For example, glacial archaeological sites are located in frozen environments, thus, high latitudes and/or altitudes where there is naturally little vegetation, which leads to fewer obstructions for visibility analyses. In the Swiss Alps region, the current regional treeline is
33 about 2200 m asl (Berthel, Schwörer, and Tinner 2012), and between 8,700 and 5,000 calibrated carbon years before present (cal. BP) (Wick and Tinner 1997) the uppermost position of the treeline was 2,420 and 2,530 m asl, respectively (Tinner and Theurillat 2003). Therefore, sites located above these levels, which is not uncommon (Hafner 2012), can be assumed to have been free of trees for thousands of years and a Digital Elevation Model (DEM) based on modern landscape topography could be used in visibility analysis as a sufficient representative for the paleoenvironment at high altitudes in the Swiss Alps region.
The two GIS visibility analysis methods, line of sight (LOS) and viewshed are calculated from a DEM. These methods have been used in previous archaeological studies to aid and provide archaeologists with insights about ancient security systems (Gaffney and Stančič 1991), Celtic road systems (Madry and Rakos 1996), prehistoric settlement locations (Jones 2006), the intervisibility between site locations (Ozawa, Kato, and Tsude 1995; Lock and Harris 1996), and the defensibility of sites (Lock and Harris 1996; Smith and Cochrane 2011). LOS, which is the most basic form of visibility analysis, is used for calculating the intervisibility between two locations (Kvamme 1999; Ebert 2004). If no obstructions occur along the viewing plane between two locations the result of the LOS analysis will be positive, and the target can be observed from the original point of interest, or negative if it cannot (Wheatley and Gillings 2002). Viewsheds calculate the visible area surrounding a point of interest. Viewsheds are made up of lines of sight spanning 360 degrees from the point of interest (Kvamme 1999; Ebert 2004), and result in a binary raster that is either visible or not from the point of interest. Drawing from the methods used in previous archaeological studies, similar visibility analyses could be used in glacial archaeology to calculate the LOS or viewshed area from known hunting sites at ice patches to predict where settlements may have been located, or for simulating possible travel routes over mountain passes based on the principle visibility between locations.
3.1.5
L
OCATIONAL ANALYSISLocational analysis in GIS is valuable for identifying patterns in landscapes and ultimately determining archaeological potential of an area (Sebastian and Judge 1988; Kvamme 1999; Ebert 2004; Dixon, Manley, and Lee 2005; Madry et al. 2005; Conolly and Lake 2006; Krist 2006; Howey 2007; Whitley and Burns 2008; Egeland, Nicholson, and Gasparian 2010; Kondo, Omori, and Verhagen 2012; Carleton, Conolly, and Ianonne 2012; Carrer 2013). Uniquely, it considers a wide range of data layers from a variety of disciplines that include biological, cultural, physical, geological, historical, and paleoenvironmental. In glacial archaeological research, Dixon, Manley, and Lee (2005) were first to incorporate locational analysis using a weighted combination of biological, cultural, and geologic raster layers (Table 1) to successfully determine archaeological potential of specific ice patches in Alaska, U.S.A. Factors influencing and restricting the discovery of remains were analyzed separately and then combined into a final
34
cost raster. The locational analysis method which was created in this research helped aid archaeological research in the field. A total of nine historic and five prehistoric sites were located using their method. Similarly, Andrews et al. (2012) used locational analysis along with inputs of remotely sensed data to define areas of archaeological potential in remote mountainous areas in the Northwest Territories, Canada. Their selected criteria (Table 1) allowed for the identification of eight ice patches of archaeological potential that were not previously known, and subsequently resulted in the discovery of throwing-dart, bow and arrow, snares, and faunal remains.
Table 1. List of criteria used in locational analyses in glacial archaeological studies
Influencing criteria Restricting criteria Reference
Habitat ranges (e.g. caribou, sheep, goats) Debris covered ice Dixon, Manley, and Lee, 2005
Mineral licks Ice
Lithics Snow
Trails Barren ground
Proximity to documented sites Slope Aspect Distance
Multi-year ice Areas below 1524 m Andrews et al., 2012 Presence of caribou dung
Altitudes between 1676-1981 m North-facing slopes
Bowl or cirque shaped ice patches Caribou habitat range
Traditional landuse patterns
Figure 1. Process of building a cost raster for locational and least-cost path analyses. Altered from Howey (2007)
In the previously discussed studies, the main goal was to perform locational analysis by creating an archaeological potential model in the form of a cost raster which was the culmination of multiple weighted inputs. To build an archaeological potential model using locational analysis, the first step in the process is the selection of relevant criteria (e.g. Table 1), followed by
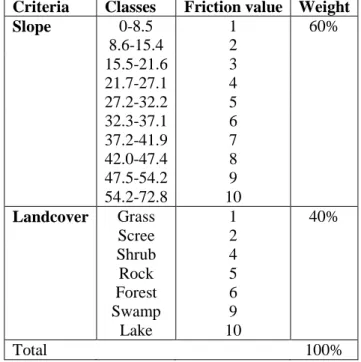
35 reclassification of each criterion into a friction surface (Figure 1; Table 2). Each friction surface is a raster that represents the level of archaeological potential of each particular cell (or pixel) based on the respective criteria. In regard to the basic example in Table 2, the slope and landcover values were originally classified in degrees and landcover type, respectively. After reclassification into integer values, the new friction layers represented the calibrated level of archaeological potential based on the original slope or landcover properties. The probability of finding archaeological remains near steep slopes or in lake or swamp environments is lower therefore the friction values are higher in those situations. All friction layers should use a consistent measurement scale for calibration purposes and to maintain a direct comparison among layers (Howey 2007). For example, criteria should have the same friction value if they represent similar friction levels (e.g. steep slopes and lakes or low slopes and grassy terrain). Next, weights should be assigned to each friction layer to denote their percentage of importance to the total cost raster which should equal 100% in the end. For the example in Table 2, slope was believed to be more indicative to the model than landcover (e.g. 60% versus 40% in the final cost raster) therefore a heavier weight was given to the slope layer. Finally, weighted layers are combined to create the total cost raster with all input layers. In the Dixon, Manley, and Lee (2005) study, a similar process was followed for reclassifying and weighting criteria, but also included the accumulated cost of crossing terrains (see least-cost path analysis (LCPA) section) into each friction layer. In glacial archaeology, further studies using locational analysis could benefit site location and archaeological prospection in the field.
Table 2. Example of reclassifying criteria into friction layers and weights of each layer
Criteria Classes Friction value Weight Slope 0-8.5 1 60% 8.6-15.4 2 15.5-21.6 3 21.7-27.1 4 27.2-32.2 5 32.3-37.1 37.2-41.9 42.0-47.4 47.5-54.2 54.2-72.8 6 7 8 9 10 Landcover Grass 1 40% Scree 2 Shrub 4 Rock 5 Forest 6 Swamp 9 Lake 10 Total 100%
36
3.1.6
L
EAST-C
OSTP
ATHA
NALYSIS(LCPA)
Least-cost paths are based on the assumption that human movement follows the least physically demanding route possible when traveling from one location to another (Gorenflo and Gale 1990; Gaffney and Stančič 1991; Anderson and Gillam 2000; Bell and Lock 2000; Llobera 2000; Hare 2004; Rees 2004; Howey 2007; Egeland, Nicholson, and Gasparian 2010). The topic of movement across terrains and landscapes is a well-studied area of research stemming from various models of geographic theory (Tobler 1993) as movement is a mechanism through which humans organize their landscape (Llobera, Fábrega-Álvarez, and Parcero-Oubiña 2011). Thus, human movement and least-cost paths have recently become a popular research topic in archaeology (Murrieta-Flores 2010; 2012; Verhagen and Jeneson 2012), and could be applied in the field of glacial archaeology to aid in the discovery of potential travel routes across mountainous terrain. LCPA can supplement previous research in glacial archaeology (Dixon, Manley, and Lee, 2005; Andrews et al., 2012) by utilizing the multi-criteria cost rasters in LCPA. This could be particularly interesting for studying movement patterns of hunters between settlements and ice patches, as well as paths which traversed mountain passes for the purposes of migration or commerce. LCPA could be used to simulate travel routes over glaciated passes at high altitudes using known archaeological sites as start and end points, or for determining patterns of movement through different landscapes and environments which can help to reveal important aspects of (pre)historic movement patterns (Murrieta-Flores 2010). When no sites of archaeological potential have been previously identified, LCPA could promote insight about optimal paths or corridors based on terrain alone. For example, to identify hunting, migration, or trade routes over high altitude passes in the Pennine Alps between Switzerland and Italy used by (pre)historic people (Harriss 1970; 1971; Lugon 2011; Hafner 2012).
The calculation of the cost raster, which represents the amount of effort required to cross one cell, is the first step in the LCPA process and can be based on one or more criteria. For example, previous archaeological studies have used LCPA to predict locations of (pre)historic travel routes using cost rasters based solely on the slope of the terrain (Gorenflo and Gale 1990; Gaffney and Stančič 1991; Bell and Lock 2000; Egeland, Nicholson, and Gasparian 2010; Kondo and Seino 2011; Herzog and Posluschny 2011; Verhagen and Jeneson 2012), slope and LOS information (Madry and Rakos 1996), slope and roughness (Anderson and Gillam 2000), or slope, land cover, and waterways (Howey 2007). Although slope is the fundamental component of how people choose to travel across landscapes, it is by no means the all-encompassing decision factor in movement (Bell and Lock 2000; Murrieta-Flores 2010) and natural, social, and cultural features of the landscape should be taken into consideration to find the optimal, or the LCP, to move from one point to another (Lee and Stucky 1998; Howey 2007). Most authors agree that the cost of travel should incorporate multiple criteria into the cost raster, including both isotropic and anisotropic frictions (Bell and Lock 2000; van Leusen 1999). Isotropic frictions
37 represent the cost of moving across a surface with equal friction in all directions (van Leusen 1999; Wheatley and Gillings 2002), for example, landcover. The cost of crossing a certain landcover type is the same irrespective of the direction of travel (Conolly and Lake 2006). Anisotropic modeling incorporates the cost of travel based on variable frictions with respect to the direction of movement (Bell and Lock 2000; Wheatley and Gillings 2002). Slope, which is calculated from a DEM, should be modeled using an anisotropic surface as different frictions are incurred when traveling up, down, or perpendicular to slope (Eastman 2003). The resolution and accuracy of the DEM also play important roles in the model (Herzog and Posluschny 2011). After all relevant factors have been considered and calculated together, the LCP is calculated from the accumulated cost raster which represents the amount of effort required to reach a destination from a defined starting point (Kvamme 1999; Bell and Lock 2000; Ebert 2004; Verhagen and Jeneson 2012) with longer distances and steeper slopes having higher costs. This second step of LCPA is calculated from the cost raster using a software or user-defined algorithm (Bell and Lock 2000; van Leusen 2002; Wheatley and Gillings 2002; Chapman 2006; Conolly and Lake 2006; Herzog and Posluschny 2011; Kondo and Seino 2011; Verhagen and Jeneson 2012). The majority of LCPA studies input Tobler’s (Tobler 1993) equation for walking speed in hilly terrain into GIS to determine the amount of time required for crossing terrains (e.g. Gorenflo and Gale 1990; Whitley and Hicks 2003; Hare 2004; Verhagen and Jeneson 2012). However, it has been speculated that modeling movement based on energy consumption is more efficient due to differing perceptions of time among societies and eras, thus other algorithms have been used to reflect those issues (Llobera and Sluckin 2007; Herzog and Posluschny 2011; Kondo and Seino 2011).
3.1.7
D
ISCUSSIONGIS-based methods can be used to enrich and enhance archaeological investigation and prospection in frozen environments to prevent the loss of potentially significant archaeological remains. In this paper, the three GIS methods of visibility, locational, and LCP analyses were discussed in regards to their relationship to the emerging field of glacial archaeology. Here I will discuss the benefits and possible limitations to these methods, as well as the issue of data and software accessibility in GIS.
Visibility analysis has been useful in various archaeological studies (e.g. Gaffney and Stančič 1991; Lock and Harris 1996; Smith and Cochrane 2011) but has been theoretically questioned due to its inability to incorporate human perceptions in space (Llobera 2003). However, researchers have taken this into consideration and have been developing methods for incorporating the influences of perception into visibility analyses (Llobera 2000; 2003; Murrieta-Flores 2010; 2012) making the method stronger and more applicable to archaeological studies. The DEM used in visibility analysis calculations is another source of criticism. It is argued that a modern