Publisher’s version / Version de l'éditeur:
Technical Note (National Research Council of Canada. Division of Building Research), 1960-05-01
READ THESE TERMS AND CONDITIONS CAREFULLY BEFORE USING THIS WEBSITE.
https://nrc-publications.canada.ca/eng/copyright
Vous avez des questions? Nous pouvons vous aider. Pour communiquer directement avec un auteur, consultez la
première page de la revue dans laquelle son article a été publié afin de trouver ses coordonnées. Si vous n’arrivez pas à les repérer, communiquez avec nous à [email protected].
Questions? Contact the NRC Publications Archive team at
[email protected]. If you wish to email the authors directly, please see the first page of the publication for their contact information.
NRC Publications Archive
Archives des publications du CNRC
For the publisher’s version, please access the DOI link below./ Pour consulter la version de l’éditeur, utilisez le lien DOI ci-dessous.
https://doi.org/10.4224/20386630
Access and use of this website and the material on it are subject to the Terms and Conditions set forth at
Correlation of Sound Absorption Test Methods Northwood, T. D.; Balachandran, C. G.
https://publications-cnrc.canada.ca/fra/droits
L’accès à ce site Web et l’utilisation de son contenu sont assujettis aux conditions présentées dans le site LISEZ CES CONDITIONS ATTENTIVEMENT AVANT D’UTILISER CE SITE WEB.
NRC Publications Record / Notice d'Archives des publications de CNRC: https://nrc-publications.canada.ca/eng/view/object/?id=87777f33-89c0-49d7-8682-f1786889c4b1 https://publications-cnrc.canada.ca/fra/voir/objet/?id=87777f33-89c0-49d7-8682-f1786889c4b1
•
w·セ NATIONAL RESEARCH COUNCIL OF CANADA
•
No .
DIVISION OF BUILDING RESEARCH
e
309'fEClHIN
][CAJL
NOTlE
NOT FOR PUBLICATION FOR INTERNAL USE
APPROVED BY
PREPARED BY ToD. Northwood CHECKED BY
and CoG. Balachandran NBH
May 1960
PREPARED FOR
. SUBJECT
ASTM Committee C-20 on Acoustical Materials
Correlation of Sound Absorption Test Methods
The purpose of this note is to review the present state of knowledge regarding the sound absorption of acoustical materials and to
discuss a program for evaluating absorption test methods. The note will
discuss in particular the significance of the reverberation room measure-ments of sound absorption and their relationship to other measuremeasure-ments
such as acoustic impedance.
It was originally envisaged that the project might include a
consideration of the performance of typical rooms. Certainly one should
keep in mind that the ultimate application of absorption test results is in room acoustics, but the design of ordinary rooms introduces so many special problems that the present program will be confined to a study of
test methods. Let it suffice to say that the most useful quantity in the
acoustical design of rooms is the random-incidence absorption coefficient. The objective of Committee C-20 should be to determine how reliable values of this quantity can be obtained.
2
-Impedance Tube Measurements and the Random Incidence Absorption It is a straightforward matter to measure the normal-incidence acoustical impedance of a small sample of material.
In principle, if the material is "locally reacting", one may then
calculate the random-incidence coefficient for the material.
There are two reasons why this is not a ウ。エゥウヲ。」セイケ general
method for evaluating acoustical materials: (1) many materials
are not locally reacting. For example most suspended ceiling
systems consisting of a perforated surface backed by the
absorptive air space would not meet this requirement; (2) the behaviour of many materials depends on the way individual panels of material are mounted, and the small specimens that can be tested in an impedance tube do not demonstrate these effects.
The first difficulty might be overcome by developing
methods for measuring the impedance at selected angles. Such
methods have been tried experimentally but generally they are applicable only to small samples, whereas departures from the locally-reacting state occur most often when large structures are involved(e.g. suspended ceilings, and systems in which the
absorption mechanisms involve diaphragm vibration). The problem
might be overcome by making measurements on a large panel in a
free field. The largest panel that can readily be dealt with in
most free-field rooms would, however, be small enough that
diffraction effects would introduce a complication. It is
therefore doubted that either technique would be useful as a general practice.
For materials that are locally reacting however, it should be possible to make correlations between tube and
3
-reverberation room results. This possibility is explored in a
later section.
Reverberation Room Correlations
During the period
1951-1953,
a round robin program of,
measurements was carried out under the auspices of A.S.T.M. C-20. Samples of three different types of acoustical material were
carefully prepared and circulated to seven reverberation room
establishments in North America. The results of this program
will not be discussed in detail but a few general comments may
be made. The seven laboratories carried out their tests by
using nominally the same method, although at this time no standard
document existed. As a result there were many important
varia-tions in technique: two laboratories used sample areas smaller
than the customary 12 square feet; several laboratories made an empirical area correction; and at least one laboratory failed to
mask the edges of the samples. It had been anticipated that
the major disagreement would be at the, lower frequencies, but
this was not the case. Agreement was fair at the lower
frequen-cies, but there were large and inexplicable variations at the higher frequencies.
Two of the participants, Riverbank Acoustical
Laboratories and N.R.C. Canada, represented, on the average, the extremes of the observations, and a careful examination was therefore made of the techniques used at these establishments. After a few minor changes an additional series of
intercompari-,
sons were made between these establishments and close agreement
was found. (It is believed that the major discrepancy originally
was due to the fact that the edges of the sample were not masked
4
-has not yet been proceeded with. Further experimental work
with the same samples has since been done by N.R.C. Canada, in connection with the commissioning of a new reverberation room. Close agreement was obtained between these tests and the earlier
comparison. Thus, it appears that Riverbank and N.R.Co obtain
good agreement in sound absorption measurements. This, of course,
dQes not guarantee that the アオ。セエゥエケ being measured is the
"random-incidence sound absorption coefficient".
Beginning in 1959 the I.S.O. Technical Committee 43 sponsored a new round robin series in which a large number of
European laboratories participated. As in the case of the
A.S.T.M. round robin, the results demonstrated forcibly that variations in technique that had been considered unimportant
were in fact very important. It was decided to hold a second
round robin with more careful control of two of the principal variables: the size of sample, and the diffusing system used in
the room. Tests were made on three sample areas: 4m2, 8m2, and
12m2, and under at least three diffusion conditions. In general
the results varied in erratic fashion under minimum diffusion
conditions, but settled down considerably as the maximum diffusion
condition was approached. The recommended diffusion system
consisted of a large number of flat plates, totalling an area equal to the floor area of the rooID, suspended randomly in spaceo This system greatly reduced the spread in results at high
;'fre-quencies. There still appeared however to be a variation with
volume of test chamber and it was surmised that it was more difficult to obtain the reqUired diffusion condition in a small
room"especially with a large sample. A group of laboratories
with small rooms were ruled out on this basis. The five remaining
5
-as will be shown later, the average of the results obtained by the five laboratories is probably very close to the "true" sound absorption coefficient.
At N.R.C. Canada, one of the five remaining partici-pants, an additional series of experiments was carried out in
a search for the cause of the remaining spread in results. These
experiments, which will be discussed more fully later, indicated that alterations in sample position and in the exact arrangement of the "randomly" spaced diffusing panels produced significant
changes in the results. (See Figures
3, 7
and 10). Hence itappears that these matters require further study before a
specification for satisfactory test conditions can be set do\vn. Effect of Sample DimenSions on Measured Absorption
One of the complications of the absorption measurement is the fact that the absorption of a patch of material depends
on its dimensions. If a patch of material is placed on (or set
in) an otherwise highly reflecting surface, the material near the edge of the patch absorbs more than its quota of energy, with the result that the average coefficient for the patch is
increased over the value for infinite area. Thus, strictly
speaking, in the reverberation chamber we measure the absorption
of a particular sized patch of material. The term "absorption
coefficient" implies a quantity which is dependent on the material only and not the dimensions of the sample under consideration, but it is customary to assume that this quantity refers to a patch whose dimensions are large enough that diffraction effects are negligible.
6
-evidence of the area effect since Chrisler's measurements in
1934. Unfortunately, the uncertainties associated with
rever-beration room measurements are such that it has been difficult
to obtain a reliable quantitative relation. Several attempts
have also been made to calculate the diffraction effect. It is
proposed to discuss in particular エィセ calculations made at
N.R.C. a year or two ago. (Reference 1).
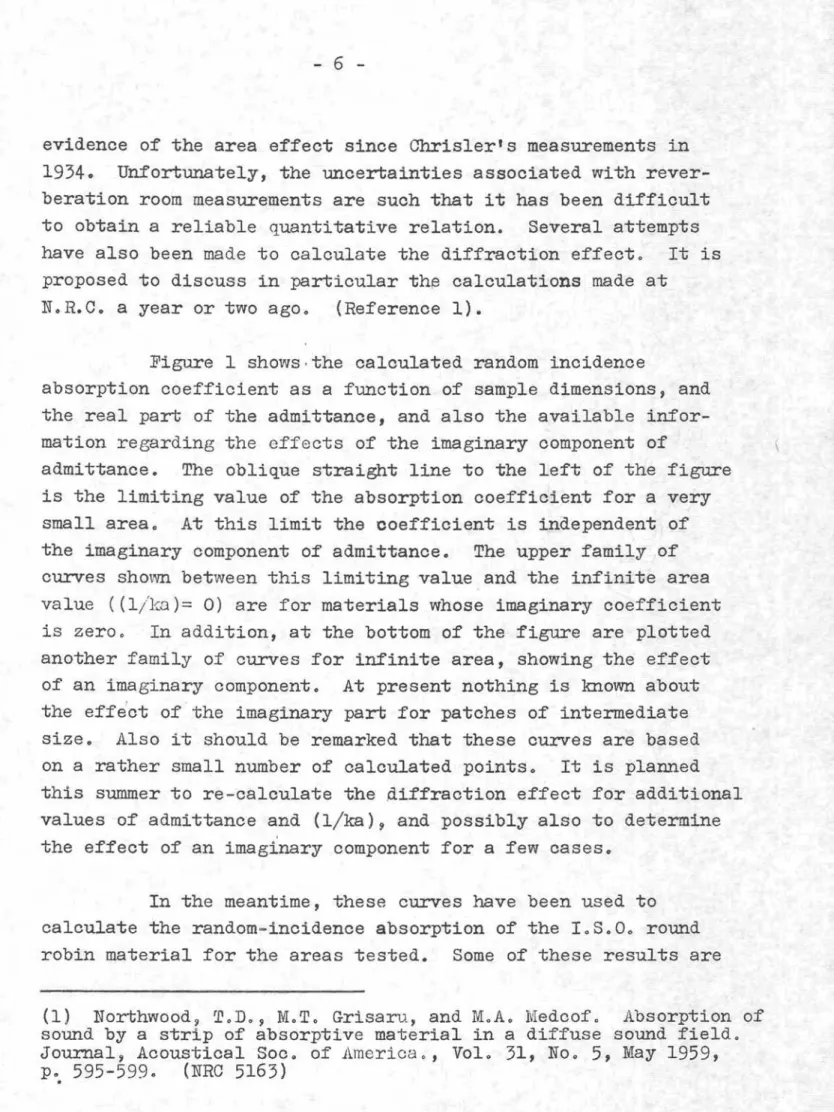
Figure 1 shows·the calculated random incidence
absorption coefficient as a function of sample dimensions, and the real part of the admittance, and also the available infor-mation regarding the effects of the imaginary component of
admittance. The oblique straight line to the left of the figure
is the limiting value of the absorption coefficient for a very
small area. At this limit the coefficient is independent of
the imaginary component of admittance. The upper family of
curves shown between this limiting value and the infinite area value ((l/kn)= 0) are for materials whose imaginary coefficient
is zero. In addition, at the bottom of the figure are plotted
another family of curves for infinite area, showing the effect
of an imaginary component. At present nothing is known about
the effect of the imaginary part for patches of intermediate
size. Also it should be remarked that these curves are based
on a rather small number of calculated points. It is planned
this summer to re-calculate the diffraction effect for additional
values of admittance and (l/ka), and possibly also to determine
the effect of an imaginary component for a few cases. In the meantime, these curves have been used to calculate the random-incidence absorption of the I.S.O. round
robin material for the areas tested. Some of these results are
(1) Northwood, T.D., M.T. Grisaru, and M.A. Medcof. Absorption of
sound by a strip of absorptive material in a diffuse sound field. Journal, Acoustical Soc. of America., Vol. 31, No.5, May 1959,
,
7
-shown in Figures 2 to la, which will be discussed in detail
latero Actually, two calculations have been madeo First the
upper set of curves of Figure 1 were used to determine absorption
coefficient with the imaginary part neglected o This is the upper
dashed curve on Figures 2 to lao The lower dashed curve was
obtained by subtracting from the upper one the infinite-area
correction due to the imaginary part. Provisionally, until
further diffraction calculations are made, it is assumed that the true value will be between these two calculated values (i.e. it is assumed that for finite areas the imaginary component has an effect somewhere between the small-area and infinite-area value) •
Reverberation Theories
In reverberation room measurements and in acoustical design, the Sabine reverberation formula is almost universally
used. The view is usually held that the Norris-Eyring formula
is the correct one but that the Sabine formula is an adequate approximation, considering the other uncertainties of room
acousticso In a recent paper however, RoW. Young takes the
view that the Norris-Eyring formula is applicable only for a
room in which the boundaries have uniform acoustical properties.,
In the reverberation room, which represents a drastic departure from this condition, it is usually assumed that each surface
material absorbs in proportion to the product of its area and
its absorption coefficient (apart from diffraction effects)o Young argues that this is an unwarranted assumption and suggests
that the geometric ュ・セョ assumed in the Millington-Sette formula
is just as probable. He goes on to point out that the Sabine
formula is similar to the Millington-Sette formula except that
...
8
-The theory is offered that the various devices used in a reverberation room to achieve a diffuse sound field might
alternatively be regarded as devices to ensure a continuous
redistribution of energy among the various components of the sound
field. This in turn should ensure that each part of the boundary
receives and absorbs its fair share of the total energy. ThuS,
while we have been struggling to achieve a ltdiffuse sound field", we have perhaps inadvertently provided a situation in which the arithmetic averaging procedure is legitimate.
The reasons for using the Sabine equation are still cogent, but it will be shown that absorption data calculated by the Norris-Eyring formula agree better with other evidence than the Sabine results.
Experimental Results
The attached figures present in summary the results of the second I.SoOo round robin in which tests were carried out by five laboratories on batches of the same material, Silliano
(This material is similar to Fiberglas Type P F commonly used
in North America) 0 It is expected that detailed information
about these tests will be published shortly by Professor Kosten,
but in the meantime details will be given for only our own
.
.establishment, NoR.C. Canada. It may be taken that the effects
observed at NoRoC. typify those found generally.
The IoS.Oo results are considered particularly valuable (as compared, for example, to the AoSoToMo round robin,) because the experimental conditions were more uniform than in any
previous interc omparison0 In particular the effect of diffusing
9
-maximum diffusion has resulted in a series of measurements that
can be compared with impedance tube measurements. The effect of
diffusion is illustrated in Figure
7.
It will be noted that thestandard rotating vane system at NoR.C. Canada produced results substantially lower at high frequencies than those obtained with
a diffusion system consisting of a multitude of plates distributed
through space. Our tentative conclusion is that our standard
condition is inadequate, although no change will be made for standard tests until the matter is considered by other testing
laboratories in North Americao Since our results agreed with
Riverbank ーイ・カゥッヲゥウャケセ it is surmised that a similar effect will
be observed at Riverbank0
In Figures
4, 5
and 8, the individual and averageresults obtained in the five IoSoOo laboratories are plotted,
together with the two calculations referred to previously. It
will be seen that there is fair agreement between the average
reverberation room measurements and the calculated values o The
former are slightly higher than the calculations at the upper,
frequencies, but this discrepancy would largely disappear if the Norris-EYring reverberation formula were used instead of the
Sabine formula. The difference is shown in Figures 2, 6 and 9,
in which the N.R.C. results gre calculated by both formulae.
The spread in individual results seen in Figures
4,
5 and 8 may be compared with the spread observed at N.R.C. for
several variations within the prescribed maximum-diffusion
condition of test (See Figures 3, Wセ and 10). These included
two sample positions and three arrangements of the diffusing
plates. Sample Position 1 was near one corner of the room
10
-was in the middle of the room. In diffusing conditions a and c
the panels were kept about 2m above the floor (and above the
sample); in condition b they approached within セュ of the floor.
The results reported to I.S.O. were for sample Position 1, diffusion condition a.
Further correlations are planned, with studies of
different diffusion arrangements and with other types of absorbing
material. One additional result is shown in Fig.
II.
Thematerial used for this test was one of the A.S.T.M. round robin
materials, a perforated sugar cane fibre tile,
It"
().2 cm) thick.Comments
Measurements have been presented of sound absorption
coefficients obtained under carefully controlled conditions in
five reverberation rooms. These have been compared with
cal-culations based on impedance tube measurements and the available information regarding the diffraction effect associated with a
small sample. The average of the five sets of results is found
to agree closely with the calculated values.
Although the average of the five establishments provides good agreement with calculations, there are still large
devia-tions among the individual laboratories. From auxiliary
measure-ments made at NoR.C. ,Canada, it appears probable that these
fluctuations are related to the diffusing system. It is
necessary therefore to determine the cause of these deviations and to find a method of prescribing the diffusion condition so that true values will be obtained.
,
11
-It follows that conditions at the edges of a sample are also of importance, since the calculations used above are based on the assumption that the face of the sample is in the same plane as the surrounding surface (which is assumed to be perfectly
reflecting). Huntley has suggested that if the sample were
suspended in space the area effect would be an inverse one, as
compared with the effect obtained when the sample is against a
reflecting surface. It is probable that this condition would
be amenable to calculation. But many samples that are commonly
tested in the laboratory constitute an intermediate condition
which certainly could not be calculated. Typical
suspended-ceiling systems, for example, stand 30 em or more above the
mounting surface. It would be of interest to carry out
diffrac-tion studies with a material such as Sillan (on a rigid backing)
at various levels from the floor. These would at least provide
experimental evidence regarding the dependence of the diffrac-tion effect on this variable.
IneVitably, the area effect calculation will be rather uncertain for many types df mateTials, either because of the effect mentioned aoove or because the material is not locally
reacting. The calculations will probably give results that are
satisfactory for field use but not very satisfying to the
testing laboratory, since the objective is to ュ。セ・ a precision
measurement. It is suggested therefore that wherever possible
the sample area should be a standard value and that the published
results should be the values for this standard area. The
infinite-area calculations might also be made and ,reported, but it should be made clear that this is an approximation.
\,
12
-should be avoided, especially when referring to measurements
made on
a
small sample since, strictly speaking, one cannotsimply multiply an area by a coefficient to obtain total
absorptiono Moreover, エセ・イ・ is the usual problem of explaining
values greater than unity.
An
alternative, suggested byR.K. Cqok, is to quote the "absorption cro'ss-section" of the
standard sample. Eventually, however, something equivalent to
a coefficient is required, and the arguments against continuing to use the term seem academic.
In North America the accepted standard area is 9 feet
by 8 feet {2.74m by 2.44m)o In the I.S.O. a standard area is
just being decided upon, and a size approximately the same as a North American value could be adopted with no inconvenience
to European laboratories. For example, a sample 2m by 3 m would
have a value of
(l/ka)
very close to the North American value.A slightly better correspondence could be obtained with a slight modification of one area or the other, without seriously
impairing; continuity in the North American results.
i
Apart from this there are two other factors to consider
in settling on a standard area. First, the larger the area,
the less important the diffraction correction; but the variation is so gradual that this is not an important consideration.
Second, the larger the area, the larger エセ・ room necessary to
make a reliable measurement. The I.S.O. round robin indicated
provisionally that a number of European laboratories are "too
smalltr
, under present test conditions. It is possible that
further diffusion studies might permit a lowering of the
mini-mum admissible room volume, but one of セィ・ limiting factors will
1-2 セ z w o 1-0 1L. 1L. W O' o z o セ a. セ 0-8 (J) m <t w o z w o セ 0-6 セ o o Z <t 0:= 0-4
o
T
7
GUNjセ
/
v-I」Mセ
d.: 00OOOセ
lij//
V
L---r---.
-I r---/WI
IV
Mッセセ
7
V
v-
-
r---,WI
1/1
セセ
セセNッ
-
セr-=::::::-Tf/;
vセxᆪvM
-3V--
.-
[....-----
----
-
t-::::::
セ
-I -2 -4 / " セVII.
セ
Oセ
Vf1J
セ
V
fill;
V
&
WI
ADMI TTANCE RATIO -11
=a
+t
セ
II /I
V
_I=
セ
(b+
c) = .54·7(b+c)
(b
c, IN ME.TRE.S)セ
セ、 21\be
fbe
'
179(b+c.)
(b,c
IN FEET)-W
f
be.
W
0-2 0-4 0-6 0-8 1-0 FIGURE IRANDOM INCIDENCE ABSORPTION COEFFICIENT FOR RECTANGULAR PATCH OF 01 MENS IONS b 8
c
I' 4 0 イMMMNNMMMMMMNNMMMMMMNLNNNNMMMBGtBBBBBMMMNNLMMMMMMMMMNMMセ ISO SILLAN 4m 2 1·20
•
0•
ISO AVERAGE I,----
0 .., ..-0---::: ... • I..,
...
-
-
....
" セ I...
,., -... ...0...z
,
r ........
" LLJ 1'00 I I....
" () I I ""-
,
I I.LOセcalculated
I.LHセ
LLJ NEGLECTED) 0 () , I O·SO I I Z , I 0 I 'セ
I ' l- I I a- I Ia:
/,,---(
CALCULATED, INFINITE-0 WITHen
0-60 I I AREA ; CORRECTION) m / I <t I I / I 0 I/ / Ie
zv
I :::> / 0 Ien
0'40 I I LEGEND:•
SABINE FORMULA 0-20 0 EYRING FORMULAO ..._"--
"--
..L.- ..J..- - ' - - ...L---' 125 250 500 1000 FREQUENCY%
2000 4000FIGURE
2
ABSORPTION
MEASUREMENTS
AT
ISO
ESTABLISHMENT
NO.
II
(NRC)
I'
40 , - . . - . , , . . . . - - - - . . , . - - - r - - - . . . . , . . - - - - . , . - - - - . - - - i ISO SILLAN - 4 m 2 1'20o
c
o
o
LEGENDDIFFUS ION CONDIT ION'
c
Aa
fJ. ba
a
SAMPLE} I 1-POSITION 2 0 r- - - --JlL\...
/ 'fJ. ,..__... ,..-'
/...,.,
..,.,"'"
_
...-,
I ,.."'" , I ... / / ... I / I / I II /
o
I II /
rJ I / fJ./ / I / / / / I / I I I I I I / I I I 1 /II
II
cr
l fJ. 1-00 0'20 0'80 0·40 0'60 I-Z W 0 - tl-ll.. W 0 0 z 0I-a.
n:: 0 en en <l ce
z セ 0 en O'---oL..-_ _----l'--_ _.-..L ---& ...L. ...L._--' 125 250 500 1000 FREQUENCYセ
2000 4000FIGURE
:3
ABSORPTION
MEASUREMENTS
AT
ISO
ESTABLISHMENT
NO.
II (N R C )
1'40
エMMMNNMMMMNMMMM⦅⦅⦅⦅NセMM⦅⦅⦅⦅NMMM⦅⦅イMMMNNNNNNNNLNMNNNNNNNNLN
ISO SILLAN -4 m2 A 1·20 CALCULATED 0·80 LEGEND: • ESTABLISHMENT NO. Io
ESTABLISHMENT NO.8 • ESTABLISHMENT NO.9o
ESTABLISHMENT NO. II A ESTABLISHMENT NO. 12 AVERAGE•
iMMMMMMNセ( i:
NEGLEC TEDIセi
... - ...セセセ
[J5
a ... ""
"'::::-'-0 I ... "" " I I 0 ... , I ' ... ;' I ... I I I / I I• I
OセMMH
CALCULATED, WITHINFINITE-I INFINITE-I
0" I
AREAk.
CORRECTION) , IS
o
I I I IA/ I I I I / / I / I / I I I / 1 1/• II
II IIC
"II
0·20....
セ
1·00 (,) i:L. lL. IJJo
(,) z o セa..
a:::o
セ 0·60«
o
z
::> o en 0·40 4000 2000 500 1000 FREQUENCYセ
250 125 O...---.a...----L.--_---JL...-_ _---JL...-_ _---I - - - I _ - - - 'FIGURE
4
ABSORPTION
MEASUREME.NTS
AT
ISO
FIVE
LARGE
REVERBERATION
ROOMS
-.
1·40 1 1'I
II
I
ISO SILLANWセMXュR
1·20-
-fJ. fJ. fJ. 00•
0'ft---"-i-....
.Q. セ.-
I " - - --.... 0 z ""--
... """"--1IJ 1-00---
II . . . ..... " -:::::.----
-() 1 / ....•
--..
-
u.. 1 / u.. 1 I 1IJ / / 0•
/ / () 0,80 f--/
/ /-Z 0 1 I
-
o
1 1.-
n. - - I / LEGEND: 0:: / 10 .fJ. /
•
E STA BLISH MENT NO. ICf) 0,60 f -/01
-m //
0 ESTABLISHMENT NO.8 <l I I 0 I I•
ESTABLISHMENT NO.9 z I /::> I I 0 ESTABL I SHMENT NO. II
0 0·40 II
-Cf) I -II • II fJ. ESTABLISHMENT NO. 12 I{ AVERAGE I; [f CALCULATED 0·20 I - - 0•
fJ. 0I .
125 I 250I
I
500 1000 FREQUENCYセ
I
2000-I
4000 FIGURE 5ABSORPTION MEASUREMENTS, AT ISO FIVE LARGE
'
I· 40 LNNNNNNNNMMMLイMMMMMッイMMMMMイMMMセMMM⦅⦅L⦅MMM⦅⦅L⦅M⦅⦅N ISO 51LLAN - 7
x-
8m 2•
o
LEGEND: • SABINE FORMULAo
EYRING FORMULA ISO averageセ セ .... - > , -'/- ,,0__ ...._ , •1°
"'"
""'....
--_-
---1 . . . . 0- -""'::.._ セ....
Mセ 'I / "Oセcalculated
(E
NEGLECTED) I IS
I / I I I I"
/ I I I I / I: / ' - - - ( CALCULATED, WITH
INFINITE-A / / AREA ; CORRECTION) / / / /
セ
1·20 0·20....
z 1'00w
u Li: IJ.. W 0 u 0·80 z 0-
t-o.. £t:: 0en
0·60 m«
c z ::> 0 0'40en
0"----.11....---1---'---'---"---"----' 125 250 500 1000 FREQUENCYセ
2000 4000 FIGURE 6AVERAGE OF 5 ABSORPTION MEASUREMENTS ISO
I· 40 MMMMMMMMMMMMMNNMMMMMMセMMMNNNNLNNNNNMMMMMMML ISO 5ILLAN-
WセM。ュR
1·20 "-セ 1·00"","
"
z
"
w r"'"-
/ U / X-
/ lL."
lL. W ... 0o·ao
u ...z
"'-0 X -セ a.. ... 0::"'X
0 0·60 (/) LEGEND m«
DIFFUSION CONDITION cBARE
z
:J ab
c
VANEROOM
0 0·40セi
(/) SAMPLE}-
Dv
6 POSITION 0•
•
•
X 0·20a
125 250 500 1000 FREQUENCYcis
2000 4000 FIGURE 7ABSORPTION MEASUREMENTS AT NRC FOR VARIOUS ARRANGEMENTS OF DIFFUSERS AND SAMPLE
'. ,. 4 0
,-t"-_---_---.,---r---r----"""T"""-...,
1
I
I
I
I
1
ISO SILLAN 12m2 • 1·20 r -•
-NO. I NO.8 NO.9 NO. II NO. 12 LEGEND: • ESTABLISHMENTo
ESTABLISHMENT • ESTABLISHMEN T C ESTABLISHMENT A ESTABLISHMENT AVERAGE 0·80 --A CALCULATED A Cセ
セ
1.00 __ (e
NEGLECTED)QiイMMMMSゥMMMMZMZNMMセ
C _S
セON
"."."'''
MMMセMM
_
/ BNセ -" , ' -" I I • I I I / / / I I I I /• / OセH CALCULATED, WITH
INFINITE-t /
AREAセ
CORRECTION1
I I/tf
I / I I / I I I / I / I I I / I . / I I I I :.oc-0·20 セ • A t-Z lIJo
li: L&. Wo
o z o - t-o.. 0:: oen
0.60--m«
oz
:::>セ
0·40セ
o
-...--.L.1_ _
----Io'
" " ' - - I_ _...&..I_ _----a.I ...1-125 250 500 1000 2000 4000
FREQUENCY
セ
FIGURE 8
ABSORPTION MEASUREMENTS AT ISO FIVE LARGE
1·40 イMMMMNLNMMMMNLNMMMMセMMML⦅MMMセMMMNNNLN⦅MNNL ISO SILLAN- 12m 2 1·20 0-20
•
•
LEGEND: • SABINE FORMULA o EYRING FORMULA•
e;.;;;.=.;;;",;;;.,o-cr - __,,/'
--
...
MMNNZMM⦅セ " , --::::.--; "--::::.--; MMセ...
/ Mセ / " , Iイセcalculated
HセneglectedI
? /S
セ I 'I I 'I I I I 'I I/ ' - - - (CALCULATED, WITH INFINITE-/ AREA
f::
CORRECTION) A I .セ
セ I /, I I I I 1'1 I I I" I ISO AVERAGE 1·00o·so
a
z :::>セ
0-40....
Z L&J (,) -ll.. ll.. W o (,)z
o
-....
0-n:
o en 0.60 m <Xo
" - _ . & . . . - .&...- ..L-... ..r...- ..r...- ..Io-_ _ _125 250 500 1000
FREQUENCY
セ
2000 4000
FIGURE
9
ABSORPTION
MEASUREMENTS
AT
ISO ESTABLISHMENT
1·40
e'
ISO SILLAN- 12m2 1·20,
0 0 lJ. lJ. セ lJ.....
o __
MMセMMM"-..
II rz
1·00If"
/
,,--=-:..:-
MMセ
セ
!!:!I. /
---.
() /---
/ / / I.L /,"
I.L W / / 0 / / ( )I
/ 0·80I· /
z
0I
/....
c._I
I
セ,
/a::
0o /
Ien
0·60 I lJ. I m <t I ,I 0 / Iz
II
/ :>II
0en
0·40 I I LEGEND I III
DIFFUSION CONDITION I I 01b
CセM
a
0·20 ADSAMPLE}
II-
e
A POSITION 2 0•
,
OL--_.L..-_ _---L ...L - J - - ' - - . . . L - - - - I 125 250 500 1000 FREQUENCYセ
2000 4000FIGURE
1'0
ABSORPTION
MEASUREMENTS
AT ISO
ESTABLISHMENT
..
I, 40 イMMNLNNMMMMセMMMセMMM⦅イ⦅MMM⦅イ⦅MMMMMM⦅⦅イ⦅BMセ CELOTEX C-4 -72 FT 2 (6'69m2 ) 1·20 ROOM MEASUREMEN DIFFUSIO N CONDo 2 SAMPLE POS. 2"
I \ I i , \ II ' \ 'I ' \ I I \ II ' , II " ' , II ' ,,
\ \ I 'I \ \, II " II • " II \ \ II \\ II \\ 'I \\ NセM 'I \\ 'I セ I セ II \\ II \\ \--I セセセセセ I セセセセ 1/ /:), CALCULATEDHセneglectedI
セZセO
'l
///1
(CALCULATED, WITHINFINITE-// AREA ; CORRECTION
J
0·20 t-Z 1·00 w -U I.L. I.L. W 0u
0·80z
0 t-o. a:: 0 (/) 0·60 m <X 0 Z ::> 0 0·40 (/) O " ' - - - ' - - - - -...MMMMMiNMMMMBMMMMMNNNlMMMMMMGMMセFIGURE
II
ABSORPTION
CORRELATION
FOR
CELOTEX
C-4
NRC
OTTAWA
125 250 500 1000
FREQUENCY