HAL Id: hal-03229032
https://hal.archives-ouvertes.fr/hal-03229032
Submitted on 26 May 2021HAL is a multi-disciplinary open access archive for the deposit and dissemination of sci-entific research documents, whether they are pub-lished or not. The documents may come from teaching and research institutions in France or abroad, or from public or private research centers.
L’archive ouverte pluridisciplinaire HAL, est destinée au dépôt et à la diffusion de documents scientifiques de niveau recherche, publiés ou non, émanant des établissements d’enseignement et de recherche français ou étrangers, des laboratoires publics ou privés.
Synchronization between Keyboard Typing and Neural
Oscillations
Joan Duprez, Mtichel Stokkermans, Linda Drijvers, Michael X Cohen
To cite this version:
Joan Duprez, Mtichel Stokkermans, Linda Drijvers, Michael X Cohen. Synchronization between Keyboard Typing and Neural Oscillations. Journal of Cognitive Neuroscience, Massachusetts Institute of Technology Press (MIT Press), 2021, pp.1-15. �10.1162/jocn_a_01692�. �hal-03229032�
Synchronization between Keyboard Typing
and Neural Oscillations
Joan Duprez
1,2, Mitchel Stokkermans
2, Linda Drijvers
3,4, and Michael X. Cohen
2Abstract
■ Rhythmic neural activity synchronizes with certain rhythmic behaviors, such as breathing, sniffing, saccades, and speech. The extent to which neural oscillations synchronize with higher-level and more complex behaviors is largely unknown. Here, we inves-tigated electrophysiological synchronization with keyboard typ-ing, which is an omnipresent behavior daily engaged by an uncountably large number of people. Keyboard typing is rhyth-mic, with frequency characteristics roughly the same as neural oscillatory dynamics associated with cognitive control, notably through midfrontal theta (4–7 Hz) oscillations. We tested the hypothesis that synchronization occurs between typing and mid-frontal theta and breaks down when errors are committed. Thirty healthy participants typed words and sentences on a keyboard without visual feedback, while EEG was recorded. Typing rhyth-micity was investigated by interkeystroke interval analyses and by
a kernel density estimation method. We used a multivariate spa-tial filtering technique to investigate frequency-specific synchro-nization between typing and neuronal oscillations. Our results demonstrate theta rhythmicity in typing (around 6.5 Hz) through the two different behavioral analyses. Synchronization between typing and neuronal oscillations occurred at frequencies ranging from 4 to 15 Hz, but to a larger extent for lower frequencies. However, peak synchronization frequency was idiosyncratic across participants, therefore not specific to theta nor to mid-frontal regions, and correlated somewhat with peak typing fre-quency. Errors and trials associated with stronger cognitive control were not associated with changes in synchronization at any frequency. As a whole, this study shows that brain– behavior synchronization does occur during keyboard typing but is not specific to midfrontal theta. ■
INTRODUCTION
In the past few decades, some sensory processes and behaviors have been shown to be rhythmic. For instance, visual processing oscillates between low and high percep-tion stages ( VanRullen, 2016), and behaviors such as speech (Aiken & Picton, 2008), although not strictly rhyth-mic per se, have also been associated with periodic tempo-ral properties (Rosen, 1992). The phase of rhythmic neutempo-ral activity (i.e., neural oscillations) has been linked to sensory and motor processes (Drewes & VanRullen, 2011; Gross et al., 2001), and some studies have reported that neural activity can become temporally aligned with rhythmic behaviors (Haegens & Zion Golumbic, 2018; Kösem et al., 2018; Zoefel & VanRullen, 2016; Calderone, Lakatos, Butler, & Castellanos, 2014). On the other hand, neural activity can also provide temporal constraints to behaviors and several cognitive functions have been pro-posed to be inherently rhythmic in the sense that they are organized according to the timing of neural oscillations. Notably, this has been shown for attention (Fiebelkorn & Kastner, 2019) and cognitive control (Duprez, Gulbinaite, & Cohen, 2020).
Most of the evidence of synchronization between behavior or cognitive functioning with brain oscillatory activity have been inferred from simple experimental psy-chology tasks. Although the studies using such paradigms are very informative, they lack the complexity of real-life behaviors. Thus, it is important to understand whether neural oscillations and behavior synchronization extend to more naturalistic behavior. However, such naturalistic behavior should also comply with the same experimental rigor required in usual tasks, leading to difficulties in finding a good compromise between rigor and behavioral relevance.
Fortunately, technological advances also led to the emergence of newly common human behaviors. A good example of such recent and widespread behavior is keyboard typing, which is omnipresent in our modern societies, whether it is expressed on personal computers, laptops, smartphones, or tablets. Studying this behavior has several advantages such as an ease in laboratory use (simultaneous recording of behavior and EEG with every stimulus and keypress as an event marker) and in finding performant typists. Furthermore, some evidence suggests that typing is also a rhythmic behavior with mean interkey-stroke intervals (IKIs) of approximately 135 msec corre-sponding to a 7-Hz typing frequency, which is in the theta range ( Yamaguchi, Crump, & Logan, 2013). More im-portantly, regarding brain activity, recent results suggest
1
University Rennes, France, 2Radboud University Medical Centre, Nijmegen, The Netherlands, 3Radboud University, Nijmegen, The Netherlands, 4Max Planck Institute for Psycholinguistics, Nijmegen, The Netherlands
that typing has similar neural substrates to cognitive con-trol and error monitoring. Indeed, typing errors are associ-ated with stronger midline frontal theta power (Kalfaoğlu, Stafford, & Milne, 2018), which is commonly reported in more standard cognitive control tasks (Cavanagh & Frank, 2014; Cohen & van Gaal, 2014).
In this study, our goal was to test the hypothesis that keystrokes during typing behavior would occur at consis-tent midfrontal theta oscillatory phase, which would indi-cate synchronization between keyboard typing and midfrontal theta activity. We also expected that typing errors would be associated with a decrease in phase con-sistency over keystrokes, thus showing a decrease in brain–behavior synchronization during typing. To this end, we used a typing task that required participants to type both real words/sentences, or pseudowords/sentences, in which case the need for cognitive control would be greater. We first focused on showing rhythmicity in typing and then used frequency-specific spatial filters based on a mul-tivariate guided source separation method (generalized eigen decomposition [GED]; Cohen, 2017) to investigate synchronization between typing and neuronal oscillations.
METHODS
Participants
Thirty healthy native Dutch speakers (16 women, 14 men, mean age = 22 years old,SD = 3.12 years) were recruited for this study through the Sona recruitment system of the Donders Institute for Brain, Cognition and Behavior and were compensated withA20 or course credit. Selected participants self-reported being able to touch-type. Twenty-six participants were right-handed, and eight par-ticipants reported using four to eight fingers instead of 10 for typing. We chose not to exclude left-handers because typing requires both hands, and we wanted to sample from the general population. All participants signed writ-ten informed consent, and this study was approved by the Donders Institutes’ ethics committee. Following the pre-processing steps detailed below, three participants were excluded from the analyses.
Task
The typing task was based on the one used in Kalfaoğlu and Stafford (2014). Participants were seated in front of a 24-in. IRT monitor and had to type the presented stimuli on a Dell qwerty-keyboard as quickly and as accurately as possible. In different blocks, we randomly presented real words, real sentences, pseudowords, or pseudosentences. Participants were instructed to type what they saw without looking at the keyboard and to press the enter key when finished. An intertrial interval of 2 sec separated subse-quent trials. Each block lasted 5 min. There were also five “free typing” trials during which participants responded to open questions about their activities the day before, of
book/film plots, for 3 min with no other restrictions than typing correct Dutch sentences. These trials were not in-cluded in the analyses. No visual feedback was provided to the participants during typing. Participants were observed via a video camera and verbally instructed not to look at the keyboard when needed. The task was programmed in MATLAB using functions from Psychtoolbox (Brainard, 1997) to integrate the stimuli with the hardware and to send triggers for each keystroke to the EEG acquisition, with high temporal precision.
Participants were instructed to correct typing errors by pressing the backspace key until they recall being at the position of the error. They were also informed that punc-tuation and capital letters could be ignored. Throughout the task, the average typing speed of the participants was calculated and used as a threshold. Should they type below the threshold, the participants would be asked to type faster (except in the free typing condition) by a “Type faster” message followed by a 1-sec intertrial inter-val. Stimuli consisted of 200 real words (average of 10.35 characters,SD = 2.5), 200 pseudowords (average of 9.0 characters,SD = 1.8), 100 real sentences (average of 60.8 characters including spaces,SD = 13.6), and 100 pseudosentences (average of 59.6 characters including spaces,SD = 9.6). Pseudowords were taken from a pseu-doword generator ( Wuggy; Keuleers & Brysbaert, 2010), and sentences were taken from Drijvers, Mulder, and Ernestus (2016). Pseudosentences were created by replac-ing words with pseudowords (from the same generator) in the sentences. Given that we had no independent typing task, we estimated participants’ typing abilities based on the sentence condition. Typing speed was calculated as the number of words per minute. Participants had an aver-age of 31.8 wpm (SD = 6.5) when speed was calculated on five-letter words and higher, 46.6 wpm (SD = 8.9) when calculated on four-letter words and higher, and 74.6 wpm (SD = 14.2) when calculated on all words. Overall, 79.9 % (SD = 7.3) of words contained no error in the sentence condition and there was 94.6 % (SD = 1.9) correctly typed characters.
EEG Acquisition and Preprocessing
EEG data were acquired at 1000 Hz using a cap with 64 active electrodes placed according to the“M10” equidis-tant electrode layout. Four additional electrodes were used to record horizontal and vertical eye movements. The EEG signal was amplified by BrainAmp amplifiers driven by a BrainVision Powerpack (Brain Products GmbH). The signal was recorded using the Brain Vision software. Keystrokes were recorded as event markers in the EEG signal by sending transistor–transistor logic pulses. For each participant, electrode locations were re-corded as Polhemusx-y-z coordinates and were further im-ported in EEGLAB (Delorme & Makeig, 2004), which was used for all further preprocessing steps. EEG data were fil-tered between 0.5 and 40 Hz. Continuous EEG was visually
888 Journal of Cognitive Neuroscience Volume 33, Number 5
inspected to identify bad channels, which were removed and interpolated. Three participants were excluded be-cause of excessive EEG artifacts, leaving 27 participants for further analyses. After these steps, EEG was rerefer-enced to an average reference. Independent component analysis was performed to identify artifacts such as eye-blinks using thejader function of EEGLAB (Delorme & Makeig, 2004). Visual inspection of the components’ topog-raphy, activity, and power spectrum was performed to iden-tify bad components that were then removed from the signal (1.3 components on average were removed). Specific ASCII code marker numbers were used to track im-portant events, such as stimulus display, letter keystrokes, backspace presses, and return button presses.
For all subsequent analyses, trials were subdivided into four conditions: words, sentences, pseudowords, and pseudosentences; and into three trial outcomes: correct trials, corrected errors (which were defined by the occur-rence of a backspace press), and other errors, which con-tained all uncorrected errors that arose from character omission/addition, wrong character typed, missing words in sentences, and so forth. We dissociated corrected from uncorrected errors because we expected behavioral and EEG activity changes associated with error awareness (Kalfaoğlu et al., 2018). Punctuation errors were not in-cluded in the analyses. Importantly, for the RT analyses, trials were labeled as an error when they contained at least one error. In the IKI and EEG signal analyses, correct words in error (pseudo)sentences were treated as correct in the analyses. However, as long as a (pseudo)word contained at least one error, the entire word was treated as an error.
Behavioral Analyses RT and Accuracy
RT was defined as the time between stimulus presentation and the first keystroke. All RTs faster than 200 msec or slower than 3SDs from the mean were excluded from further analyses. RTs were then compared as a function of the linguistic nature of the stimuli (real or pseudowords/ sentences), the type of stimuli (words/sentences), and out-come of the trial (correct, corrected error, other error). All statistical analyses were done using R ( Version 3.6.1; R Core Team, 2019). We performed linear mixed-model analyses on participant-averaged Box Cox-transformed RT using thelme function of the {nlme} package (Pinheiro, Bates, DebRoy, Sarkar, & R Core Team, 2020) with a 2 (linguistic nature) + 2 (nature of the stimuli) + 3 (trial outcomes) design, with participant as a random intercept. We applied this transform because graphical check of the models’ residuals showed better compliance with the models’ assumptions when data were transformed than when left raw. We tested log, inverse, and square-root transforms and found better compliance with the Box Cox transform based on visual inspection of the models’ residuals. We
focused the analysis on participant-averaged RT because we wanted a simple model accounting for unexplained differences between participants and because modeling all trials’ RT explained less variance as compared to participant-averaged RT (based on the marginal and condi-tionalR2values). We chose not to investigate the interaction between linguistic nature, nature of the stimuli, and trial outcome as further interpreting all the different contrasts would prove difficult and would not be further relevant for this study. Accuracy data (Box-Cox transformed) was analyzed following the same statistical design as for RT with a 2 (linguistic nature) + 2 (nature of the stimuli) + 3 (trial outcomes) design, with participant as a random intercept. Graphical checks of the model’s residuals distribution were performed to ensure compliance with the model’s assumptions. For all mixed models, marginal and condi-tionalR2were calculated using the {MuMin} package (Barton, 2009) and are reported in the results. Theanova function of the{car} package (Fox & Weisberg, 2019) was used on the models to extract significance of the fixed effects by the means ofF tests. In the case of significant main effects, post hoc comparisons were performed using theglht function of the {multcomp} package that pro-vides adjustedp values using individual z tests (Hothorn, Bretz, & Westfall, 2008). The significance threshold was set top = .05.
IKIs
As a first method to investigate rhythmicity in typing, we focused on IKIs, which corresponds to the time between consecutive keystrokes. For this analysis, we focused on stimuli that contained at least four characters. Average IKI for each condition, outcome, and participant was calculated. Then, comparison between experimental con-ditions were carried out using similar linear mixed models as described for RT but applied on log-transformed IKI, which showed better compliance with the models’ assumptions.
Kernel Density Estimation
We quantified behavioral rhythmicity in typing by the mean of a kernel density estimation (KDE) analysis. This method is a nonparametric calculation of a probability density function. For each word, we computed the sum of the convolution of each IKI with a Gaussian kernel. The Gaussian kernel was defined as follows:
e−4 ln 2ð Þt2=s2 (1)
wheret is a time vector and s is the kernel bandwidth that was set at 1. At the IKI level, this was done by multiplying the Fourier transform of the kernel with the Fourier trans-form of the IKI signal and then taking the inverse Fourier transform of the result. The IKI signal is a 0.1-Hz resolu-tion vector ranging from 1 to 100 Hz containing only zeros
except for the closest frequency of the IKI (which contains 1). For each word, the result of KDE is the sum of each IKI convolution normalized by the number of letters compos-ing the word. The average result of KDE was calculated for each participant according to experimental conditions and outcome. Further analyses involved identifying the peak typing frequency for each condition and outcome and comparing them at the group level. We used the same linear mixed models as previously described. In that case, peak frequencies were Box-Cox-transformed before modeling because inspection of the model’s residuals in-dicated better compliance with the model’s assumption in that case.
Spatial Filtering of the Data
All preprocessed EEG signal analyses were performed in MATLAB (The MathWorks, Version 2016a) using custom-written code (Cohen, 2014). In order to investigate frequency-specific synchronization between brain activity and typing behavior, we applied spatial filters constructed via GED: For each frequency, a spatial filter was used to extract a single component that maximizes activity at that specific frequency. This spatial filter maximizes the separa-tion between the target frequency and broadband activity with a specific topographical distribution. Critically, the spatial filter does not eliminate other frequencies activity: It selects a set of channel weights that identifies the max-imum energy at the target frequency on the scalp. The broadband data are then passed through this spatial filter, and a time–frequency analysis can be applied to that com-ponent time series. Designing the spatial filter involves computing channel covariance matrices and finding a set of channel weights that maximally differentiates the nar-rowband covariance from the broadband covariance (de Cheveigné & Arzounian, 2015; Nikulin, Nolte, & Curio, 2011). Calculation is done via Rayleigh’s quotient, finding a set of channel weights in vectorw that maximizes λ:
λ ¼wTSw
wTRw (2)
withS as the covariance matrix of the signal narrow-band filtered at the studied frequency, andR the covariance matrix from the broadband signal.
Equation 2 can be extended as a generalized eigenvalue equation:
SW¼ RWΛ (3)
The column of W with the highest associated eigenvalue inΛ corresponds to the spatial filter that maximally distin-guishesS from R. The spatial filter can then be applied to the data as follows:
y¼ wTX (4)
with w being the column of W corresponding to the largest associated eigenvalue, and withX the Channel ×
Time data matrix. The resulting component time series is then the row vectory on which all subsequent analyses can be performed. This spatial filter method has the advantage of increasing signal-to-noise ratio, taking into account interindividual topographical differences, and avoiding electrode selection bias (Cohen, 2017; Nikulin et al., 2011).
In this study, we investigated frequencies from 3 to 15 Hz with a 0.5-Hz resolution. For each GED, narrow-band filtering of the data to create theS matrix was done using these frequencies. We limited the studied frequency to 15 Hz because we can reasonably assume that it is unlikely that one could type faster than 15-Hz frequency. The selection of the best spatial filterw in the W result matrix was done through a combination of a statistical criterion (the size of the eigenvalues) and visual inspection of the topographical maps of the spatial filters’ activation pattern. We inspected the 15 spatial filters associated with 15 highest eigenvalues and then removed the filters that were clearly artifactual (for instance, showing clear eye-blink activity, or one/several electrode issues). After these steps, the component with the highest eigenvalue was chosen as the spatial filter regardless of the topographical activation pattern.
Finally, one should note that GED spatial filtering does not allow us to make inferences at the cortical level and all further analyses and interpretations are limited to topo-graphical, channel-level distributions.
Time–Frequency Decomposition
After spatial filtering of the data, time–frequency decom-position was performed to inspect time–frequency power of the components defined by GED. To this end, we used complex Morlet wavelet convolution: The Fourier trans-form of the data (GED component) was multiplied by the Fourier transform of a set of complex Morlet wavelet and then taking the inverse Fourier transform of the result. Complex Morlet wavelets were defined as follows:
ei2πfte−t2=2s2 (5)
wheret is time, f is frequency ranging from 1 to 50 Hz (in 60 logarithmically spaced steps), ands is the width of each frequency band, defined as n/(2πf ), with n increasing logarithmically from 4 to 12. We then took the squared-magnitude of the resulting signal (Z) asreal [Z(t)2] + imaginary [Z(t)2] to obtain power at each frequency. Power was then baseline-corrected using a decibel (dB) transform:dB power = 10 × log10( power / baseline). Time–frequency decompositions were applied either on the data epoched from−700 to 1500 msec around stimu-lus presentation. Baseline power was defined as the average power across all conditions in the period ranging from−500 to −200 msec before stimulus onset. When plotting time–frequency power results, we deliberately used a different colormap than for the topographical maps
890 Journal of Cognitive Neuroscience Volume 33, Number 5
of the spatial filters activation (see Figure 5C–5F and 5A–5D) in order to differentiate between power and acti-vation of the spatial filter, which are completely different measures. Significant power changes from baseline were investigated by using permutation analyses. The null hypothesis was constructed by cutting the time–frequency map of power at a random time point and placing the second part before the first part, thus misaligning the time of stimulus onset. This operation was carried out 500 times and resulted in a distribution of time–frequency maps under the null hypothesis. Then, the real time–frequency map wasz-scored by subtracting the average power value under the null hypothesis from real power and dividing it by the standard deviation. The significance threshold was set atp = .05.
Brain–Behavior Synchronization Measures
We tested for brain–keystroke synchronization by extracting the phase angle time series via the filter-Hilbert transform method. We computed the consistency of brain phase angles extracted from the time points of the keystrokes over all trials in a condition-specific manner. Regarding errors, we extracted the phases of all the keystrokes in erroneous words in the (pseudo)word and (pseudo)sentence condi-tions. The phases of the keystrokes of correctly typed words in error (pseudo)sentences were not used to compute error phase synchronization. Phase consistency was computed as follows:
w¼ jn−1X
n r¼1
eikr∥ (6)
n is the number of keystrokes, eikis the complex represen-tation of the phase anglek of keystroke r. Values close to 0 indicate random distribution of the phase angles, whereas values close to 1 indicate strong phase consistency.
At the participant level, the significance of phase consis-tency was calculated using the following equation:
p¼ eNc2 (7)
withN being the number of keystrokes and c the consis-tency as calculated using Equation 6.
To compare phase consistency between frequency, condition, and outcome, we applied az-score normaliza-tion based on permutanormaliza-tion analyses to the data. At each iteration, a phase angle time series vector was created using a cut-and-swap procedure that cuts the original time series at a random point and puts the second part before the first part, thus misaligning keystrokes and phases’ timing. Following this, phase consistency was calculated as described in Equation 4. This procedure was carried out 500 times separately for each condition and outcome, providing a distribution of phase consistency under the null hypothesis that phase angles are randomly distributed. Z-score normalization was then applied to real consistency values by subtracting the average consistency of the null
hypothesis distribution and dividing the result by its stan-dard deviation.
To investigate frequency-specific effects of outcome and experimental condition on phase consistency, linear mixed models with a 2 (linguistic nature) + 2 (nature of the stimuli) + 3 (outcomes) design, and with participant as a random effect, were performed at each frequency on box-cox transformed consistency values (using the same functions as described in the RT and Accuracy section).
Data and Code Availability
All EEG and behavioral data are posted on the Donders data repository. All the codes used for EEG analyses, statis-tical analyses, and figures are openly available atgithub .com/jduprez.
RESULTS
Behavioral Results—Is There Rhythmicity in Typing?
RT and Accuracy
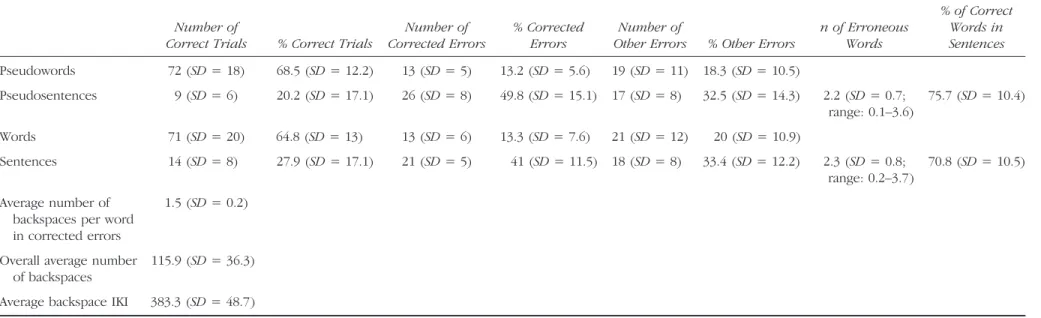
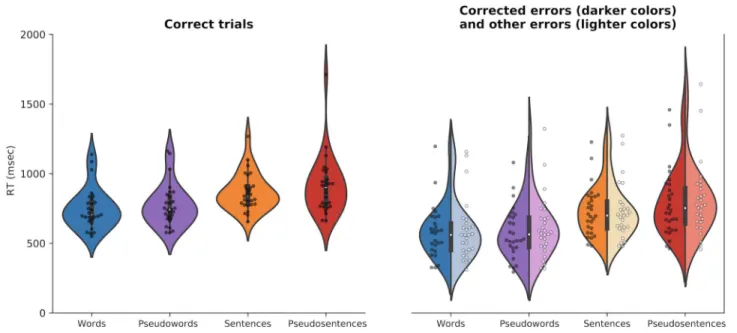
As shown in Table 1, accuracy depended on the type of stimulus, with overall lower accuracy for (pseudo)sen-tences than (pseudo)words,F(1, 70) = 394.5, p < .0001; conditionalR2= .84, marginalR2= .67. However, whether the stimulus had a linguistic nature or not did not influ-ence accuracy,F(1, 70) = 1.5, p = .22. The low accuracy for (pseudo)sentences is explained by the fact that the en-tire sentence was labeled as an error if at least one word had an error. Indeed, sentences and pseudosentences had respectively an average of 2.3 and 2.2 errors per trial when erroneous (Table 1). Figure 1 displays the group-average and distribution of RT showing that RT increases when the stimuli was either nonlinguistic or a sentence. This pattern was confirmed by the statistical analyses with a significant Linguistic Nature effect,F(1, 293) = 19, p < .0001; conditionalR2= .9, marginalR2= .2, as well as a significant Type of Stimulus effect,F(1, 293) = 645, p < .0001. Real stimuli had lower RT (795.4 msec, SD = 132.6) than pseudostimuli (825.4 msec, SD = 170.7), and words had shorter RT (749.7 msec,SD = 134.3) than (pseudo)sentences (871.1 msec,SD = 147.4). Although graphical interpretation would suggest that corrected and other errors had shorter RT than correct trials, this was not supported by the statistical analyses, which showed no significant Trial Outcome effect,F(2, 292) = 0.07,p = .933. As a whole, these data show an increase in RT between nonlinguistic stimuli and (pseudo)sentences as compared to linguistic stimuli and (pseudo)words.
IKIs
Overall IKI had an average of 156.2 msec (SD = 52.6), cor-responding to 6.4 Hz. Figure 2 shows that IKIs changed according to condition. An increase in IKI (thus a decrease
Table 1. Average Number of Trials and Accuracy According to Experimental Conditions and Trial Outcome
Number of
Correct Trials % Correct Trials
Number of Corrected Errors
% Corrected Errors
Number of
Other Errors % Other Errors
n of Erroneous Words % of Correct Words in Sentences Pseudowords 72 (SD = 18) 68.5 (SD = 12.2) 13 (SD = 5) 13.2 (SD = 5.6) 19 (SD = 11) 18.3 (SD = 10.5) Pseudosentences 9 (SD = 6) 20.2 (SD = 17.1) 26 (SD = 8) 49.8 (SD = 15.1) 17 (SD = 8) 32.5 (SD = 14.3) 2.2 (SD = 0.7; range: 0.1–3.6) 75.7 (SD = 10.4) Words 71 (SD = 20) 64.8 (SD = 13) 13 (SD = 6) 13.3 (SD = 7.6) 21 (SD = 12) 20 (SD = 10.9) Sentences 14 (SD = 8) 27.9 (SD = 17.1) 21 (SD = 5) 41 (SD = 11.5) 18 (SD = 8) 33.4 (SD = 12.2) 2.3 (SD = 0.8; range: 0.2–3.7) 70.8 (SD = 10.5) Average number of backspaces per word in corrected errors
1.5 (SD = 0.2)
Overall average number of backspaces
115.9 (SD = 36.3)
Average backspace IKI 383.3 (SD = 48.7)
The lower part of this table contains backspace data details.
892 Journal of Cognitive Neuroscience Volume 33, Number 5
in typing frequency) can be observed nonlinguistic (178.2 msec,SD = 30.1) compared to linguistic stimuli (157.3 msec,SD = 31.5) and for (pseudo)words (172.1 msec, SD = 29) compared to (pseudo)sentences (164.4 msec, SD = 34.8). These differences were supported by the statis-tical analyses with a significant Linguistic Nature effect,F(2, 282) = 225.6,p < .0001; conditional R2= .83, marginal R2= .58, and a significant Type of Stimulus effect,F(2, 282) = 38.04,p < .0001. Figure 3 also suggests that IKI varied between trial outcomes with shorter IKI for correct
trials than for corrected and other errors. We found a signif-icant Trial Outcome effect,F(2, 282) = 407.95, p < .0001, and post hoc analyses confirmed that correct trials had shorter IKI (145.4 msec, SD = 19.5) than other errors (161 msec,SD = 24.5), which had shorter IKI than cor-rected errors (196.8 msec, SD = 27; all p < .0001). However, given that backspace IKI were greater than other IKIs (383.3 msec,SD = 48.7; Table 1), we reran the analysis to check whether the difference between corrected errors and other outcomes was not driven by backspace IKIs.
Figure 1. RT of the first keystroke after stimulus display according to condition and trial outcome. Violin plots show the distribution of the data with an inset boxplot. Each data point corresponds to the average RT of a participant. The right part of the figure shows asymmetrical violins that present both corrected errors data (in darker colors) and other errors data (in lighter colors).
Figure 2. IKI according to condition and trial outcome. Violin plots show the distribution of the data with an inset boxplot. Each data point corresponds to the average IKI of a participant. The right part of the figure shows asymmetrical violins that present both corrected errors data (in darker colors) and other errors data (in lighter colors). A secondy-axis has been added on the right to indicate the typing frequency corresponding to the IKI.
When excluding backspace IKIs, the Outcome effect re-mained,F(2, 282) = 84.71, p < .0001, although corrected errors had a shorter IKI (167.5 msec,SD = 25.2) than in the previous analysis (196.8 msec,SD = 27). The post hoc com-parison showed that the difference between correct errors and other errors remained significant as well (p = .0006). As a whole, typing frequency was faster for real than pseu-dostimuli and for (pseudo)words than (pseudo)sentences stimuli. It is worth noting that typing frequency was also faster for other errors than for corrected errors.
KDE Analyses
Using KDE on IKI data provided similar results as raw IKI analyses regarding typing frequency. Inspection of the KDE spectrum (Figure 3A) shows that typing mostly occurs around 6 Hz. In order to better assess typing quency at the group level, we extracted the peak fre-quency for each participant according to condition and trial outcome (Figure 3B). In that case, results were less clear than when focusing on IKI. Indeed, although graph-ical inspection seems to show similar typing frequency regardless of condition and trial outcome, statistical anal-yses revealed significant differences for the Linguistic Na-ture effect (Linguistic NaNa-ture:F(1, 293) = 37.9, p < .0001; conditionalR2= .45, marginalR2= .10) with higher fre-quencies for real stimuli (6.8 Hz,SD = 1) than pseudo-stimuli (6.3 Hz, SD = 1.1). We also found a significant outcome effect,F(2, 293) = 9.02, p = .0002, but the type of stimulus did not significantly influenced frequency, F(1, 293) = 3.4, p = .064. It is worth noting that, in this analysis, conditional and marginalR2were lower than for RT or IKI, indicating less variance explained by the
model. When applying post hoc tests, we found that cor-rect trials had faster frequency (6.8 Hz, SD = 0.8) than corrected errors (6.4 Hz,SD = 0.9; p < .001) and other errors (6.5 Hz, SD = 1.3; p = .003). The comparison between corrected errors and other errors was not signif-icant (p = .74). Overall average peak frequency was at 6.5 Hz (SD = 1.1), which is consistent with the typing frequency obtained in the IKI results (6.4 Hz).
EEG—Does Typing Synchronize with Brain Oscillatory Activity?
Topographies of the Spatial Filters
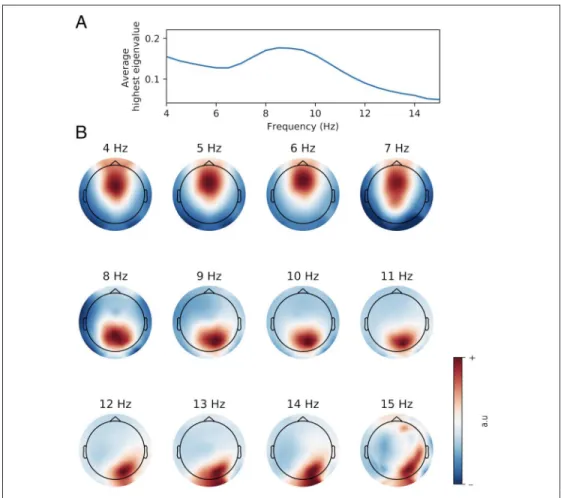
Although we investigated frequencies ranging from 3 to 15 Hz, we only report EEG results from 4 to 15 Hz because 3-Hz activity was dominated by eye-level activity and because no participant typed at 3 Hz. Figure 4A shows the size of the largest eigenvalue according to frequencies at the group level. The highest values were observed at 8.5 Hz, which indicates that this frequency was more easily differentiated from broadband activity than other frequen-cies, especially from frequencies above 12 Hz. Inspection of the spatial filters created by GED revealed clear activa-tion patterns (Figure 4B). Greater activaactiva-tion was centered around midfrontal electrodes from 4 to 7 Hz. A shift from midfrontal to occipital activation occurred from 8 to 11 Hz, which became more occipito-parietal from 12 to 15 Hz.
ERP and Time–Frequency Analyses
In order to further evaluate the quality of the components created by GED, we inspected the ERP and time– frequency decompositions of the components. Here, we
Figure 3. (A) Participant-specific spectrum of KDE results (averaged over all conditions for each participant - grand average of all stimuli IKI probability density function); (B) Peak frequency extracted from the KDE result according to condition and trial outcome. Violin plots show the distribution of the data with an inset boxplot. Each data point corresponds to the peak typing frequency of a participant. The right part of the figure shows asymmetrical violins that present both corrected errors data (in darker colors) and other errors data (in lighter colors).
894 Journal of Cognitive Neuroscience Volume 33, Number 5
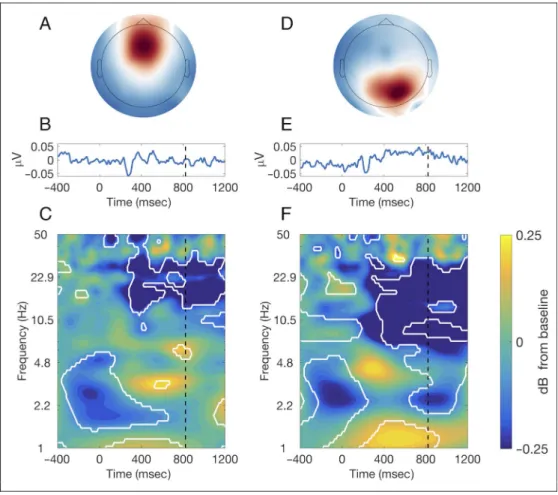
report the results of two frequency components: the 6-Hz component, because of our hypothesis on theta synchro-nization with typing, and the 8.5-Hz component (Figure 5) given that it is the one associated with the highest eigenvalues.
Analyzing the 6- and 8.5-Hz components revealed that the spatial filtering designed by GED resulted in physiolog-ical signals that have a clear topography, as well as time-resolved and time–frequency characteristics. Figure 5B and 5E show the group-level ERP with clear positive and negative variations after stimulus onset. Figure 5C and 5F reveal the time–frequency power dynamics. A signifi-cant increase in power can be observed around 600 msec after stimulus presentation for the 6-Hz component (thus before mean RT) in the theta band. An important signifi-cant decrease in power in the beta band for the 6-Hz com-ponent, and that spans the alpha and beta band for the 8.5-Hz component, was also present from roughly 300 to 1200 msec. Very low- and high-frequency changes can also be observed. The topographical map and ERP are very different from one target frequency to the other. Time– frequency power dynamics, although sharing overall similar features, also show different characteristics such as stronger alpha decrease and delta increase for the 8.5-Hz component. As a whole, GED allowed to isolate frequency-specific components that each had its particular activation pattern and oscillatory characteristics.
Frequency-specific Phase Clustering of All Keystrokes Our main hypothesis was that typing synchronizes with brain activity around the typing frequency. More specifically, we expected that typing in theta frequency would synchro-nize with midfrontal theta oscillations. For frequencies ranging from 4 to 15 Hz, phase–behavior synchronization was calculated for the corresponding GED component. Z-score normalization based on permutation analyses was then performed in order to ensure frequencies, experi-mental conditions, and trial outcomes are comparable.
According to Figure 6A, it seems that average synchro-nization between typing and brain activity peaked at 8 Hz. However, inspection of the participant-specific spectra of synchronization revealed that the peak synchronization frequency was idiosyncratic across participants and ranged from 4 to 15 Hz (Figure 6B). Since brain–behavior syn-chronization could vary according to experimental condi-tions, we applied linear mixed models for each frequency to investigate the effect of the linguistic nature of the stimuli, the type of stimuli, and trial outcome on synchro-nization. This analysis did not reveal any significant exper-imental condition, or trial outcome effect at any frequency (allp > .05), except for the linguistic nature effect at 13, F(1, 326) = 5.2, p = .024; conditional R2= 0.02, marginal R2= .02, and 13.5 Hz,F(1, 326) = 6.4, p = .012; conditional R2= .02, marginalR2= .02, with higher consistency for
Figure 4. (A) Spectrum of group-averaged highest eigenvalue. (B) Topographical maps showing the activation pattern (in arbitrary units) of the spatial filters designed by GED for each frequency. Although the spatial filters were computed at 0.5-Hz resolution, only 1-Hz resolution topographical maps are shown here.
Figure 5. (A) Topographical map showing the activation pattern of the 6-Hz spatial filter; (B) group-averaged event-related potential; (C) group-averaged time–frequency plot of decibel-transformed power (white contour lines indicate significant changes from baseline atp < .05 based on permutation testing). Stimulus onset occurred at time = 0 msec, and the vertical dashed line corresponds to the group-averaged RT. (D–F) Same plots but for the 8.5-Hz spatial filter.
Figure 6. (A) Outcome-specific and group-averagedz-scored synchronization according to frequency; (B) participant-specific z-scored synchronization according to frequency sorted according to peak synchronization frequency (upper participants have a lower peak frequency). The white pixels indicate nonsignificant synchronization (p > .05) at the participant level (calculated over all trials); all other pixels have participant-level synchronization at p < .05; (C) scatterplot showing the relationship between peak synchronization frequency and behavioral peak frequency estimated by the IKI and KDE analyses.
896 Journal of Cognitive Neuroscience Volume 33, Number 5
nonlinguistic (13 Hz: 0.02,SD = 0.96; 13.5 Hz: 0.06, SD = 0.97) than linguistic stimuli (13 Hz:−0.2, SD = 0.85; 13.5 Hz: 0.18,SD = 0.81), and for the type of stimulus effect at 9 Hz with lower consistency for words (−0.15, SD = 0.98) than sentences (−0.1, SD = 0.91; F(1, 326) = 3.9, p = .047; conditionalR2= .03, marginalR2= .01). However, it is important to note that for all frequencies, conditional and marginalR2were lower than 0.1, indicating only a small amount of variance was explained by the models. Furthermore, although peak synchronization frequency was highly variable across participants, inspection of syn-chronization significance at the participant level revealed that most significant synchronizations occurred at frequen-cies lower than 9 Hz (Figure 6B). Figure 6C displays the relationship between peak synchronization frequency and behavioral peak frequency. If typing and brain activity syn-chronizes the most at the typing frequency, a strong corre-lation should appear between typing frequency and the synchronization between typing and brain activity. The cor-relation between peak frequency estimated through IKI analysis with the peak synchronization was not significant (ρ = 0.35, p = .069), whereas it was the case for correlation between the KDE-estimated frequency and peak synchroni-zation frequency (ρ = 0.49, p = .008). Critically, this analysis was not circular given that neural oscillation’s phase (extracted at the time of the keystrokes) and IKI/KDE values are independent. As a whole, our results suggest that the brain–behavior synchronization mostly occurs at low fre-quencies during typing but is more nuanced than originally expected.
DISCUSSION
The rhythmic nature of brain electrophysiological activity has been shown to be associated with rhythmic behaviors through various mechanisms (synchronization, entrain-ment, changes in behavioral performances). In this study, we tested the hypothesis that keyboard typing, a real-life behavior that has been suggested to be rhythmic, synchro-nizes with neuronal oscillations, which would manifest as phase consistency of oscillatory activity over keystrokes during typing behavior. More specifically, we expected that synchronization would preferentially occur with midfrontal theta oscillations, which have been reportedly associated with cognitive control, and recently with key-board typing. We further hypothesized that phase consis-tency over keystrokes would decrease during errors. Our results partly support our hypothesis by showing that typing is indeed rhythmic and that it does mostly synchro-nize with brain activity in low frequencies, although with no strong specificity for midfrontal theta.
Typing is Rhythmic
Keyboard typing is a highly expressed behavior in our mod-ern societies, which makes it an ecologically valid behavior to investigate. Furthermore, studying typing is facilitated by
the ease in collecting huge amounts of data in a short amount of time and without any special requirements in experimental setup and experimenter training. Typing speed has been the focus of ample research, notably regarding keyboard design and typing performance ( S o u k o r e f f & M a c k e n z i e , 1 9 9 5 ; K i n k e a d , 1 9 7 5 ) . Performances are usually assessed by investigating the number of words per minute, or through the IKI, with some studies suggesting that typing occurs in the theta frequency range (Kalfaoğlu et al., 2018; Kalfaoğlu & Stafford, 2014; Yamaguchi et al., 2013). In this study, we used two different approaches to investigate rhythmicity in typing: either by focusing on raw IKI or by calculating their probability den-sity function using KDE. Both approaches led to results showing that typing rhythmicity occurred in the theta fre-quency range on average (6.4 and 6.5 Hz for the IKI and KDE analyses, respectively). Our results also suggest that typing RT and typing frequency depended to some extent on the need for cognitive control, on the type of stimulus, and on whether errors were committed. Indeed, pseudo-stimuli were associated with longer RTs and lower typing frequency and sentences were associated with longer RTs and higher typing frequency. Regarding trial outcome, lower typing frequency was observed for errors compared to correct trials. Corrected errors showed lower typing fre-quency compared to other errors, which could be explained by behavioral adjustments such as posterror slowing because of error awareness and monitoring (Schroder & Moser, 2014; Ullsperger, Fischer, Nigbur, & Endrass, 2014). However, this interpretation is mitigated by the fact that overall backspace IKIs were greater than other IKIs. Removing backspace IKIs from the analyses decreased cor-rected errors IKIs, indicating that backspaces accounted for at least some part of lower typing frequency associated with corrected errors. Nonetheless, removal of these IKIs still resulted in lower typing frequency in corrected errors com-pared to other errors. Thus, error monitoring effects might also contribute to this effect. For instance, monitoring pro-cesses might have been even more elicited given the ab-sence of visual feedback (Pinet & Nozari, 2020). Following this, the absence of visual feedback might account for lower correction rates compared to other studies (Pinet & Nozari, 2021; Kalfaoğlu et al., 2018). Finally, it is important to note that these results were stronger in the IKI analysis. This could be, at least partly, explained by the fact that IKI anal-yses were based on participant-averaged IKI, whereas KDE analyses were based on participants’ peak typing frequency, which could arguably be more consistent across conditions than average IKI. Nonetheless, the lack of the same effects for the KDE analysis leads to caution in interpreting exper-imental condition and outcome effects on typing frequency and demands further replications.
Unmixing Frequency-specific Signals
In this study, we hypothesized a synchronization between typing and midfrontal theta oscillations. In order to
increase the signal-to-noise ratio, to avoid bias in electrode selection and to account for variability in participant’s topography, we chose to apply a multivariate guided source separation method, namely, GED (de Cheveigné & Arzounian, 2015; Nikulin et al., 2011). This method allows us to create a single component that best reflects target features of the signal (in this case, a narrow-band frequency-specific signal) and has been shown to be very helpful in maximizing low-frequency features in the EEG signal ( Cohen, 2017). Our results showed that this method successfully isolated different narrow-band frequency-specific components. Indeed, theta frequency components showed a midfrontal-centered activation topography, which is highly similar to topographies observed during cognitive control tasks, and were associated with compa-rable time–frequency dynamics such as preresponse theta power bursts (Duprez et al., 2020; Pastötter, Dreisbach, & Bäuml, 2013; Cohen & Cavanagh, 2011; Nigbur, Ivanova, & Stürmer, 2011). Focusing on higher frequencies, topog-raphies shifted to more posterior, occipital, and occipito-parietal activations and components showed distinct time–frequency dynamics with strong alpha suppression. These topographies and power dynamics are usually associ-ated with visual attention (Zhang, Zhang, Cai, Luo, & Fang, 2019; Bauer, Stenner, Friston, & Dolan, 2014; Fries, Womelsdorf, Oostenveld, & Desimone, 2008) and have already been reported during typing (Scaltritti, Suitner, & Peressotti, 2020).
Brain–Behavior Synchronization during Typing Synchronization between brain activity and sensory infor-mation or behavior has been repeatedly observed in vari-ous situations. Brain oscillations can become entrained and phase-aligned to (quasi)rhythmic stimuli with conse-quences on cognitive performances (see Hanslmayr, Axmacher, & Inman, 2019, for a review on memory), or they can provide a more or less constrained time frame for specific cognitive processes or behavior to occur (Duprez et al., 2020; Fiebelkorn & Kastner, 2019; Miller, Lundqvist, & Bastos, 2018). The similarities between key-board typing and cognitive control in terms of topograph-ical theta activity and time–frequency power (Kalfaoğlu et al., 2018; Cavanagh & Frank, 2014) led us to hypothesize the existence of synchronization between midfrontal theta and typing behavior, and that breakdown in this synchro-nization would explain typing errors. However, it is impor-tant to note that our hypothesis does not presuppose whether brain oscillations would become phase-aligned with typing as a rhythmic sensory information, or whether brain oscillations would cyclically orchestrate processes resulting in rhythmic typing. Our results do not clearly support our hypothesis. Indeed, phase consistency (i.e., synchronization) of keystrokes did occur significantly in all participants and at various frequencies for all partic-ipants, suggesting that there is some broadband (non-frequency-specific) synchronization between typing and
neural oscillations. Analyses showed that peak synchroni-zation seemed to occur around 8 Hz at the group level. Since the 8-Hz component was associated with midfrontal topography, this would support midfrontal theta synchro-nization with typing. However, inspection of participant-specific data showed that synchronization peak frequency was participant specific and ranged from 4 to 15 Hz, thus associated with components with various topographies. Therefore, although significant synchronization mostly occurred at low frequencies (and thus around midfrontal regions) at the participant level, our results do not point to a clear specificity for the theta band and for midfrontal activity. We further reasoned that if synchronization between typing and neuronal oscillation was strong, the peak synchronization frequency and the peak typing frequency should correlate at the group level. We only observed such correlation when focusing on typing fre-quency determined by the KDE method.
Moreover, no significant changes in phase consistency were observed between the different experimental condi-tions, and between the different trial outcomes, at any fre-quency. This suggests that the need for cognitive control did not modulate synchronization and that erroneous tri-als (whether they were corrected or not) were not neces-sarily associated with a decrease in synchronization. The average number of errors in erroneous sentences was only two, which prevented us from investigating the effect of the number of errors on synchronization. This could have influenced error-related results. Investigating such an effect would be interesting in a subsequent study but would likely require focusing on less experienced participants.
To summarize, although our results show synchroniza-tion between typing and neuronal oscillasynchroniza-tions, it does not seem to be limited to the theta band or to midfrontal regions, and typing behavior does not seem to depend on the strength of this synchronization.
Limitations and Perspectives
This study is the first, to our knowledge, to investigate synchronization between brain activity and typing. As a result, interpretations should remain cautious and take into account some limitations.
Our results show that there was a clear variability in typing frequency across participants, with some partici-pants showing 4.5-Hz typing frequency whereas others went up to 7.5 Hz. Such differences could participate in enhancing variability when investigating synchronization. Focusing on a group of participants sharing more similar typing frequencies could help in diminishing interindivid-ual typing differences. However, it is important to note that our results show that, even for similar typing frequen-cies, the peak synchronization frequency varied from 4 to 15 Hz. This suggests that typing frequency variability prob-ably does not entirely account for synchronization differ-ences. Another linked limitation is that we cannot rule out that variability in typing expertise across participants
898 Journal of Cognitive Neuroscience Volume 33, Number 5
might have influenced our results. Although including random intercept for participant in the statistical models accounts for part of interindividual variability, it is possible that brain–behavior synchronization during typing varies depending on expertise. Further work including precise typing expertise information of participants will be needed to investigate this hypothesis.
With this study, we aimed at testing a specific hypothesis on midfrontal theta synchronization with typing. Thus, we chose to use a spatial filtering technique (GED) specifically designed to enhance narrow-band frequency-specific fea-tures of the signal. Although GED successfully isolated target components, it also potentially masked broader topograph-ical networks, which do not necessarily operate in narrow-band frequencies but rather by the means of cross-frequency dynamics. An interesting perspective of this work could be to investigate such cross-frequency networks by using participant-specific peak synchronization frequency as the low frequency timing higher frequency characteristics.
Our hypothesis was based on the fact that keyboard typ-ing is associated with the same frequency characteristics (midfrontal oscillatory dynamics) as cognitive control. These associations are often described for perception mechanisms (Zoefel & VanRullen, 2016), and an interest-ing contribution of our study is in showinterest-ing that a compa-rable association is relevant for high-level real-world behavior. However, our data do not allow us to interpret the meaning of such frequency association and synchroni-zation between behavior and neural activity.
Another aspect to bear in mind is that this study was lim-ited to the investigation of cortical brain–behavior synchro-nization. The synchronization we expected might be more prominent between typing and activity in the basal ganglia or the cerebellum, which are hardly accessible through EEG. For instance, in the case of cognitive control, theta oscillations in the subthalamic nucleus have been associ-ated with conflict resolution and inhibition and subtends functional connectivity with midfrontal cortical regions (Zavala, Zaghloul, & Brown, 2015), making it an interesting candidate structure for synchronization with typing. Another potential structure for synchronization might be the cerebellum, which is involved in the subsecond timing of voluntary movements (Bareš et al., 2019), thus in the frequency range of keyboard typing. Finally, given the com-plex interplay between cortical regions, the basal ganglia and the cerebellum for goal-directed behavior, it is highly unlikely that synchronization would be exclusive to one structure. Comparing the strength of synchronization between these brain regions and typing would therefore provide interesting insights on the role of brain–behavior synchronization during keyboard typing.
Reprint requests should be sent to Joan Duprez, Université de Rennes 1, Campus de Beaulieu. Bât 22, Rennes 35042, France, or via e-mail: [email protected].
Author Contributions
Joan Duprez: Data curation; Formal analysis; Investigation; Methodology; Project administration; Software; Validation; Visualization; Writing—Original draft; Writing—Review & editing. Mitchel Stokkermans: Data curation; Investigation; Software; Writing—Review & editing. Linda Drijvers: Conceptualization; Data curation; Investigation; Project ad-ministration; Resources; Supervision; Writing—Review & editing. Michael X. Cohen: Conceptualization; Funding ac-quisition; Investigation; Methodology; Project adminis-tration; Resources; Software; Supervision; Validation; Writing—Review & editing.
Funding Information
Joan Duprez, Rennes Clinical Neuroscience Institute. Michael X. Cohen, ERC-StG, grant 638589. Linda Drijvers, ERC-COG, grant 773079.
Diversity in Citation Practices
A retrospective analysis of the citations in every article published in this journal from 2010 to 2020 has revealed a persistent pattern of gender imbalance: Although the pro-portions of authorship teams (categorized by estimated gender identification of first author/last author) publishing in theJournal of Cognitive Neuroscience ( JoCN ) during this period were M(an)/ M = .408, W(oman)/ M = .335, M/W = .108, and W/W = .149, the comparable proportions for the articles that these authorship teams cited were M/M = .579, W/M = .243, M/W = .102, and W/W = .076 (Fulvio et al.,JoCN, 33:1, pp. 3–7). Consequently, JoCN encourages all authors to consider gender balance explicitly when selecting which articles to cite and gives them the opportunity to report their article’s gender citation balance. The authors of this paper report its proportions of citations by gender category to be: M/M = .708; W/M = .042; M/W = .125; W/W = .125.
REFERENCES
Aiken, S. J. & Picton, T. W. (2008). Human cortical responses to the speech envelope.Ear and Hearing. 29(2), 139–157. DOI:
https://doi.org/10.1097/AUD.0b013e31816453dc
Bareš, M., Apps, R., Avanzino, L., Breska, A., D’Angelo, E., Filip, P., et al. (2019). Consensus paper: Decoding the contributions of the cerebellum as a time machine. from neurons to clinical applications.Cerebellum, 18, 266–286. DOI:https://doi.org /10.1007/s12311-018-0979-5, PMID:30259343
Barton, K. (2009). MuMIn: Multi-model inference.http://R-Forge .R-project.org/projects/mumin/.
Bauer, M., Stenner, M.-P., Friston, K. J., & Dolan, R. J. (2014). Attentional modulation of alpha/beta and gamma oscillations reflect functionally distinct processes.Journal of Neuroscience, 34, 16117–16125. DOI:https://doi.org/10.1523/JNEUROSCI .3474-13.2014, PMID:25429152, PMCID:PMC4244475
Brainard, D. H. (1997). The psychophysics toolbox.Spatial Vision, 10, 433–436. DOI:https://doi.org/10.1163/156856897X00357, PMID:9176952
Calderone, D. J., Lakatos, P., Butler, P. D., & Castellanos, F. X. (2014). Entrainment of neural oscillations as a modifiable substrate of attention.Trends in Cognitive Sciences, 18, 300–309. DOI:https://doi.org/10.1016/j.tics.2014.02.005, PMID:24630166, PMCID:PMC4037370
Cavanagh, J. F., & Frank, M. J. (2014). Frontal theta as a mechanism for cognitive control.Trends in Cognitive Sciences, 18, 414–421. DOI:https://doi.org/10.1016/j.tics .2014.04.012, PMID:24835663, PMCID:PMC4112145
Cohen, M. X. (2014).Analyzing neural time series data: Theory and practice. Cambridge, MA: MIT Press. DOI:https://doi .org/10.7551/mitpress/9609.001.0001
Cohen, M. X. (2017). Multivariate cross-frequency coupling via generalized eigendecomposition.eLife, 6, e21792. DOI:
https://doi.org/10.7554/eLife.21792, PMID:28117662, PMCID:
PMC5262375
Cohen, M. X., & Cavanagh, J. F. (2011). Single-trial regression elucidates the role of prefrontal theta oscillations in response conflict.Frontiers in Psychology, 2, 30. DOI:https://doi .org/10.3389/fpsyg.2011.00030, PMID:21713190, PMCID:
PMC3111011
Cohen, M. X., & van Gaal, S. (2014). Subthreshold muscle twitches dissociate oscillatory neural signatures of conflicts from errors.Neuroimage, 86, 503–513. DOI:https://doi .org/10.1016/j.neuroimage.2013.10.033, PMID:24185026
de Cheveigné, A., & Arzounian, D. (2015). Scanning for oscillations. Journal of Neural Engineering, 12, 066020. DOI:https://doi.org /10.1088/1741-2560/12/6/066020, PMID:26501393
Delorme, A., & Makeig, S. (2004). EEGLAB: An open source toolbox for analysis of single-trial EEG dynamics including independent component analysis.Journal of Neuroscience Methods, 134, 9–21. DOI:https://doi.org/10.1016/j.jneumeth .2003.10.009, PMID:15102499
Drewes, J., & VanRullen, R. (2011). This is the rhythm of your eyes: The phase of ongoing electroencephalogram oscillations modulates saccadic reaction time.Journal of Neuroscience, 31, 4698–4708. DOI:https://doi.org/10.1523 /JNEUROSCI.4795-10.2011, PMID:21430168, PMCID:
PMC6622921
Drijvers, L., Mulder, K., & Ernestus, M. (2016). Alpha and gamma band oscillations index differential processing of acoustically reduced and full forms.Brain and Language, 153–154, 27–37. DOI:https://doi.org/10.1016/j.bandl.2016 .01.003, PMID:26878718
Duprez, J., Gulbinaite, R., & Cohen, M. X. (2020). Midfrontal theta phase coordinates behaviorally relevant brain computations during cognitive control.Neuroimage, 207, 116340. DOI:
https://doi.org/10.1016/j.neuroimage.2019.116340, PMID:
31707192, PMCID:PMC7355234
Fiebelkorn, I. C., & Kastner, S. (2019). A rhythmic theory of attention.Trends in Cognitive Sciences, 23, 87–101. DOI:
https://doi.org/10.1016/j.tics.2018.11.009, PMID:30591373, PMCID:PMC6343831
Fox, J., & Weisberg, S. (2019).An R companion to applied regression (3rd ed.). Sage.https://socialsciences.mcmaster .ca/jfox/Books/Companion/.
Fries, P., Womelsdorf, T., Oostenveld, R., & Desimone, R. (2008). The effects of visual stimulation and selective visual attention on rhythmic neuronal synchronization in macaque area V4.Journal of Neuroscience, 28, 4823–4835. DOI:
https://doi.org/10.1523/JNEUROSCI.4499-07.2008, PMID:
18448659, PMCID:PMC3844818
Gross, J., Kujala, J., Hämäläinen, M., Timmermann, L., Schnitzler, A., & Salmelin, R. (2001). Dynamic imaging of coherent sources: Studying neural interactions in the human brain. Proceedings of the National Academy of Sciences, U.S.A., 98, 694–699. DOI:https://doi.org/10.1073/pnas.98.2.694, PMID:
11209067, PMCID:PMC14650
Haegens, S., & Zion Golumbic, E. (2018). Rhythmic facilitation of sensory processing: A critical review.Neuroscience & Biobehavioral Reviews, 86, 150–165. DOI:https://doi.org /10.1016/j.neubiorev.2017.12.002, PMID:29223770
Hanslmayr, S., Axmacher, N., & Inman, C. S. (2019). Modulating human memory via entrainment of brain oscillations.Trends in Neurosciences, 42, 485–499. DOI:https://doi.org/10.1016 /j.tins.2019.04.004, PMID:31178076
Hothorn, T., Bretz, F., & Westfall, P. (2008). Simultaneous inference in general parametric models.Biometrical Journal, 50, 346–363. DOI:https://doi.org/10.1002/bimj.200810425, PMID:18481363
Kalfaoğlu, Ç., & Stafford, T. (2014). Performance breakdown effects dissociate from error detection effects in typing. Quarterly Journal of Experimental Psychology, 67, 508–524. DOI:https://doi.org/10.1080/17470218.2013.820762, PMID:
23931599
Kalfaoğlu, Ç., Stafford, T., & Milne, E. (2018). Frontal theta band oscillations predict error correction and posterror slowing in typing.Journal of Experimental Psychology: Human Perception and Performance, 44, 69–88. DOI:https://doi .org/10.1037/xhp0000417, PMID:28447844
Keuleers, E., & Brysbaert, M. (2010). Wuggy: A multilingual pseudoword generator.Behavior Research Methods, 42, 627–633. DOI:https://doi.org/10.3758/BRM.42.3.627, PMID:
20805584
Kinkead, R. (1975). Typing speed, keying rates, and optimal keyboard layouts.Proceedings of the Human Factors Society Annual Meeting, 19, 159–161. DOI:https://doi.org/10.1177 /154193127501900203
Kösem, A., Bosker, H. R., Takashima, A., Meyer, A., Jensen, O., & Hagoort, P. (2018). Neural entrainment determines the words we hear.Current Biology, 28, 2867–2875. DOI:
https://doi.org/10.1016/j.cub.2018.07.023, PMID:30197083
Miller, E. K., Lundqvist, M., & Bastos, A. M. (2018). Working memory 2.0.Neuron, 100, 463–475. DOI:https://doi.org/ 10.1016/j.neuron.2018.09.023, PMID:30359609
Nigbur, R., Ivanova, G., & Stürmer, B. (2011). Theta power as a marker for cognitive interference.Clinical Neurophysiology, 122, 2185–2194. DOI:https://doi.org/10.1016/j.clinph.2011 .03.030, PMID:21550845
Nikulin, V. V., Nolte, G., & Curio, G. (2011). A novel method for reliable and fast extraction of neuronal EEG/MEG oscillations on the basis of spatio-spectral decomposition.Neuroimage, 55, 1528–1535. DOI:https://doi.org/10.1016/j.neuroimage .2011.01.057, PMID:21276858
Pastötter, B., Dreisbach, G., & Bäuml, K.-H. T. (2013). Dynamic adjustments of cognitive control: Oscillatory correlates of the conflict adaptation effect.Journal of Cognitive Neuroscience, 25, 2167–2178. DOI:https://doi.org/10.1162/jocn_a_00474, PMID:24001006
Pinet S., & Nozari N. (2020) Electrophysiological correlates of monitoring in typing with and without visual feedback. Journal of Cognitive Neuroscience, 32, 603–620. DOI:
https://doi.org/10.1162/jocn_a_01500, PMID:31702430
Pinet, S., & Nozari, N. (2021) The role of visual feedback in detecting and correcting typing errors: A signal detection approach.Journal of Memory and Language, 117, 104193. DOI:https://doi.org/10.1016/j.jml.2020.104193
Pinheiro, J., Bates, D., DebRoy, S., Sarkar, D., & R Core Team. (2020). nlme: Linear and nonlinear mixed effects models.
https://CRAN.R-project.org/package=nlme.
R Core Team. (2019). R: A Language and Environment for Statistical Computing. R Foundation for Statistical Computing.https://www.R-project.org/.
Rosen, S. (1992). Temporal Information in speech: Acoustic, auditory and linguistic aspects.Philosophical Transactions of the Royal Society of London, Series B: Biological Sciences,
900 Journal of Cognitive Neuroscience Volume 33, Number 5
336, 367–373. DOI:https://doi.org/10.1098/rstb.1992.0070, PMID:1354376
Scaltritti, M., Suitner, C., & Peressotti, F. (2020). Language and motor processing in reading and typing: Insights from beta-frequency band power modulations.Brain and Language, 204, 104758. DOI:https://doi.org/10.1016/j.bandl.2020 .104758, PMID:32032864
Schroder, H. S., & Moser, J. S. (2014). Improving the study of error monitoring with consideration of behavioral performance measures.Frontiers in Human Neuroscience, 8, 178. DOI:https://doi.org/10.3389/fnhum.2014.00178, PMID:24723878, PMCID:PMC3972447
Soukoreff, R. W., & Mackenzie, I. S. (1995). Theoretical upper and lower bounds on typing speed using a stylus and a soft keyboard. Behaviour & Information Technology, 14, 370–379. DOI: https://doi.org/10.1080 /01449299508914656
Ullsperger, M., Fischer, A. G., Nigbur, R., & Endrass, T. (2014). Neural mechanisms and temporal dynamics of performance monitoring. Trends in Cognitive Sciences, 18, 259–267. DOI:https://doi.org/10.1016/j.tics.2014.02.009, PMID:
24656460
VanRullen, R. (2016). Perceptual cycles.Trends in Cognitive Sciences, 20, 723–735. DOI:https://doi.org/10.1016/j.tics .2016.07.006, PMID:27567317
Yamaguchi, M., Crump, M. J. C., & Logan, G. D. (2013). Speed-accuracy trade-off in skilled typewriting: Decomposing the contributions of hierarchical control loops.Journal of Experimental Psychology: Human Perception and Performance, 39, 678–699. DOI:https://doi.org/10.1037 /a0030512, PMID:23127474
Zavala, B., Zaghloul, K., & Brown, P. (2015). The subthalamic nucleus, oscillations, and conflict.Movement Disorders, 30, 328–338. DOI:https://doi.org/10.1002/mds.26072, PMID:
25688872, PMID:PMC4357561
Zhang, Y., Zhang, Y., Cai, P., Luo, H., & Fang, F. (2019). The causal role ofα-oscillations in feature binding. Proceedings of the National Academy of Sciences, U.S.A., 116, 17023–17028. DOI:https://doi.org/10.1073/pnas.1904160116, PMID:
31383766, PMCID:PMC6708338
Zoefel, B., & VanRullen, R. (2016). EEG oscillations entrain their phase to high-level features of speech sound.Neuroimage, 124, 16–23. DOI:https://doi.org/10.1016/j.neuroimage.2015 .08.054, PMID:26341026