by
ROBERT MICHAEL IWANCHUK B.S., Kent State University
(1971)
SUBMITTED IN PARTIAL FULFILLMENT OF TIE REQUIREMENTS FOR THE DEGREE OF MASTER OF SCIENCE
at the MASSACHUSETTS INSTITUTE OF TECHNOLOGY May, 1973 Signature of Author D a m o My,-197
Department of Mletyorology, April 20, 1973
Certified by ...
Thesis Supervisor
Accepted by ...
Chairman, DeDartrental Committee on Graduate Students
ROBERT MICHAEL IWANCHUK
Submitted to the Department of Meteorology on April 20, 1973 in partial fulfillment of the requirements for the degree of Master of Science.
ABSTRACT
A detailed analysis is made of radar observations from 11-26 July, 1969 during the fourth phase of BOMEX to (1) study the cha-racteristics of individual tropical showers and mesoscale precipi-tation areas and (2) to observe patterns and distributions of these areas in disturbed and undisturbed weather conditions. Tropical precipitation is characterized by numerous showers. Typicaly during undisturbed conditions, showers were less than 80 mi in area, a value which was used in classifying them as opposed to larger precipitation areas termed mesoscale. The characteristics and behavior of 82 showers and 34 mesoscale areas were studied for their entire lifetimes. Durations of showers were usually less than two hours with a correlation coefficient between maximum area and duration of 0.6. A diurnal variation in shower numbers was observed on undisturbed days with a maximum at2 late night' and early morning hoursaveraged at 106 echoes/56,000 mi . This was two or three times as many showers as at the early afternoon minimum. Continuous precipitation areas greater than 80 mi2, called small mesoscale areas, were generally observed during disturbed conditions.
2 3 2
They were usually between 10 and 10 mi in area with durations of one to four hours and the sample had a correlation coefficient of 0.7 between maximum area and duration. Practically all mesoscale areas and about 1/3 of the showers had areas of higher intensity of precipitation imbedded in them.
Two wave disturbances and two cyclonic vortices were observed. Widespread showers with a few areas of mesoscale size characterized
the wave disturbances while more concentrated areas containing numerous cells and larger individual precipitation areas were ob-served in the cyclonic vortices.
Comparison is made between typical precipitation patternsin the Barbados area and in New England. Tropical disturbances lacked synoptic-scale areas of precipitation which are found in extra-tropical storms and contained a much larger number of showers and smaller areas. Small mesoscale areas in both latitudes had similar characteristics. Large mesoscale areas (r,-110 3-104 mi2) are found in both regions, but in the tropics they are clusters of echoes rather than connected echoes.
Thesis Supervisor: Pauline M. Austin Title: Senior Research Associate
LIST OF FIGURES 6
I. INTRODUCTION 9
A. Background and Objectives 9
B. Outline 12
II. DATA AND CLASSIFICATION OF ECHOES AND WEATHER CONDITIONS 14
A. Data 14
B. Classification of Echoes and Weather Conditions 16 III. SURVEY OF SHOWERS AND SMALL MESOSCALE AREAS 20
A. Life Histories of Showers 20
B. Occurrence of Showers 22
C. Typical Undisturbed Day 24
D. Characteristics of Small Mesoscale Areas 26
IV. ANALYSIS OF INDIVIDUAL DISTURBANCES 29
A. Method of Analysis 29 B. 14-15 July 30 C. 16-18 July 32 D. 22 July 36 E. 25-26 July 39 F. Discussion of Results 43
V. DENSITY AND AREAL COVERAGE OF PRECIPITATION AREAS 46
A. All Situations 46
B. Undisturbed Conditions 49
C. Disturbances 50
D. Echo Height Distribution 52
VI. SUMMARY AND SUGGESTIONS FOR FURTHER STUDY 54
A. Summary 54
B. Suggestions for Further Study 57
TABLES 58
FIGURES 66
ACKNOWLEDGEMENTS 104
Hudlow, 1970).
2. Approximate rainfall rates (mm/hr) for given return 58 powers and ranges.
3. Evaluation of the synoptic condition governing the 59 radar coverage sector for each three-hour interval.
4. Number of shower echoes observed to last for speci- 59 fied time intervals as a function of the maximum
area achieved.
5. Average number of shower echoes in the area under 60 observation (56,000 mi2) according to size and various
other factors.
6. Total number of shower echoes observed and the percent 60 which had imbedded cells at the next two intensity
levels.
7. Results of the survey of small mesoscale areas. 61 8. Echo heights for two times during the 25-26 July 62
disturbance.
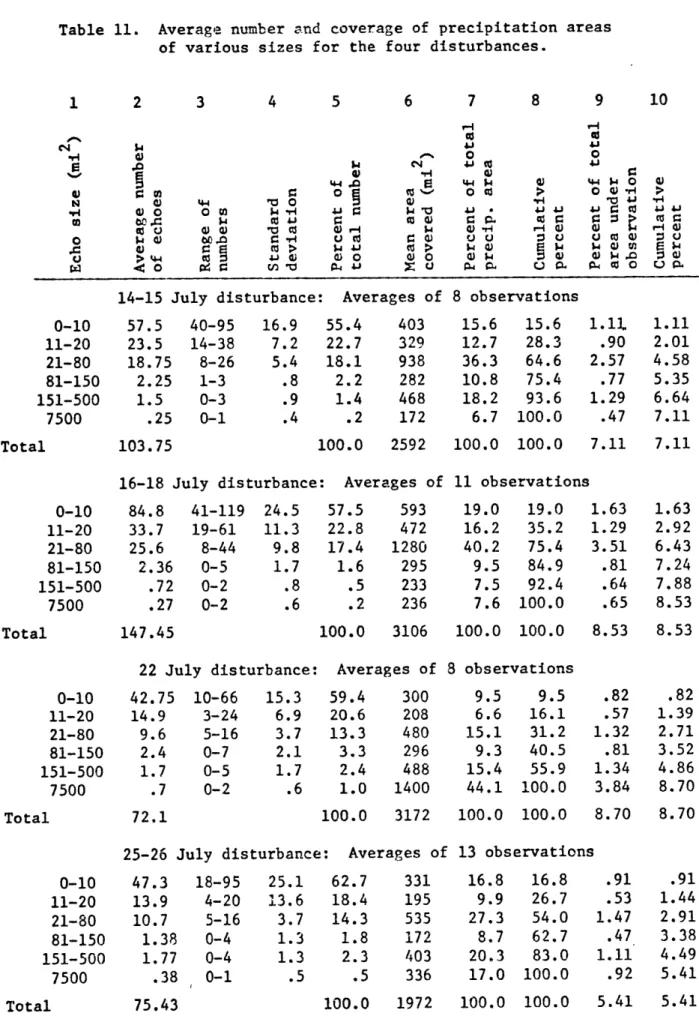
9. Average number and coverage of precipitation areas of- 63 various sizes for the three synoptic categories.
Area under observation:x36,000 mi2.
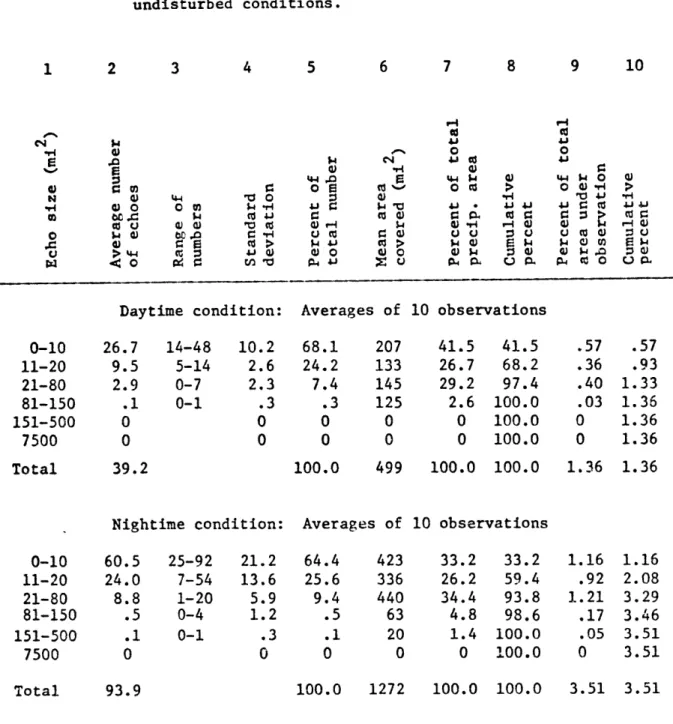
10. Same as Table 9 except for undisturbed conditions 64 (daytime and nighttime).
1. Illustration of the areal coverage of the radar. 66 2. Illustration of the off-center PPI scope. Range 67
markers at 25-mile intervals.
3. ESSA 9 satellite photograph sequence. 68
4. Method of tracking shower echoes. 73
5. Scatter diagram and linear regression line for maximum 73 area of showers vs. duration.
6. Distribution of durations of 82 showers in survey. 74 7. Illustration of shower size classification. 74 8. Representative precipitation maps for a typical undis- 75
turbed day.
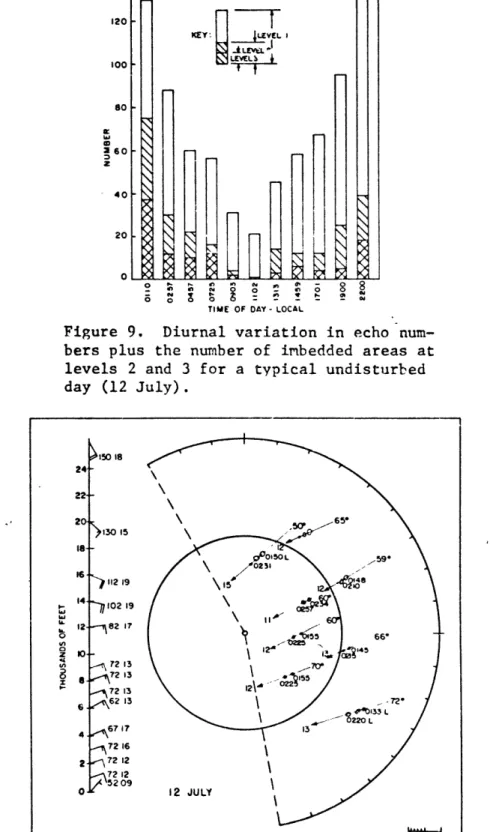
9. Diurnal variation in echo numbers plus the number of 76 imbedded areas at levels 2 and 3 for a typical
undis-turbed day.
10. Comparison of shower motions with wind sounding for 76 12 July, 0200L.
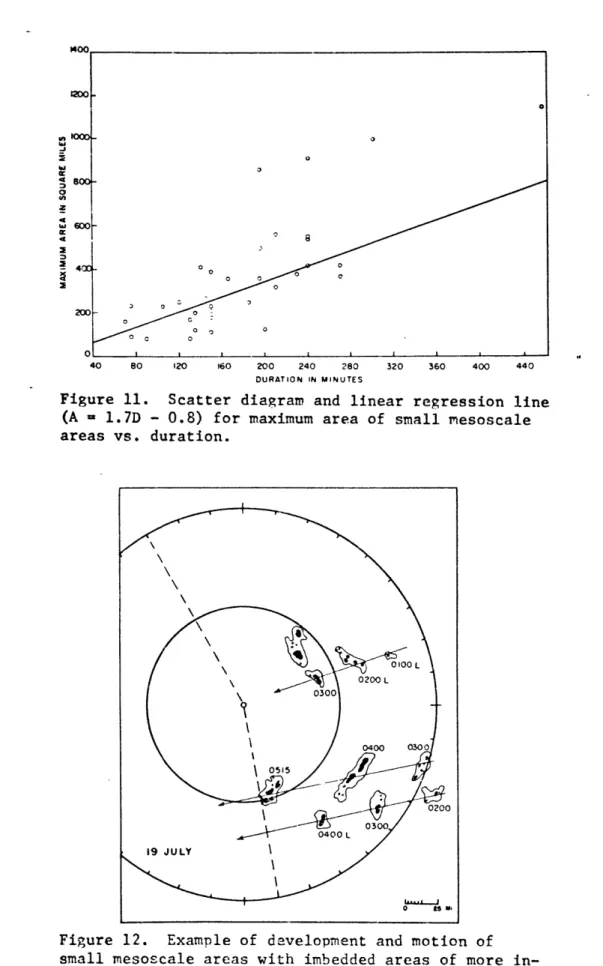
11. Scatter diagram and linear regression for maximum 77 area of small mesoscale areas vs. duration.
12. Example of development and motion of small mesoscale 77 areas with imbedded areas of more intense
precipita-tion.
13. Evolution of the 14-15 July disturbance (from Fernandez- 78 Partagas and Estoque, 1970),
14. Representative precipitation maps for the 14-15 July 79 disturbance.
15. Comparison of shower motions with wind sounding for 80 15 July, 0200L.
16. Relations between the lower tropospheric flow and 81 the "inverted V" cloud pattern (from Frank, 1969).
18. Representative precipitation maps for the 16-18 July 83 disturbance.
19. Comparison of cloud cover photographed by satellite 84 with the precipitation pattern on radar, 17
July-1422L.
20. Representative precipitation maps for the latter 85 part of the 16-18 July disturbance.
21. Same as Figure 19 except for 18 July/1325L. 86 22. Evolution of the 22 July disturbance (from FPE, 1970). 87 23. Representative precipitation maps for the 22 July 88
disturbance.
24. Evolution of the 25-26 July disturbance (from FPE, 89 1970).
25. Representative precipitation maps for the 25-26 July 90 disturbance.
26. 950-mb flow at 25 July/0800L (from Leary, 1972). 92
27. Shower motions at 26 July/ 0800L. 93
28. 950-mb flow at 26 July/0800L (from Leary, 1972). 93 29. Comparison of cloud cover photographed by satellite 94
with precipitation pattern on radar, 25 July/1430L.
30. Same as Figure 29 except for 26 July/1334L. 95 31. Comparison of precipitation pattern with divergence 96
field on 25 July/0800L.
32. Same as Figure 31 except for 25 July/2000L. 97 33. Same as Figure 31 except for 26 July/0800L. 98 34. Cumulative distribution showing the average number 99
of echoes smaller than the indicated size for the three synoptic conditions.
cent of the total precipitation area covered by echoes smaller than the indicated size for the three synoptic conditions.
36. Cumulative distribution showing the average per- 100 cent of the total area under observation covered
by echoes smaller than the indicated size for undisturbed conditions (daytime and nighttime), mildly disturbed, and disturbed conditions.
37. Same as Figure 35 except for undisturbed conditions 100 (daytime and nighttime).
38. Same as Figure 35 except for the four disturbances. 101 39. Same as Figure 36 except for the four disturbances. 101 40. Same as Figure 38 except with echo size plotted on 102
a logarithmic scale.
41. Same as Figure 39 except with echo size axis 102 extended and plotted on a logarithmic scale.
42. Cumulative distribution showing the average percent 103 of echoes with tops less than the indicated height
for the three synoptic conditions (derived from Hudlow, 1970).
43. Distribution of echo heights for the three synoptic 103 conditions.
Quantitative radar observations have shown that precipitation areas of several scales and intensities occur simultaneously in all types of storms. At one end of the scale is the synoptic precipita-tion area which is associated with the large-scale upglide moprecipita-tions which are part of the large-scale circulations. At the other end
are the small relatively intense showers produced by cumulus convec-tion. Intermediate between these two extremes of scale and intensity are mesoscale precipitation areas. The study of subsynoptic-scale precipitation areas is important not only in relation to precipita-tion mechanisms but because they cast some light on the nature of subsynoptic-scale circulations and their relation to larger-scale ones.
Measurements of meteorological quantities on the synoptic-scale are abundant because they can be obtained from networks which have the density of the regular synoptic reporting stations. Direct mea-surement on the subsynoptic-scale of many quantities is not feasible because of the high density of the required observing network. Pre-cipitation, however, is one quantity which can be measured on this scale by a suitably instrumented radar.
Some studies have been made of precipitation patterns in temper-ate latitudes. A fairly systematic analysis of precipitation patterns in New England has been made by Austin and Houze (1972) and Reed (1972).
The former found that there is fairly extensive cellular cumulus activity in most storms in New England. These cells were invariably found imbedded in small mesoscale areas of precipitation (,-,100 km 2 which have rather well defined characteristics and appear to have a close relationship with the cells which they contain. In more wide-spread storms the small mesoscale areas are imbedded in larger meso-scale areas of lighter precipitation (--000 km 2). The eight New England cyclones observed by Reed exhibited a marked banded precipi-tation structure. Virtually all of the cells and heavy rain were concentrated into these bands and large mesoscale areas which in turn were organized into "belts" which maintained a fixed position with
respect to the cyclone, extending from the cyclone center to approx-imately 500 km ahead of the center. Browning and Harrold (1969)
analyzed a wave depression over England in great detail. They observed bands with cells in them ahead of the warm front and parallel to it
and they also found bands in the warm section which were parallel to the winds there. Elliot and Hovind (1964) studied four storms on the California coast. Each contained bands of precipitation that were 20 to 40 miles wide and 30 to 60 miles apart (between centers). These bands contained all the cells and were trackable for up to three hours or 100 miles. The orientation of these bands appeared to be
associ-ated with the wind shear between the convective cloud layer and the adjacent layer above in a manner similar to that suggested by Malkus and Riehl (1964) for the occurrence of highly organized cloud rows over the tropical Pacific Ocean. The latter have a predominant mode
parallel to the trade winds since the convective cloud layers in the tropics are mostly imbedded within the trade winds. However when they extend up to the stronger she-x zones aloft a crosswind mode may dominate which is the usual condition in middle latitudes.
Actual radar measurements and analysis of tropical precipitation on a systematic basis are scarce except for the study of spiral rain bands in tropical cyclones (see for example, Fujita and Black, 1970). The major convective rainbands in tropical cyclones are generally oriented in circular or spiral bands, which converge near the center of the storm. The upward motion in these storms is concentrated in these rainbands and especially in the eyewall cloud and outer rain bands. The percent area coverage with radar echoes (i.e., degree of convective activity) decreases rapidly with height so that above 10 km only a small percent (usually less than 5%) of the area within 200 nautical miles of the storm center is covered with echoes.
From May through July of 1969, the Barbados Oceanographic and Meteorological Experiment (BOMEX) was conducted in part to examine the structure of tropical convective systems. In support of this objective, the Atmospheric Sciences Laboratory of the U.S. Army Electronics Command maintained time-lapse photography of an X-band weather radar scope located on the island of Barbados. Their goal was to acquire information concerning the origin, development, move-ment, size, and intensity of precipitation areas associated with
tropical weather disturbances originating or moving within range of the radar. Investigations on some aspects of the weather radar
research during BOMEX was made by Hudlow (1970). In the present study, a much more comprehensive analysis is made of the radar obser-vations during the fourth phase of BOMEX, 11-28 July. The aim is two-fold, (1) to study the characteristics of individual tropical showers and mesoscale precipitation areas, and (2) to observe patterns and distributions of precipitation areas in disturbed and undisturbed conditions noting any similarities and differences between typical patterns in tropical and temperate latitudes.
Radar data in the form of photographs of scope displays do not lend themselves to computer processing, so that although a large amount of data can be taken, only a limited amount can be subjected to thorough analysis. The current need is for quantitative radar data to be stored in digital form on magnetic tape. This calls for devel-opment of scanning routines which will maximize information and mini-mize redundancy. By considering the nature of precipitation patterns and distributions over the tropical Atlantic, this study may serve as a basis for developing such a detailed measurement schedule.
B. Outline
The data utilized in this study, the classification systems for the precipitation areas, and the methods used in formulating them are discussed in Chapter II.
In Chapter III, characteristics of individual showers and small mesoscale areas are investigated. Showers are also studied in a
statistical manner in relation to their diurnal variation, and the shower pattern of a typical undisturbed day is shown.
Four disturbances which affected the BOMEX region are analyzed in Chapter IV. The types and patterns of the precipitation areas are presented both verbally and through the use of representative figures.
Quantitative analysis of the size distribution and the total areal coverage of precipitation areas for various synoptic conditions is in Chapter V.
The final chapter summarizes the results, presents some compari-sons between tropical and New England precipitation areas, and gives recommendations regarding further studies.
II. DATA AND CLASSIFICATION OF ECHOES AND WEATHER CONDITIONS
A. Data
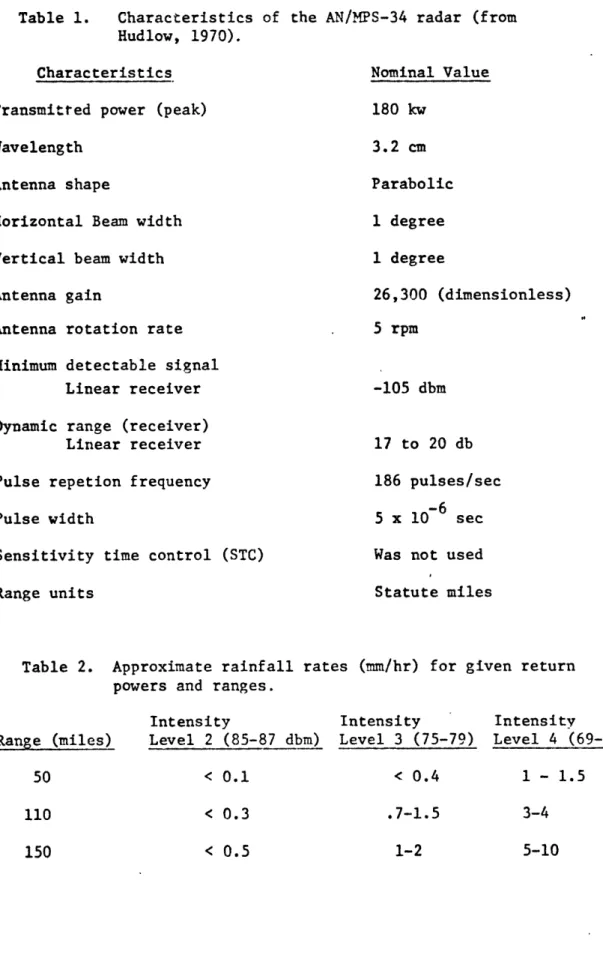
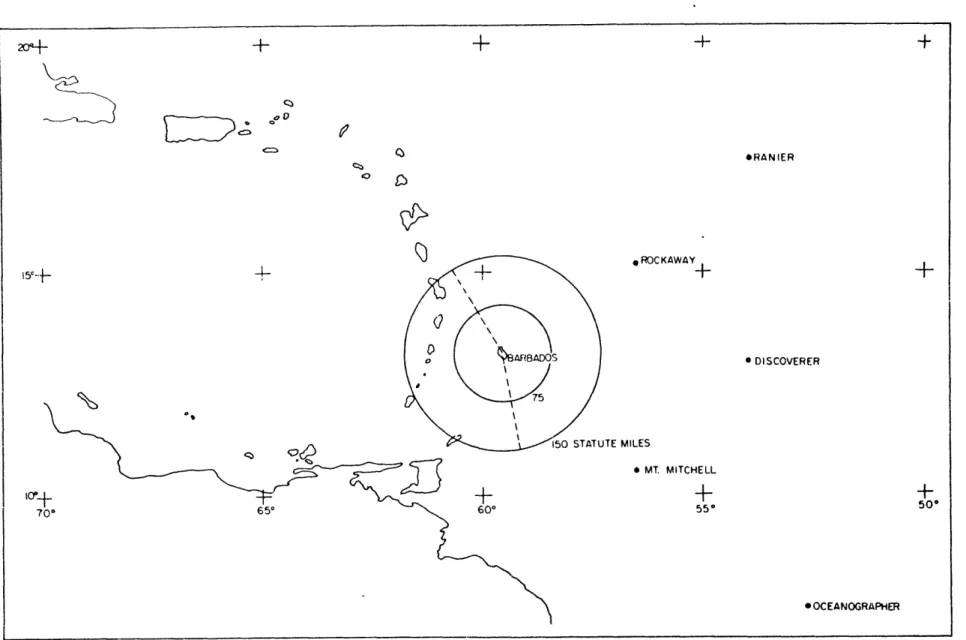
The main source of data for this study was radar data in the form of 16 reels (100 ft per roll) of 35-mm film containing time-lapse photo-graphs of the Plan Position Indicator (PPI). Description of the radar and the mode of operation are given by Hudlow (1970) and summarized here. The radar was a van-mounted AN/MPS-34 located on Barbados, at 130 12' N, 590 320 W. It was positioned at a vantage point on the island with the antenna at an altitude of 950 ft above mean sea level thereby providing an extended radar horizon. The elevation angle was at a nominal 0 permitting detection of targets at ranges of 200 miles or greater. Characteristics of the radar are listed in Table 1. Figure 1 illustrates the extent of the areal coverage realized by the radar.
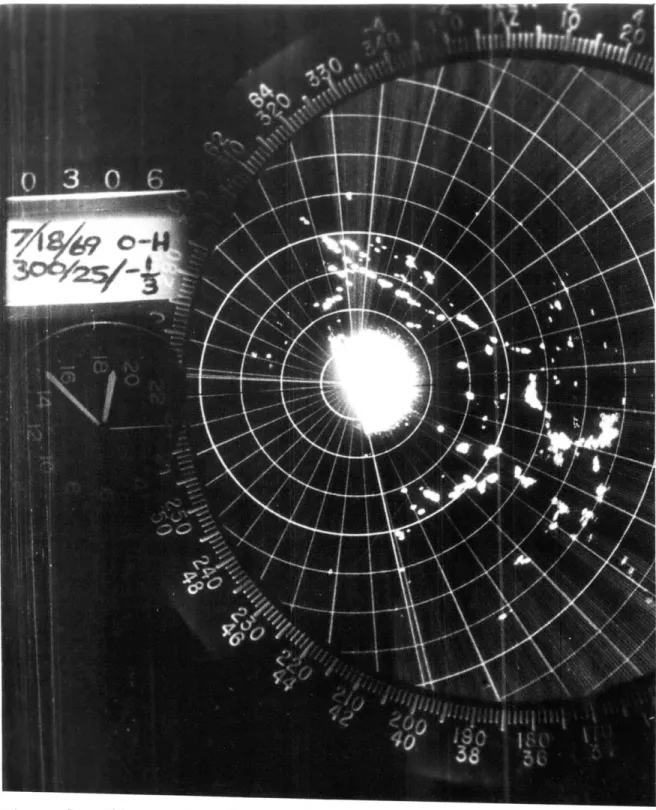
PPI photos depicted an off-center scope (Figure 2) so that a mag-nification of the prime geographic areas could be realized. Ground clutter persisted out to 30-40 miles. A cyclic elevation of the anten-na to 7 for a sector of about 100 in azimuth resulted in an almost total loss of echo information to the west of Barbados. This was a pre-cautionary measure to prevent excessive doses of microwave radiation to residents living west of the radar.
In addition to normal PPI photographs at full receiver gain, an intensity level sequence was taken every hour by reducing the receiver gain in known steps. A total of five gain steps yielded increments of
18 db, 8 db, 8 db, 8 db, and 6 db for steps 1 through 5 respectively. In this study, level 1 will refer to normal (full receiver) gain, leve" 2 to gain step number 1 or 1S db less and so on. Rainfall rates (R) can be empirically related to the radar reflectivity factor
(Z) of the target. Some rainfall rates for given return powers and ranges using the AN/MPS-34 radar constant and an empirical Z-R rela-tionship for Marshall Island drop-size spectra are in Table 2. Radar
echoes were rarely observed above level 3. Therefore these rainfall rates appear to be extremely low for tropical precipitation which leads one to suspect an error in radar calibration. Even if there should be a sizable error in the calibration, the AN-MPS/34 is a sen-sitive radar which should detect light rain (1-1 mm hr
1)
over most of the area involved. Therefore the data are considered adequate to depict the quantities considered in this study, i.e. number and size of precipitation areas and the extent to which they contain small cells of higher intensity.0 Height sequences (consisting of PPI photos for each 0.5 in elevation up to the elevation where all echoes disappeared) were taken
twice daily with a polaroid camera although not every day. Computation of these data by Hudlow (1970) was used in this study.
A meteorological satellite provided photographic coverage of the data network during BOMEX. The polar orbiting satellite, ESSA 9, made one pass per day over the BOMLEX area at an altitude of 910
sta-tute miles. A sequence of these photographs for selected days over the period is shown in Figure 3. Pictures from this satellite were
used to get a general idea of the cloud patterns associated with pre-cipitation areas on radar and to track the movement of disturbances through the area.
Upper air rawinsonde soundings, in the form of teletype-reported winds, taken at Barbados were used to compare echo motions with the observed winds.
B. Classification of Echoes and Weather Conditions
A preliminary survey of the radar film was taken early in this study to obtain a general impression of the sizes and shapes of echoes observed during the 16-day period. Particularly noted was the predo-minance of small rather widely scattered precipitation areas at almost all times in the period. In addition, larger areas were observed at times of disturbances, which were identified from other studies of the BOMEX fourth phase weather phenomena (Fernandez-Partagas and
Estoque, 1970; Janota, 1971; and Leary, 1972). From the preliminary survey, it seemed that the largest echoes which appear on undisturbed days were approximately 10 miles in diameter. Therefore areas of this size or smaller are denoted showers while the larger ones, which typically appear only during disturbed periods, are called mesoscale
areas of precipitation. However, since the occurrence of elongated echoes made classification by dimension difficult to implement (e.g. 10xlO mi vs. 10xl mi), the limit was set at an area of 80 mi2 (approximately the area of a circle 10 miles in diameter). It differs somewhat from that of Austin and Houze (1972) who defined "cells",
presumed to be single cumulus convective elements, as areas smaller than 50 km2 while any larger ones were called mesoscale areas. Their study, however, was concerned witn smaller-scale precipitation aceas imbedded within larger ones. Here, where sizes of separate areas are considered, the application of the term mesoscale only to areas in excess of 80 m is convenient; there is no implication that smaller areas represent single convective cells.
Two studies were made on the showers. In the first, an analysis of characteristics and behavior of individual shower described in
2 Chapter III, showers were stratified into size intervals of 0-5 mi,
2 2
6-20 mi, and 21-80 mi . This classification was based on circular areas with diameters of 2.5, 5, and 10 miles. The study of shower
2
size distribution in Chapter V used size intervals of 0-10 ni, 11-20
2 2
mi, and 21-80 mi. The decision to increase the first interval by
2 2
5 mi was due to an overabundance of echoes in the original 6-20 mi interval. Consistency of such a classification suggests a further
2
division at 40 mi, thereby doubling the area for each group, but the time-consuming reality of an additional interval ruled it out.
On the mesoscale, another classification was made. During disturbed periods both numerous showers and some larger precipitation
areas occurred. Sometimes they appeared to be randomly scattered but at others they became concentrated into a recognizable feature such as a band or a more or less circular or oval group. These concentrated areas moved as a single unit and after persisting for many hours
decayed as a unit although they were made up of individual non-con-nected echoes. The individual connected areas larger than showers were called small mesoscale areas (SMSA's) and a concentrated area of echoes denoted a large mesoscale area (LMSA). SMSA's were gener-ally between 100-1000
ni
2while LMSA's were 10 3-104 mi 2which includes the clear areas between the non-connected components. The large areal extent and long durations of LMSA's made it difficult to track them for their entire lifetimes.Except for the lower limit of the SMSA class, these classifi-cations based on the precipitation patterns observed in the Barbados area are the same as those set up by Austin and Houze (1972) for New England storms. They further define a synoptic area of precipi-tation as greater than 104 km2 and found such areas associated with each of the cyclonic storiis in their sample. No such large precipi-tation areas were found in the BOMEX data sample, nor were connected areas of LMSA size observed.
As already mentioned, there were notable differences in pre-cipitation patterns between disturbed and undisturbed periods. The criteria for classifying a period as being disturbed were such
synoptic-scale phenomena as wave troughs or cyclonic vortices at the surface, middle and/or upper troposphere. Disturbed times were determined from analytic work done by Fernandez-Partagas and Estoque
(1970), hereafter referred to as FPE, and Janota (1971). They noted four disturbances which affected the coverage area during the
perti-nent time period. A two-step method fo2 classifying three-hour time intervals into synoptic categories was devised. The basic scheme was to classify each day as disturbed
or
undisturbed according to the above mentioned synoptic studies and to further refine this into three-hour intervals by observing the state of activity on the radar PPI. It became apparent that a transitional category was needed to breach the gap between undisturbed and fully disturbed. This category was called mildly disturbed. A certain amount of sub-jectivity was involved in this differentiation. Table 3 lists the results of this classification for the 16-day period.In the studies of undisturbed periods, the data were sometimes classified as either daytime or nightime observations. This classi-fication was employed to study the diurnal variation of showers which is characteristic of und'sturbed days (Riehl, 1954). Two different methods were used for taking daytime and nightime observations. In
the first, PPI tracings were selected twice daily at approximately the same daytime and nightime hours. These hours were characteristic-ally times of minimum and maximum echo activity. In the second method used in Chapter IIIB, observations taken at all hours were classified as day or night depending on the local sun time. Daylight hours in the area, neglecting twilight, were 0700 to 1700 local time; 2000 to 0500 L were nightime hours.
III. SURVEY OF SHOWERS AND SMALL MESOSCALE AREAS
A. Life Histories of Showers
To study the characteristics of individual showers, 82 showers were observed for their entire lifetimes; specifically, the total duration and the area at various times were recorded. Selection was random and involved a good deal of subjectivity, but care was taken to cover the entire size range and both disturbed and undisturbed periods. No recognition was made, though, as to the synoptic
condi-tions under which these showers were observed. Echoes were tracked by tracing them from projections on a film viewer from one PPI se-quence to the next as in Figure 4. Sometimes echoes could not be tracked for their entire lifetime for one or more of the following reasons:
1) deformation of an echo causing a division; 2) merging of the original echo with another; and, 3) long elapsed time between successive PPI frames.
The selection was restricted to fairly isolated echoes because of the high probability of showers merging in densely populated areas. As
long as a shower was recognizable as the original one through any mergings and/or divisions, it was retained as part of the sample.
Showers were classified on the basis of maximum size during their lifetime. The larger the size of the shower became, however,
the more difficult it was to follow its life history. Showers-greater than 30 rd usually contained two or more smaller imbedded echoes of higher intensity. This fact made it more probable that a shower of such size would divide into these components during its lifetime and even more likely as it was dissipating. The larger echoes more fre-quently merged with other echoes making recognition of the original
one difficult. A more appropriate name for these large showers might be cell clusters or cell complexes.
A typical shower lifetime might be characterized qualitatively by the stages of development, division and/or merging, dissipation, and disappearance. The variability of these processes other than beginning with development and ending with dissipation allows no pre-cise set of rules for governing shower behavior. The development may begin as the appearance of an echo where none existed minutes earlier or by division of one echo into two or more. Only echoes which deve-loped by the former process were used. The rates of development and dissipation can be quite rapid, a matter of one or two minutes, or they may last for several minutes. Shower growth may be either by the expansion of an echo, the growth of new showers immediately next to the old one, or the merging of new showers with the original. Divisions or mergings may be totally absent in the lifetimes of some showers but the probability of these processes increases for larger showers. There appeared to be no preference for showers to divide and then merge or vice versa.
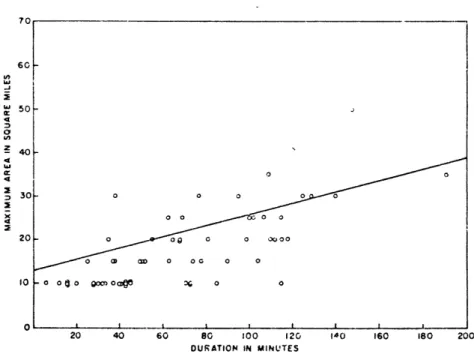
Comparison of maximum area and duration of showers, summarized in Figure 5 and Table 4 shows that larger showers usually have longer lives. The correlation coefficient was computed to be 0.6. Table 4 further reveals a substantial range in duration within each size category exemplifying the variable nature of showers. The difficulty
in tracking large showers for their total duration is reflected in their small number in the sample. The longer durations of the larger
showers implied that these echoes contained more than one cell during their lifetime. This was generally observed from the intensity level sequences and also from the shape of the echo. The frequency distri-bution of the durations of the sample showers is given in Figure 6.
Shower motions were observed but differed substantially on disturbed and undisturbed days. They are therefore considered
separately for the individual disturbances (Chapter IV) and for undis-turbed days (Chapter IIIC).
B. Occurrence of Showers
This section deals with the statistical aspect of showers in relation to their day/night variability of occurrence and according to whether they were taken in disturbed or undisturbed conditions. PPI tracings of the total precipitation area were taken twice daily, one at approximately midday and another at late night or early
morning. These times were chosen because they have been shown to be statistically the hours of minimum and maximum convection in this
region (Hudlow, 1970). The area under observation was inside a square surrounding the radar site and between azimuths 330 and 1700 as shown in Figure 7. The total area under observation was
approx-2
imately 56,000 mi. These tracings were taken for all days except when the radar was not operating. Echo areas were determined using a transparent overlay grid. Echoes were grouped into size intervals
2 2 2
of 0-5 mi, 6-20 mi, and 21-80
ml,
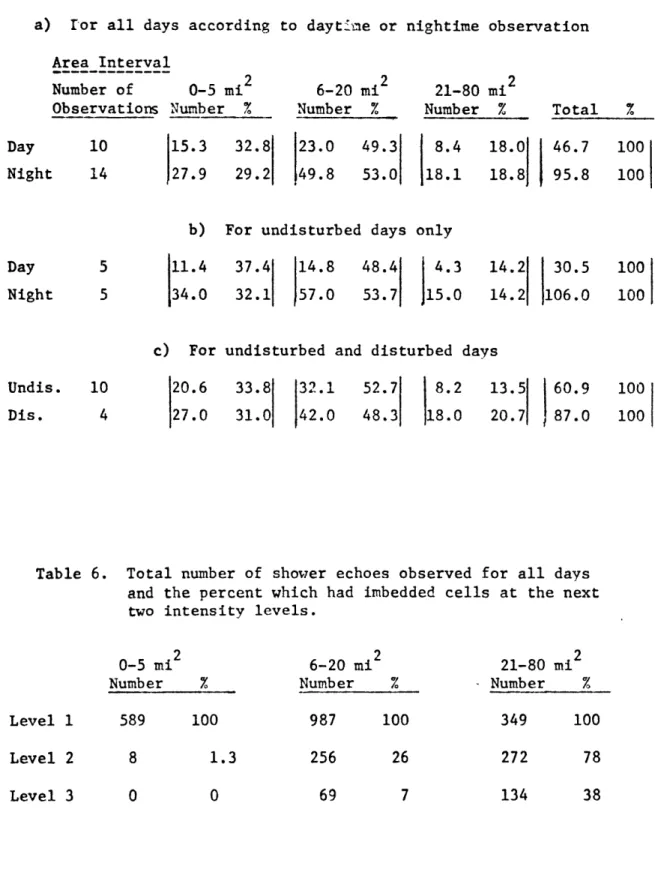
and the number of echoes in each interval was counted and tabulated. Averages were found for qach size interval for the 10 daytime and 14 nighttime observations. Similar averages were determined for day and night on only undisturbed daysand for undisturbed and disturbed respectively without regard for time of day. It should be mentioned that echoes with areas greater
than 80 mi2 appeared on a number of the tracings but were ignored in this analysis, which is concerned only with showers.
Table 5 gives the results of this survey. There is a notice-able diurnal variation in shower numbers with an increase in showers from day to night. For all days, this increase is about a factor of two and becomes a factor of three on undisturbed days only. Hudlow has attributed this diurnal variation to the differential cooling between the sea surface and the overlying layers of moist air during late night and early morning hours. For undisturbed days, not only are there three times as many showers at night as in the daytime but
also there is a tendency for them to be bigger, as seen in the relative percentages. There is an increase of abcut 40% in the total number of
(Table 5c). The most pronounced increase is in the largest size category. It should be realized that on disturbed days, there are additional mesoscale areas which ar2 not included in this count.
An investigation of tropical shower intensities was attempted based on the same group of observations which were all at times of when intensity level series were taken. The number of level 1 echoes which contained imbedded cells or small areas of levels 2 and 3 was
recorded without any grouping according to synoptic condition or time of day. The results are listed in Table 6. It shows that an increasing percentage of echoes contain higher intensity levels as echo size increases. Because of the lack of range normalization and uncertainty in the radar calibration, no attempt was made to inter-pret these results in terms of actual rainfall intensities in the showers.
C. Typical Undisturbed Day
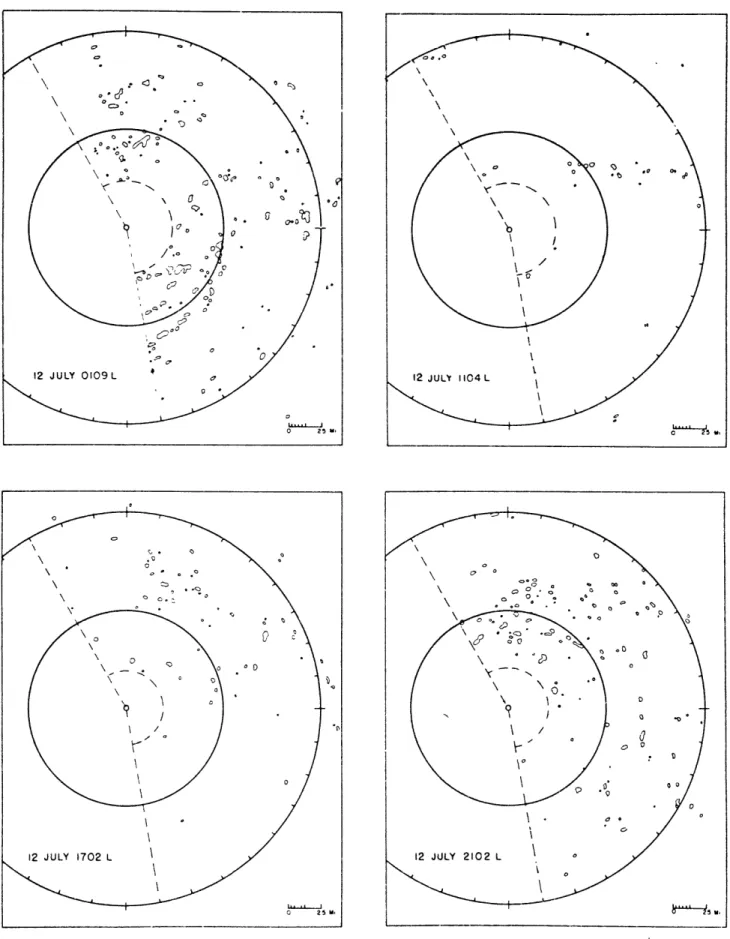
Since showers are so characteristic of undisturbed days, a single day was chosen to examplify the distribution of showers and the diurnal variation common to this type of day. The selection of
12 July was based on the fact that it was in the middle of three relatively undisturbed days at the beginning of Phase IV. Figure 8 contains four PPI tracings for this day showing the distribution and variation in echoes. Figure 9 shows the variation in echo numbers as well as the number which contained areas at intensity levels 2 and 3.
There was often a tendency for showers to occur in clusters or only in one quadrant of the radar scope as for example in the northeast quadrant at 1702L, Figure 8. Such occurrences seem random in nature. The organization of shower echoes into well-defined rows was not readily apparent during undisturbed days but there was a
tendency for larger showers to become elongated in the direction of motion. A typical cloud pattern for undisturbed day is characterized by the scattered clouds as seen in the square area bounded by longi-tudes 60 W and 55 W and latilongi-tudes 25 N and 20 N on 24 July (Figure 3).
Shower motions were observed early on the morning of 12 July and were compared with the wind sounding at 0200L from Barbados
(Figure 10). Shower directions varied by 22 but all were generally from the ENE, the prevailing wind direction. Speeds ranged from 11 to 16 knots. Best agreement in direction and speed is with the wind near 6000 ft. This example is typical of other undisturbed days when shower motions were observed. Showers generally moved with the low-level winds but an exact steering low-level was difficult to determine because the variation in wind direction in the low troposphere was small. On undisturbed days, the easterly current of the trade winds ranged in depth from 16,000 to 30,000 ft. Echo heights on undisturbed days derived from Hudlow's data (5 observing times from 20, 21, and 23 July) show no echoes over 17,500 ft for two daytime observations and heights up to 40,000 ft for three nightime observations. The majority of echoes were under 12,500 ft for the two daytimo observa-tions and less than 14,500 ft at nighttime.
D. Characteristics of Small Mesoscale Areas
Small mesoscale areas were observed in a manner similar to that employed in studying the characteristics of showers. Thirty-four SMSA's were selected more or less at random but subjectively to cover a fairly wide size range and different synoptic conditions. SMSA's were defined as precipitation areas larger than 80 mi2 which remained connected during their lifetime. The selection process was hampered in the same way as for showers by difficulties in
distin-guishing the original echo under observation through a number of di-visions and mergings. With small SMSA's, it is particularly difficult
because they are "flaky" and have a high likelihood of breaking up. With the larger ones, this problem was not as pronounced because they
retain their identity more effectively.
The development of SMSA's was by three ways. One method was the merging of showers in a densely populated area. The second pro-cess was by the expansion of an established cell cluster or complex
2
into an area greater than 80 mi . This second process is actually' similar to the first since the cell clusters often form by the mer-gings of small showers which were originally close together but separate. The third process was a kind of "fission" where a SMSA
2
divides into two new areas which are both greater than 80 mi . The mature stage of a SMSA was generally characterized by a continual change of shape and size through mergings, divisions, and internal deformation. Many SMSA's, however, maintained their overall shape
such as oval or elongated and were easier to track. The dissipation stage was typically seen as a shrinking of the whole area followed by a break-up or division of the SMSA into many showers. At otner times, SMSA's just divided unexpectedly into areas too small to be called mesoscale areas by the definition in use. When a division
.2
left some components larger than 80 mi , a subjective decision was made as to whether the original area was still evident and trackable or the duration should be ended.
Each SMSA studied was classified by the maximum area attained in its lifetime. Tracings were made, wherever possible, at times with intensity level sequences. The average number and maximum area of imbedded echoes at level 2 was determined for each SMSA. Echoes were rarely observed above level 3.
As noted from the preliminary survey, mesoscale precipitation areas occur mostly during disturbed periods. Therefore of the 34 areas studied, 21 were from disturbed periods with 11 at mildly dis-turbed times and only 2 on undisdis-turbed days.
The range in maximum area of the sampled SMSA's was 80-1150
.2 2
mi . Generally, they were between 100 and 500 mi at their maximum. Table 7 lists the characteristics of 34 SMSA's. Durations ranged from 1 hr 10 min to 7 hr 30 min. The average maximum area was 363 mi2 and the mean duration was 183 minutes. Mean sizes and durations are probably not as significant as distributions because of the rather small sample and casual sampling technique. Figure 11 is a scatter
diagram of maximum area vs. duration. There appears to be a continu-2
ous range of areas up to about 600 mi with much larger ones showing up on four occasions. The correlation coefficient between size and duration was computed to be 0.7 when not considering the four SMSA's
greater than 800 mi 2
The average number of imbedded echoes in each SMSA was 4.8. 2
They ranged in size from 5 to 30 mi2. Some imbedded areas reflected the shape of the SMSA, especially the elongated precipitation areas. This type often had a thin continuous line of imbedded precipitation or non-connected echoes oriented along the axis of elongation as in Figure 12. Generally, imbedded areas were round with an area less than 10 mi2 but they became larger as the size of the SMSA increased.
IV. ANALYSIS OF INDIVIDUAL DISTURBANCES
A. Method of Analysis
Four synoptic-scale disturbances were evident during Phase IV of BOMEX. Fortunately, at least a portion of the 2000 azimuth sector for observation of precipitation experienced precipitation areas
related to each of these storms. In order to study the types and dis-tribution of precipitation areas from these disturbances, the radar PPI was observed for the duration of each storm and selected PPI traces were taken at enough times to provide an adequate and repre-sentative composite of the rain patterns.
A synoptic analysis of the evolution and type of disturbance is presented for each storm. This information came essentially from three sources; a preliminary report on meteorological conditions during Phase IV of BOMEX by FPE (1970), an analysis of conditions during the period 13-21 July by Janota (1971), and a case study of the last disturbance by Leary (1972). ESSA 9 satellite photographs pro-vided additional information on associated cloud cover. The synoptic analysis is followed by a description of the precipitation pattern. Whenever possible, shower motions were analyzed in relation to the Bar-bados rawinsonde sounding. The motion of mesoscale areas was difficult
to determine because of their constant change in shape and hence were not matched with the wind soundings. The analysis of the final
dis-turbance will be in more detail because of the availability of more data.
The identifying dates for each disturbance are those days on which they affected the radar coverage area.
B. 14-15 July
1. Synoptic Situation
This weather system was first detected from satellite pictures as a broken cloud field near 14 N, 44*W on 12 July and moved to 14 N, 49 W by 13 July. The earliest history of this travelling disturbance can be traced back to an African origin (Janota, 1971). By 14 July, this disturbance had intensified considerably and appeared on satel-lite photographs as a large cloud cluster extending over a region 8
in latitude and 5 in longitude. Throughout this early period, the disturbance appeared on synoptic analysis charts as a wave trough at 700 mb with the associated cloud cluster to the east of the trough axis in a manner suggestive of a classical easterly wave. An upper-level cyclonic circulation developed at 35,000 ft by 15th/0800L near
Y 0
16 N, 59 W. The 700-mb perturbation weakened on the 15th and was difficult to locate by 0800L. The upper-level cyclone intensified during the 15th and moved northward out of the BOMEX region. The evolution of this disturbance is shown in Figure 13. Satellite
pic-tures were viewed but were not in a form for presentation in this study.
2. Precipitation Pattern
The radar coverage of this disturbance was limited. Data were missing from l4th/1000 L, at which time echo activity was beginning
to appear 200 miles to the east of the radar site, until 15th/O0OOL when the leading edge of the precipitation reached Barbados. The resumption of data showed the westward movement of a scattered area of precipitation which moved out of the eastern sector by 15th/0800L,
(see Figure 14 for representative precipitation maps).
The most notable feature of the precipitation was the scattered area of echoes which gave the appearance of being in a band. Such a band is not readily seen in the selected PPI's but is more inferred from a knowledge of the orientation of the cloudiness at this time. The length of this "band" extended through the coverage sector in both north and south directions. This is in agreement with the N-S oriented 700-mb wave axis.
Individual precipitation areas varied in size but none exceeded
2 2
500 mi2. The larger precipitation areas (greater than 30 mi ) showed a tendency to be elongated in a NW-SE direction. In terms of numbers,
2Y
echo sizes less than 10 mi2 predominate but cell clusters and SMSA's contribute more to the total area over which precipitation is occur-ring. This aspect of size distributions is covered in more detail
in Chapter V.
The pattern of precipitation was constantly changing within any mesoscale precipitation area but the overall orientation of the band of scattered precipitation remained fairly constant.
The 0200L wind sounding on the 15th from Barbados shows a deep basic easterly current with increasing velocities to about 12,000 ft.
0 0 The shower motions observed at this time show a bias of 10 to 20 to
the right of the direction of the low-level winds. Shower speeds were much larger than on undisturbcd days with the best agreement with the winds between 7,000 and 9,000 ft. Larger echoes showed a
tendency to be elongated in a NW-SE direction which is in the direc-tion of the shear vector between the lower-level winds and the winds at 12-14,000 ft.
C. 16-18 July
1. Synoptic Situation
As in the 14-15 July disturbance, the first evidence of this storm was seen on satellite photographs. As early as the 15th,
cloud-0
iness could be seen near 50 W. On the 16th, an arc-shaped band of 0
cumuliform clouds was near 56 W. A rapid intensification of the cloud mass on the 17th was associated with a 700-mb wave which formed in
situ near 56 W with clouds in the vicinity of 60 W. The steady move-ment of 6 longitude per day implied a wave speed of 15 knots.
Fig-ure 3 presents satellite photographs of the cloud cover for the 16th, 17th, and 18th.
Janota (1971) analyzed the formation of the 700-mb wave as a moderate perturbation on the easterly jet. The resultant intensifi-cation of cloudiness was found to be in a cyclonic vorticity maximum induced by horizontal shear south of thejet. Frictionally induced convergence in the positive vorticity field became better organized on the 17th and allowed the storm to tap the high moisture content
The major portion of cloudiness precedes the wave axis at 700-mb in contrast to the first disturbance where cloudiness was east of
the wave axis. The shape of the cloud bands or streaks (Figure 3, 17 July) as well as the vorticity maximum (Janota, 1971) resemble the "inverted V" cloud pattern described by Frank (1969) (see Figure 16). In this variation of an easterly wave, cloudiness is predominant on both sides of the wave axis.
The 700-mb wave disappeared within a few hours after 17th/1400L. FPE show that a new wave formed at 8000 ft by 17th/2000L near 620W in association with a slowly moving trough seen in their 20,000 ft anal-yses. This system progressed northward with an extensive area of cloudiness associated with it. The development of this new system is significant in regards to the precipitation areas observed by the island radar. Although this new system moved northward out of the Barbados area, a remarkable increase in the intertropical convergence zone (ITCZ) cloudiness occurred over the Atlantic along a line extend-ing east-southeastward from the main cloud mass and through the radar coverage sector. Figure 17 shows the evolution of the disturbance.
2. Precipitation Pattern
The orientation of the cloud system from NE to SW brought the first noticeable precipitation from this disturbance into the southern half of the coverage sector by the afternoon of the 16th. There was a gradual increase in precipitation to the north as the arc-shaped
line of clouds
roved
westward. Precipitation covered the whole sec-tor in a scattered fashion by early morning of the 17th. Theprecip-itation pattern was similar to tha; of the 14-15 July disturbanoC in the widespread scattered nature of the rain and the fact that it consisted mostly of showers or shower clusters. Precipitation areas became larger in size in the northern part of the sector as the north-ern portion of the arc-shaped band of clouds moved westward into the
radar coverage sector. This increase might be attributed to the advance of the trough line to the rear of the first sign of precipi-tation or associated cloud band as seen in Figure 16. This figure shows that the cloud bands have a cross-flow orientation and are probably more closely aligned to the lower-level wind shear than to flow at any one level. Frank states that frequently the "V's" were considerably flattened or rounded.
Representative precipitation maps for four times during this disturbance are presented in Figure 18. The largest precipitation
areas were observed on the afternoon of the 17th to the north of 2
Barbados with one SMSA greater than 500 mi . This major activity occurred at the time of the passage of the trough axis. This active area moved northward out of the sector and was followed by very wide-ly scattered shower echoes.
Figure 19 shows a portion of the ESSA 9 satellite photograph at 1325L enlarged to the same scale as the PPI trace at this time. By crude estimation, radar echoes cover less than 1/3 the area covered by clouds. This suggests that clouds spread considerably
beyond the actual precipitation areas. Clouds may be in different stages of development, some actively precipitating, some probably not sufficiently developed for precipitation to have begun, and some possibly dissipating. Furthermore, the cloud elements are not all the same height. At a range of 63 miles, the AN/MPS-34 beam
center was at 3,000 ft; at 113 miles it was at 7,330 ft; and at 138 miles range it was at 10,500 ft (Hudlow, 1970). At long ranges only
the taller echoes are being sampled.
The development of the new upper-level trough brought wide-spread cloudiness to the islands north of Barbados on the 18th and 19th but more significant in the relation to the radar coverage was the northward penetration of the ITCZ in conjunction with the
dis-turbance to the north. Figure 3 of satellite photographs on the 18th and 19th reveals this cloud line trailing from the main cloud mass to the NW. This band of clouds is reflected in the radar PPI traces as a persistent area of convective activity which gradually moved southward during this period, (see Figure 20 for representa-tive PPI's at this time). Echo areas were generally less than 80 mi2
2
although some areas were observed up to 400 mi . The elongation of echoes in the same direction as the orientation of the cloud band was clearly evident at times. A comparison of the radar echoes and
the cloud cover is shown in Figure 21. The ratio of the echo area to the cloud cover was estimated to be about 1/4. The resolution of satellite photograph enlargement prevented the detection of clouds
associated with the smaller echoes. A somewhat similar comparison by Martin and Suomi (1972) did not produce quantitative results, but
they reached the same qualitative ,onclusions. Their study compared selected enlarged BOMEX radar images for seven days in July with nearly simultaneous brightness-contoured ATS-satellite images. They noticed almost a one-to-one correspondence between small echoes and
small isolated clouds. They also found a consistent agreement between very bright areas and large echoes in a variety of synoptic situations.
The only available information of echo heights (Hudlow, 1971) indicated that some echoes were greater than 40,000 ft in height on the 18th. The majority of echo tops were between 10,000 and 26,000 ft.
D. 22 July
1. Synoptic Situation
FPE (1970) describe this disturbance as an interesting case of interaction between the ITCZ and upper-level cyclone development. The evolution of this system is illustrated in Figure 22. The early history appeared to be associated with a small low-level ITCZ cyclonic vortex. By 20th/2000L, a 25,000-ft upper-level cyclone was detected near Barbados. This system moved slowly northwestward over the
Lesser Antilles chain. It intensified as indicated by a closed cir-culation at 16,000 ft by 22nd/0800L.
At the time precipitation was observable by the radar, the upper and middle-level cyclone was located well to the northwest of
the main area of cloudiness. It appeared that this main cloudiness was associated with the ITCZ which had moved northwestward from the previous day in a northward "bending". On subsequent days as the
cyclone moved northward, the main cloud mass became completely de-tached from the ITCZ.
2. Precipitation Pattern
The position of the ITCZ in association with the upper-level disturbance on the morning of 22 July permits a good view of the
radar echo distributions within the ITCZ. The stage of ITCZ develop-ment differs from that observed on the 18th and 19th. During those
days the ITCZ was a single well-developed band. On 22 July the ITCZ was not a continuous band of cloudiness but was fractured and ill-defined with an isolated region of cloudiness southeast of Barbados being the prominent feature. This cloud mass appeared to break away from the ITCZ at a time of dissipation and to move northward in con-junction with the intensifying cyclone to the north.
Throughout the morning of the 22nd, a large mass of echoes was observed to the south of Barbados. This area moved west and could not be tracked because of the blackout of the western sector. The concentration of echoes was in marked contrast to the scattered
echo pattern of the two previously discussed disturbances. Figure 23 shows the representative precipitation patterns for various stages of the disturbance. The coverage of precipitation in this
the total area of precipitation was the largest observed in this 2
study. One connected area was approximately 3600 mi . Such an area forms by the mergings of many SMSA's and showers in a densely popul-ated area. T1he total areal extent of precipitation in this disturb-ance made it a good example of a large mesoscale area as described in Chapter IC. A LMSA is made up of showers and SMSA's and continu-ally changes in appearance and size. Although the precipitation areas are not connected, the whole pattern moves as one unit. Dura-tion of LMSA's usually exceeds four hours. Their large areal extent and duration make it difficult to track these areas for their entire lifetimes. This LMSA was a particularly good example because the concentration of precipitation areas contrasted with the generally clear region to the north. Its position with respect to the radar precluded any total areal measurement although in its largest observed extent it had dimensions of 100 by 150 miles including the gaps in
between individual echoes. It was observed for 10 hours.
The unusually large total area of precipitation in this dis-turbance likely results from the well-correlated strip of boundary layer positive vorticity and convergence, and the ITCZ cloud band. Such an organized region of convergence was not evident in the pre-ceding two disturbances (Janota, 1971). The growth of tropical disturbances has been suggested to follow a mechanism called
condi-tional instability of the second kind (CISK) by Charney and Eliassen (1964). In its simplest form, this hypothesis stresses an in-phase relationship between cyclonic vorticity and convergence in the
Ekman layer. In a tropical disturbance, a region of cumulonimbus cells warms the atmosphere through the release of latent heat; this hearing lowers the surface pressure slightly which increases the low-level convergence because of frictional turning in the boundary layer. This convergence produces more cumulonimbus which causes more latent heating thereby lowering the surface pressure even more and so on (Atkinson, 1971). In the ITCZ, the established zone of convergence acts as a mechanism to bolster the CISK cycle and thus increase the extent of convective activity.
Showers were not tracked because larger areas were the pre-dominant feature of the precipitation pattern.
E. 25-26 July
1. Synoptic Situation
This disturbance was classified as a warm-core tropical depres-sion. The early history of the development of this storm (Figure 24) was analyzed by FPE in their preliminary report. As early as 22 July, this disturbance was observed as a vortical system imbedded in the
0 0
ITCZ near 6 N, 44 W. A movement to the northwest brought the vortex center within 50 miles of Barbados on the morning of the 26th. The maximum wind observed in this storm was 38 knots with the highest sustained winds on the order of 30 to 35 knots. The vortical circu-lation was found at both 950 and 850 mb on the 25th and 26th (Leary, 1972) but at 700 mb the storm had decreased markedly in intensity.
A pronounced low pressure center was not found at the surface where the central pressure remained at 1011-1012 mb. Further intensifica-tion of this disturbance was inhibited by strong vertical wind shear near the depression and developing anticyclonic flow behind it
(Leary, 1972).
2. Precipitation Pattern
The emergence of the storm from an abnormal northward displace-ment of the ITCZ (see satellite pictures for 25 July, Figure 3) was
initially observed on the radar as a large band of precipitation to the south (see 25th/0705L of representative PPI's, Figure 25). The orientation of this band, ENE-WSW, was aligned with the basic north-easterly flow at low levels (Figure 26). The dimensions averaged 200 by 25 miles and the band was made up of 3 to 10 SMSA's and numer-ous showers. Although the SMSA's and showers were not connected, this line of activity persisted for up to 9 hours with a slow trans-lation northward. This band is another illustration of a LMSA. Individual showers and SMSA's moved WSW during the early history of the band but gradually their direction backed to WNW. This shifting of the direction of echo motions within a short time is attributed
to the tight gradient of horizontal wind shear associated with the close proximity of the closed vortex circulation.
The banding of radar echoes was noticeable throughout much of this disturbance (Figure 25, 26th/OOOOL). Precipitation areas resembling squall lines formed frequently with dimensions as great
as 150 by 20 miles and durations exceeding 4i hours.
Early on the 26th, the radar echoes became organized in a spiral pattern similar to those found in fully developed tropical
storms (Figure 25, 26th/0519L). A tracking of individual shower motions at approximately 26th/0800L (Figure 27) revealed a definite
vortical circulation. The 950-mb flow at this same hour (Figure 28) is in excellent agreement with the observed shower motions.
The precipitation pattern of this disturbance was notable in several respects. At the time the vortex center was close to the radar, the spiral appearance of the radar echoes over a relatively small area of the scope was striking (Figure 25, 26 July-0519L). Secondly, the precipitation was not as widespread as in the disturb-ances of 14-15 July and 16-18 July. Predominant clear areas either surrounded the main area of activity or these clear areas were inter-spersed between groups of echoes.
Enlargements of the ESSA 9 satellite photographs for the 25th and 26th are presented in Figures 29 and 30 together with the corres-ponding PPI traces of the radar echo patterns at these times. In
Figure 29, the band of echoes, described earlier as a LMSA, clearly agrees with position of the satellite-viewed cloud band. The actual orientation and shape of individual cloud elements and radar echoes are very similar in places. The crude estimate of the ratio of echo area to cloud area was less than 1/3. The intensification of this storm led to the development of a circular cirrus-cloud shield
(Fig-ure 30), at this time. The actual area of rain areas was small in comparison with the cloudiness and this ratio was estimated to be less than 1/5.
Correlation of shower motions with the observed wind was complicated by the directional shear of the wind in the horizontal. This shear within a short distance was often enough to make a wind sounding at Barbados useless in tracking a shower a small distance away from the island.
Echo heights processed by Hudlow for two times of polaroid height sequences on the 25th and 26th are summarized in Table 8. These echo height counts were derived from that portion of the PPI display contained between 0 and 125 and from 25 to 200 miles range.
The increase in numbers from daytime (1600L) on the 25th to night-time (0200L) on the 26 may be partly a diurnal effect but more likely is due to the nearing of the vortex center.
An attempt was made to investigate the spatial relationship between convergence and vorticity, and radar precipitation areas for three times during this disturbance. Anawalt (1971) looked at the kinematical structure of the troposphere using BOMEX fourth phase data and evaluated vorticity and divergence by the Bellamy triangle method. He found that there was a significant increase in cyclonic vorticity and convergence during disturbed conditions which is in support of the CISK hypothesis. Anawalt also noticed that there was an encouraging comparison of satellite-observed regions of maximum
cloudiness and the regions of convergence and positive vorticity. Similarly one would expect some spatial correlation between such regions and the contemporary distributions of precipitation areas. Figures 31-33 depict his analyzed fields of divergence between 1000 and.900 mb for 25th/0800L, 25th/2000L, and 26th/0800L. Each figure includes the corresponding PPI trace. The comparisons indicate that that precipitation areas tend to occur in regions of convergence but not necessarily near localized areas of maximum convergence as in Figure 33. It is interesting to note that the pattern of precipita-tion in Figures 31 and 32 is in bands which are oriented along the belts of convergence in an east-west direction. A similar
compari-son of the distribution of precipitation to the divergence field between 900 and 800 mb did not show as good a relationship. Leary (1972) stated that the convergence decreases vertically on both days at all distances from the vortex center. This is an indication that the most important convergence occurred at low levels, particularly in the boundary layer. The field of vorticity did not correlate as well with the area of precipitation at any of the three times of
observations.
F. Discussion of Results
Essentially two types were observed among the four synoptic-scale disturbances. The first two on 14-15 July and 16-18 July were perturbations in the basic easterly flow evident at middle levels of
but they were not important in affecting the precipitation observed by the radar since they developed after the initial wave disturbance passed through the area of radar coverage. The remaining two
dis-turbances were basically characterized by cyclonic circulations at middle and upper-tropospheric levels. Both developed in
associa-tion with the ITCZ with a northward bending being followed by break-ing away from the ITCZ and movement on a northwestward track. The disturbance of 25-26 July developed a low-level cyclonic vortex which was classified as a warm-core tropical depression. The evolu-tion and structure of this depression appeared to be similar to those of Atlantic tropical cyclones which develop along the ITCZ,
It is interesting to note that each disturbance was associ-ated with anticyclonic flow in the upper troposphere. FPE show this type of flow at 35,000 ft in their analyses. On occasions when a corresponding 35,000-ft cyclone developed as in the 14-15 July dis-turbance, it was located to the north of the anticyclone which was over the region of disturbed weather. Similarly, a tendency for cyclonic flow was observed at 35,000 ft over the region at times of undisturbed weather. Malkus and Riehl (1964), in their study of cloud structure over the tropical Pacific Ocean, noticed that the upper-level flow patterns were crucial in governing what was
ob-served at low levels. They hypothesized that the sky type could always be explained in terms of the vorticity tendency of the air at high levels (250-150 mb). If the vorticity tendency was positive
(cyclonic vorticity increasing), upper convergence prevailed, pro-ducing subsidence in mid-troposphere and suppressing cloud-bearing disturbances below; whereas if the upper flow was becoming anticy-clonic, outflow aloft was compensated for by convergence below favoring vigorous cloud growth and intensification of surface dis-turbances.
Precipitation patterns differed markedly between the two types of disturbances. The wave disturbances were composed of showdry-type precipitation which was widespread but scattered. The 16-18 July
system appeared more intense and developed than the 14-15 July dis-turbance. This can likely be attributed to the weakening wave of 14-15 July while it was affecting the radar area in contrast to the 16-18 July disturbance which was accompanied by an intensifying wave during its latter stage. The other two disturbances had more con-centrated areas of precipitation, and individual precipitation areas reached larger horizontal extent. There also existed more organiza-tion in the distribuorganiza-tion of precipitaorganiza-tion in these two disturbances, especially in the spiral structure of the tropical depression.