Creating a Flexible, Web-Enabled Learning and Research Facility
at the M.I.T. Towing Tank
by
Matthew L. Unger
B.S. Naval Architecture and Marine Engineering Webb Institute, 2004
Submitted to the Department of Mechanical Engineering in Partial Fulfillment of the Requirements for the Degrees of Master of Science in Naval Architecture and Marine Engineering
and
Masters of Science in Ocean Systems Management at the
Massachusetts Institute of Technology June 2006 MASSACHUSETTS INSTITUTE OF TECHNOLOGY
JUL 1
4
2006
LIBRARIES
BARKER
D 2006 Massachusetts Institute of Technology, all rights reservedSignature of A uthor...
Department of Mechanical Engineering, Center for Ocean Engineering
A *%- A May 18, 2006
C ertified b y ... ...
Michael Triantafyllou Director of the Center for Ocean Engineering, Professor of Ocean Engineering Thesis Supervisor Certified by ... ... C ertified by ... Professor of ... Franz Hover Principal Research Engineer Thesis Supervisor
...
Henry Marcus Ocean Systems Management Thesis Supervisor A ccepted by ... ...
Lallit Anand Chair, Department Committee of Graduate Students
Creating a Flexible, Web-Enabled Learning and Research Facility
at the M.I.T. Towing Tank
by
Matthew L. Unger
Submitted to the Department of Mechanical Engineering in Partial Fulfillment of the Requirements for the Degrees of Master of Science in Naval Architecture and Marine Engineering
and Masters of Science in Ocean Systems Management ABSTRACT
The M.I.T. Towing Tank has served as an invaluable research and educational platform for over 50 years. The hands-on learning experiences of towing tank tests have helped countless students to grasp the concepts and theories that are taught in the classroom environment. A recent upgrade of the M.I.T. Towing Tank increased the accuracy and capabilities of the facility, but also provided new capabilities to help create an Internet-based, distance learning tool. This new program has enabled M.I.T. to share its towing tank with students from other schools and universities via the Internet. The educational value of this tool was tested via an online set of experiments, performed by a partnered university, and has demonstrated the many benefits derived by this new capability. The upgrades to the facility have also increased the value of the M.I.T. Towing Tank for educational and commercial research. In recent years, the research interests at M.I.T. have significantly diversified, leading to new demands and capabilities being placed on the towing tank. As a result of the upgrades, the towing tank is now a highly flexible platform, on which a variety of research may be performed.
ACKNOWLDEGMENTS
By any given standard, my thesis is slightly out of the normal scope for an M.I.T.
graduate student. Its uniqueness has made it an exciting and very rewarding project, and
I must thank Prof. Michael Triantafyllou and Dr. Franz Hover, my advisors, for allowing
me to pursue it. My thanks also go to Prof. Hank Marcus, my advisor for the Ocean Systems Management degree, for his flexibility in allowing me to write a joint thesis. (Not to mention Hank going beyond the call of duty by helping me the week prior to the due date, from his hospital bed during his recovery!)
Throughout the process of completing this thesis, I have called on a great number of people for their expertise and help. I could not have done it without any of them. They include: Professor Neil Gallagher of Webb Institute for his guidance throughout the motor replacement and tuning phases. Dr. Rich Kimball and Kelli Hendrickson for their quick work on the iMarine system and arranging a last minute lab. Tadd Truscott, without whose help with LabVIEW, I might still be working today. Keith Michel for his help in supplying a cost estimate for commercial tank testing. Julie Arsenault and Ashley Cantieny, my two UROPs, for the quick work in designing and fabricating the new carriage.
Last, but certainly not least, thank you to my family. My father's guidance on all things electrical was an invaluable help to me. But just as importantly, without my mother, father, and sister's love, support, and encouragement, I would never have made it.
TABLE OF CONTENTS
IN TRO D U CTIO N ... 5
BA CK G RO UN D ... 6
Tow ing Tanks ... 6
M .I.T. Tow ing Tank ... 8
M odel Testing Theory ... I1 U PG RAD ES A N D M O D IFICATION S ... 22
Carriage D rive and Control... 22
D ata A cquisition System ... 29
Softw are Program s... 30
N ew H igh-Speed Carriage ... 33
Results of U pgrades ... 35
iMARINE INTERNET-BASED LEARNING TOOL... 38
Educational V alue... 39
iM arine Features ... 40
A n Extended Exam ple ... 42
iM arine Experience Feedback ... 45
COM M ERCIA L A PPLICATIO N S... 49
M odel Testing ... 49
A D ifferentiated Service ... 52
CON CLU SIO N ... 53
LIST O F REFEREN CES... 54
AD D ITIO N A L W O RK S CON SU LTED ... 55
APPENDIX A: MIT TOWING TANK USER MANUAL ... 56
INTRODUCTION
The M.I.T. Towing Tank is a relatively small facility that is predominantly used for educational and research based applications. The educational value of a towing tank can be considered quite significant, and for this reason, having a facility at M.I.T. is to the benefit of the students. Constructed in the 1950's, the facility has been put to use by many generations of M.I.T. naval architects, marine engineers, and ocean engineers. It has also undergone several upgrades of its equipment, to keep it a modem facility. As part of this thesis, a round of upgrades was completed to modernize the facility with a new carriage drive and control system, new data acquisition hardware and software, and a new light-weight carriage.
These upgrades have allowed for the educational value of the towing tank to be enhanced
by enabling the M.I.T. Towing Tank to be connected to the Internet. This connection
allows for students from other universities and high schools to have remote access to the M.I.T. Towing Tank. Combined with live web-cams, the students are able to run
experiments in the facility from their classroom, watch the tests as they occur, and immediately receive the test data back via the Internet. This system has several potential benefits as an educational tool and as a means to continually emphasize the importance of ocean engineering-related education.
This thesis first discusses the history and importance of towing tank testing and model ship tests, in particular. It then highlights the upgrades that were completed to the facility, and elaborates on the Internet-based learning tools that have been created. The uses of the towing tank from and educational, research, and commercial standpoint are also discussed.
BACKGROUND
Towing Tanks
Modem towing tanks are used as platforms to perform a variety of experimental hydrodynamic research; however, the origins of the towing tank are rooted to the very specific purpose of predicting ship resistance via model testing. It was through this work with ship models, that modem day scaling techniques were developed, and which have allowed the towing tank to be used in a variety of scaled research experiments.
The concept of utilizing scaled ship models is not a new idea, but rather one that spans a timeline from the 15th century to the present. Some of the greatest scientific minds have hypothesized or contributed to this area of research, including da Vinci, Newton, Euler, Bernoulli, Franklin, and d'Alembert. These first model tests were performed in variety of settings ranging from small natural ponds, to swimming pools, to rain ditches, to ship dry docks. Additionally several very small tanks were constructed with the dedicated
purpose of model testing. These tanks were typically on the order of 30 feet in length. In most cases, the models were propelled with a tow line rigged to a falling weight (Phillips-Brit 1970).
These early model tests revealed that there was no simple scaling procedure to convert model-scale resistance to full-scale ship resistance. As a result, most experimental model testing primarily yielded qualitative rather than quantitative results. A particular hull
shape could be deemed faster (or to have better resistance characteristics) than another hull shape. For example, it is believed that the famous clipper ship bow was, in part, developed by small model tests performed by the shipbuilding firm Alexander Hall & Company of Aberdeen, Scotland in 1830. In a glass-sided tank only 10 feet in length, William Hall experimented with numerous ship models by dragging them through the tank filled with water and "a top layer 1 inches thick of transparent red-colored spirits of turpentine." As illustrated in Figure 1, Hall was able to visualize the flow patterns
around the models; thus, qualitatively judging that the Clipper-type bow produced a smooth and favorable flow (Todd 1951).
Figure 1. Towing Tank of Alexander Hall & Company (Todd 1951).
In the mid-1800's, with the advent of the steam engine, there grew a sense of urgency toward finding an accurate means of predicting ship resistance. In a paper discussing the history of towing tanks, the legendary yacht designer Olin Stephens states "the fact that the power of a steam engine could be measured while sail could not, made it useful to learn how much drag had to be overcome for a ship to reach a given speed" (Stephens
2006). Fortunately for the field of naval architecture, the scientist William Froude was
hired in the 1860's to assist in the creation of a fleet of steamships for transatlantic trade. Froude was introduced to the resistance prediction problem that was plaguing the
shipbuilding industry. He started towing ship models in a rain-catching ditch with a gravity tow line, but was unhappy with the sag in his tow line and switched to towing models with a small powered launch. In 1869, as a result of his tests, Froude made the breakthrough discovery which brought model testing into the next generation. Froude called his discovery the "Law of Comparison" and it described how to accurately scale ship model resistance to full-scale ship resistance (Froude 3). To this day, many still consider Froude to be the father of modem day ship model testing.
From 1869 forward, the towing tank took on a new meaning, as ship model tests could now produce quantitative resistance predictions. In 1870, Froude oversaw the
construction and operation of the British Admiralty's experimental tow tank. The facility's tank was 278 feet in length and featured the world's first traveling carriage facility, which is now considered the modem-day standard (Lewis 1988). A traveling carriage allows for models to be attached to a rigid carriage, riding on rails along the
towing tank's length. The carriages are propelled via machinery, allowing accurate towing runs to be made. The traveling carriage eliminated the sagging towline that Froude disliked.
Since the days of Froude's first modem towing tank in 1870, many more facilities have been created. Today, towing tanks range in size from small, 100 foot facilities, to huge tanks nearly one-mile in length and whose carriage rails conform to the curvature of the earth. Similarly, model lengths vary from just a few feet to well over 30 feet. Modem machinery and sensing equipment have only furthered the usefulness and accuracy to ship model tests, and have allowed for the testing of a wide variety of hydrodynamic problems and applications.
M.I.T. Towing Tank
The Massachusetts Institute of Technology has a long and rich history pertaining to the study of naval architecture and ocean engineering. This history dates back to 1893 with the formation of M.I.T.'s Department of Naval Architecture and Marine Engineering. Starting in the early 1920's, plans were begun to build a towing tank research facility in the new Pratt Building, which was constructed to house the department. However, time after time these plans met the unfortunate fate of insufficient funding (Page 2001). Interestingly, architectural drawings of the never-built towing tank design for the Pratt Building may be found in the M.I.T. Hart Nautical Gallery archives. Finally, in the
mid-1940's, with the upcoming 1949 Development Fund Campaign, the department gained approval for the creation of a "modestly sized" towing tank facility. In June 1951, the M.I.T. Ship Model Towing Tank was officially dedicated. Figure 2 is an early picture of the facility taken after construction was complete.
Figure 2. An early picture of the M.I.T. Towing Tank (Abkowitz 1953).
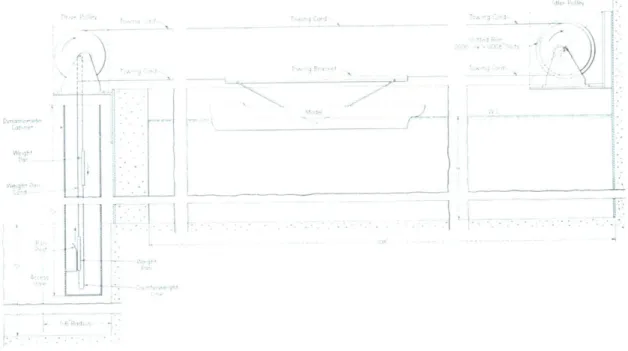
The tank was constructed to the following dimensions: 108 feet (33m) long, 8 feet 7 inches (2.6m) wide, and 4 feet (1.2m) deep for most tests. In its earliest years, the towing tank consisted of little more than the tank, a towing chord strung between a pulley at each tank end, and a "gravity" dynamometer. Through an intricate set of falling weights, an
exact force was applied to the towing chord. The resulting model speed was measured, and thus a resistance curve was developed via a series of tests. The applied force could be measured to within 0.0001 pounds, and the resultant speed to within 0.001 knots. A simple wave-maker was capable of producing regular waves down the tank's length (Abkowitz 1953). A plan-view schematic of the tow tank and gravity dynamometer is pictured in Figure 3.
Figure 3. A schematic of the M.I.T. tow tank and early "gravity" dynamometer (Abkowitz 1953).
As time progressed, further additions and improvements to the facility have taken place. The most notable improvement was the addition of a traveling carriage in 1961 (Baker
1969). To support the carriage, two tubular rails running the full length of the tank were
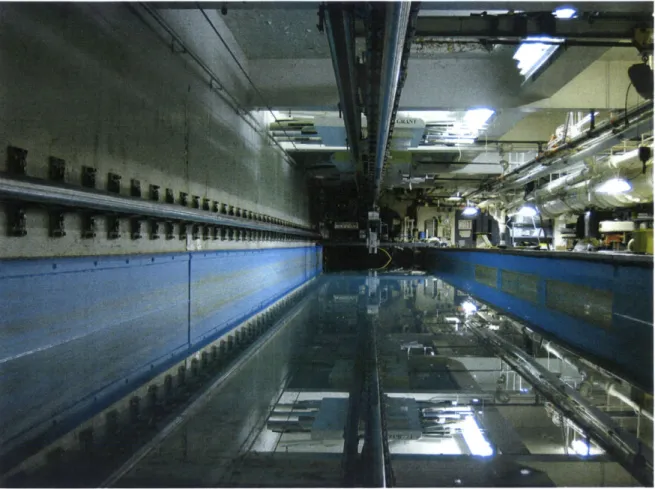
installed. An overhead rail was mounted approximately 39 inches (1m) above the water surface and along the centerline of the tank, while a second rail runs along one side of the tank, approximately 16 inches (0.4m) above the water. Figure 4 is a picture taken
looking down the length of the M.I.T. tow tank, featuring the overhead and side rails.
The towing tank has had numerous upgrades throughout the years, each of which has brought it up to the current technology of the time. Researching the various
configurations of the facility has proven to be difficult, as most upgrades and improvements were not well documented. As a result, much of the information
uncovered was from informal interviews and chance conversations with M.I.T. alumnus of the past 50 years. Among these upgrades were several generations of motors and gearing for carriage control, and the conversion to a hydraulically actuated the wave-maker paddle.
Figure 4: A view down the length of the M.I.T. Towing Tank.
One of the more interesting motor/drive configurations from the 1970's incorporated three 5-speed manual automotive transmissions coupled together and to an AC motor. While the motor would only turn at one speed, by shifting each of the three gearboxes to different gears gave the operators 125 discrete speeds at which to test.
Model Testing Theory
Prior to William Froude, there was no known scaling technique to equate ship model to full-scale ship resistance. Beginning in 1868, Froude began testing various scale models of the same ship and noted that the wave patterns produced by each model were nearly identical, but their speeds did not match. He realized that some form of speed scaling existed. Froude was able to identify that ship resistance needed to be separated into two
basic components frictional and residuary, and did so using the general law of mechanical similitude.
The residuary resistance is simply the residual that remains once frictional resistance is accounted for. In general, residuary resistance is nearly entirely composed of the wave-making resistance; however other items such as eddy-wave-making, wave-breaking, and wind resistance are often lumped together, as well. More simply stated, Froude had found that wave making and frictional resistance scaled differently.
The next few pages explain how dimensional analysis can be applied to the problem of ship resistance. This method is featured in many naval architecture references. Much of the following was taken from Lewis (1988) and Todd (1951).
The total resistance, RT, of a ship will depend upon several physical quantities: * V, speed " L, characteristic length * r, density of fluid * m, viscosity * g, gravity * p, pressure in fluid
Thus, a relationship between these variables can be written as:
RT -pavbLudgePf (1)
Using the procedure of dimensional analysis, coefficients a, b, and c can be solved, yielding the relation:
Note that the three expressions within the brackets are each a non-dimensional quantity. Furthermore, knowing that S, surface area, is proportional to L2 and that m/r can be replaced by n, kinematic viscosity, Equation (2) can be rewritten as:
CT = = f VL L P (3)
2pSV 2
LV'V
2'pV 2The quantity RTI ( rSV2) in Equation (3) is the non-dimensional form of total ship
resistance, which is simply abbreviated as CT. From this relation, dimensional analysis has shown that if the three parameters on the right-hand side of Equation (3) are the same for a ship and a scaled model of the ship, the flow around the hull will be similar and the non-dimensional resistance will be the same for both cases. The next few sections will take a closer look at each of the three non-dimensional terms individually. This will prove that dimensional analysis has allowed total ship resistance to be broken down into frictional and residuary components, and that each component scales according to different non-dimensional parameters.
Residuary resistance
If the assumption is made that a ship is operating in an inviscid flow, then frictional
resistance will not exist and the first parameter, VL/n, of the right-hand side of Equation
(3) can be ignored. For reasons to be explained shortly, the third term in Equation (3)
will also be temporarily ignored. Thus, the only remaining term is gL/V2, which governs the surface wave system and the residuary resistance. Note that term can be rewritten as V / gLJ which is the Froude Number, Fn. This allows a non-dimensional coefficient for residuary resistance, CR, to be defined as:
R
CR = R =f (Fn) (4)
1
Therefore, to obtain dynamic similarity in a model test, Froude scaling must be performed so that the Froude Number at which the ship is operating is the same Fn to which the model will be tested. The ship and model speeds for the same Froude Number are what Froude called "corresponding speeds." Knowing that the ship model is a geometric scaling of a ship, with model scale: 1 = Ls/LM. The relationship between ship and model speeds can be solved as:
Vs/ gL = I gL (5)
VS = -4 XVM (6)
As an example: a 125 meter ship traveling at 10 knots can be represented by a 5 meter model traveling at 2 knots. In the same manner as above, the scaling of residuary resistance (or force) can be found:
Rs YS2
SSV7
RRS MV M L2s _ Losa
RRM 2 M MM L( LM)LM
RRS 3 x RRM (8)
Based on this relation, a residuary resistance of 1 Newton on the model will correspond to 15,625 Newtons on the ship. The fact that dynamic (Froude) scaling results in small model forces and low model speeds is extremely convenient, as this makes model testing feasible. This will not prove to be the case for kinematic scaling.
Froude's realization that the wave patterns (and thus wave resistance) scale differently from viscous forces was the key to unlocking the potential of scaled model testing.
Elimination of one dimensional analysis parameter
With dynamic similitude (and residuary resistance) identified, the third parameter of Equation (3), p/rV2, can be re-examined. Assuming that atmospheric pressure exists above the water in both ship and model tests, then the pressure p is only the static "water head" acting on a specific location on the hull (i.e. p = rgh, where h is the draft). The value of p at a corresponding point on the ship and model will be different (because h will differ). However, h is linearly scaled by 1. Additionally, V2 is scaled by 1, so the parameter p/rV2 reduces to a constant. For now, it will be assumed that p only depends on draft, and this term can be neglected. Later on, this simplification will be
re-examined.
Frictional resistance
With an understanding of what governs the scaling of wave-making resistance, Froude turned his attention to solving the frictional resistance problem. He started by examining the remaining parameter in Equation (3), VL/n. If the assumption is made that the ship is actually a submarine, and is operating in very deep water, there will be no waves created on the water's surface. Thus, only frictional resistance will be exerted on the submarine and only the parameter, VL/n, or Reynolds number (Rn) exists. This parameter is named after Osborne Reynolds, whose work first discussed water flowing in pipes, and which was then extended to include other types of flow.
Using the Reynolds Number, the non-dimensional coefficient of frictional resistance, CF,
can thus be written as:
C = RF =f(Rn) (9)
If Rn is the same for the ship and the model, then kinematic similitude is established. However, for the same 5 meter model to match the Rn of a 125 meter ship moving at 10
knots, the model will have to travel at 250 knots! This is highly impractical.
For researchers to obtain both kinematic and dynamic similitude simultaneously, the model could be tested at the slower speed corresponding to Froude (or dynamic) scaling, but the fluid the model was operating in would need a kinematic viscosity 1/125 that of
water. Unfortunately, scientists know of no stable substance to use.
Thankfully, researchers have found empirical formulas (utilizing Reynolds number) to accurately predict frictional resistance. The first frictional predictions were performed by Froude in the early 1870's, when he measured the frictional resistance on flat plates
(Baker 1948). Since that time, further research has resulted in a fairly accurate estimation of frictional resistance. One of the more commonly accepted formulas is the 1957
International Towing Tank Conference (ITTC) method that states:
CF = 0.075
(log, Rn - 2)
It is assumed that the flow around a ship's hull is dominated by turbulent flow, so Equation (10) only works for turbulent flows. Practically speaking, commercial ships usually operate at Rn ~ 109. Because of this, the flow changes from laminar to turbulent
very close to the bow of the ship. (As a note of interest: the flow at the stem of a ship typically has a turbulent boundary layer of approximately 1 meter in thickness.) To properly simulate this on the model, the flow should also be turbulent. Since most models are run at Rn ~ 107, which is rather close to the regime of transitional flow, turbulence stimulators are used on the models. A common assumption is that flow naturally transitions from laminar to turbulent at Rn~ 0.5 106, so the stimulators are
mounted at a position aft of the bow that corresponds with this critical Reynolds number (Bertram 2000). Common turbulent simulators include small studs, sand strips, and trip wires.
Since larger scale models operate at higher Rn than smaller models (and are thus further away from the transitional regime), they are usually considered to produce results with a higher degree of accuracy. In the mid-20th century one thought was to heat the water of the testing tank. This would result in lower kinematic viscosity values, and thus higher Rn flows. In most cases this proved to be impractical (or extremely expensive for very little gain in accuracy).
Since frictional resistance represents up to 80% of the total resistance of slow commercial ships and approximately 50% of high speed vessels, finding methods to calculate
frictional resistance was just as important as solving the residuary component of resistance (Todd 1951).
Other components of resistance
Froude's early work in separating ship resistance into two primary components was the key to unlocking the mystery of scaling model ship tests. However, since Froude's time, scientists and engineers have been able to further classify ship resistance into numerous other parts. Figure 5, below, is one depiction of how ship resistance can be decomposed.
Tontal res1,stanm' R,
jResi lia resista Rk on reststar RC
Form effect on skin fri tion
Wave resistance R , Viscous pressiuro resistance R,-,
Wavernaking i Wavebreaking Vng s u sistanCO Re resistance R resistance R,,
Total resistance ( r
Perhaps the easiest method of decomposition is to realize that residuary resistance is simply all other "residual" forms of resistance other than frictional. Those components include, but are not limited to: wave-making, wave-breaking, eddy-making, air, and viscous form drag. The dominant component is wave-making resistance, which in most cases accounts for nearly all residuary resistance.
Wave-breaking, eddy-making, and spray drag are other forms of resistance that are grouped into the residuary category. All of these types have proven to be extremely difficult to measure, and even more difficult to scale (their rather small contribution to residuary resistance adds additional challenges). Both wave-breaking and spray-making resistance will, at least in part, rely on surface tension in their calculation. The full scale ship will also encounter air resistance; however, it will nearly always be several orders of magnitude smaller than hydrodynamic resistance.
Finally, viscous form resistance (also called viscous pressure resistance) has proven to be a very difficult component for several reasons. Viscous form drag is best described by Bertram (2000) who explained that a deeply submerged ship (or submarine) will have no wave-making resistance, but its total resistance will be more than frictional resistance. This extra resistance is the viscous form drag. Another approach explains it as the pressure resulting from a viscous fluid flowing around the ship's hull. The form of the ship thus affects the characteristics of the flow and how the viscous shearing will occur.
Looking back to the dimensional analysis of total ship resistance, one can now see that the elimination of the non-dimensional term p/rV2 is most likely not correct, as p is somehow affected by viscous flow. Furthermore, if flow separation occurs, local pressures will differ from hydrostatic pressure, and introduce scaling differences.
However, since there is no definite way to precisely calculate viscous pressure, and since wave-making resistance is much larger than viscous pressure resistance, the term is still neglected. Thus, while not complete, there is some explanation on the inaccuracies of
larger models. This, again, is caused by the lack of scaling knowledge of viscous form drag.
Limitations of small models
The M.I.T. Towing Tank is, by all modem day standards, a small towing tank. Several decades ago, small tanks fell out of favor in the industry. Naval architects argued that there were too many uncertainties surrounding scaling effects and repeatability, and that any results from small towing tanks were not to be trusted. The truth is that small towing tanks have certain limitations, and thus, cannot be used for all types of testing. Often times the small size of the models result in flows with Reynolds numbers within the range where laminar flow is transitioning to turbulent flow. As mentioned in the previous section, ship models need to be tested while undergoing fully turbulent flow, which makes turbulence stimulators a necessity. This has proven to be fairly successful, allowing for the accurate testing of small models for resistance properties. Methods of turbulence stimulation have been studied for the past 50 years and include studs, sand strips, trip wires, and Hama strips (Hughes 1951 & Hama 1956).
The key to obtaining accurate and useful results from small tow tanks is, as with all other experiments, realizing the limitations of the facility. With regard to ship model testing, small towing tanks are simply not the correct facility to solve all hydrodynamic-related problems. Many papers have been written about small towing tank uses and limitations, including Fireman (1982) and Fisher (1982). The findings demonstrate that small tanks do provide a means of accurately comparing designs for bare hull resistance and added resistance in head seas. They do not work well in self propulsion tests or seakeeping experiments (at wave angles other than 0 or 180 degrees). Additionally, sailboat or other tests with appendages have proven to be uncertain because of the small operational Reynolds number of the scaled appendages.
Another limitation of small models is that they have small boundary layers, as compared to the full scale ships. Since the boundary layer changes the flow of water around the
hull, any scaling inaccuracies in the model tests will result in differing flows. This effect also brings back the problem of viscous form drag, which changes with boundary layer shape. If viscous form drag scales differently, something scientists do not definitively know, then the accuracy of small model tests may be experiencing slightly reduced accuracy.
Another point that is made by Kirkman (1979) in addressing small model testing of yachts is that the proportion of the resistance coefficients of the frictional and residual components is not the same for small models, large models, and full scale ships. This is best demonstrated in Figure 6, where the residuary and frictional resistance coefficient values are indicated for both a small model and ship. As Kirkman states, for the model, the residuary resistance represents a smaller portion of the total resistance, while at full scale, the residuary resistance is the largest contributor to the ship's overall resistance.
0 TM
I-z
U. RESIDUARY LUo
CALCULATED CT 0T W FRICTIONAL S 0 RESISTANCE MEASUREMENT FRICTIONAL RESIDUARY FRICTIONAL REYNOLDS NUMBERDespite these limitations, small model tanks still hold an important and useful place in research and education, and these benefits will be discussed in the remainder of this text.
UPGRADES AND MODIFICATIONS
The upgrades performed to the M.I.T. Towing Tank are part of the continual process of keeping the laboratory equipped with current technology. Modifications have been made to the carriage drive and control systems and to the data acquisition hardware and
software. The goal of the upgrade process was to provide a system that is user friendly and offers accurate and higher carriage speeds than the previous system. Additionally, the new equipment allowed for the development of a web-based control system, which will be discussed in a later section.
Today, the research interests at M.I.T. have diversified and the M.I.T. Towing Tank serves as a research platform for many types of experiments, other than ship model testing. These tests include: the simulation of fish swimming (RoboTuna), ROV design tests, and the study of vortex induced vibration (VIV) on cylinders. Presently, additional tests are planned for flapping foil and pressure sensor testing. In short, there seems to be no limit to the diversity of applications that can be tested at M.I.T.'s towing tank. As a result, one requirement for the upgrades was that they provide a highly flexible system to allow for a variety of carriage control and motion profiles.
The upgrades consist of a new carriage drive and control system, upgraded
data-acquisition hardware, and a new set of software programs to seamlessly join all functions at one desktop computing station. Additionally, a lightweight carriage for small testing loads (such as ship model tests) has been designed and constructed.
Carriage Drive and Control
The towing tank carriage is driven down the length of the tank by a simple drive system that has worked well for over 50 years. To produce carriage motion, an electric motor turns a drive pulley mounted at one end of the tank. As this pulley rotates, it drives a thin metal belt that is looped between the drive pulley and an idler pulley located at the opposite end of the tank. A tensioning device is attached to the idler pulley and allows
sufficient tensioning of the drive belt, which eliminates belt slippage. The carriage is connected to the drive belt, thus as the motor and drive pulley turn, the belt and carriage undergo linear motion. Figure 7 is a basic schematic of this system, with the large arrows indicating the turning motion of the pulley and the linear motion of the carriage.
MOTOR
IDLER PULLEY
DRIVE BELT
RAIL
CARRIAGE
DRIVE PULLEY
4---Figure 7. Schematic of the carriage drive system (large arrows indicate direction of motion).
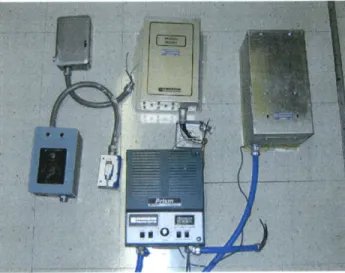
Under the previous configuration, the drive motor was a 3-phase, commercial grade, AC motor coupled to a reduction gearbox. The motor was powered by an Emerson brand, adjustable frequency AC drive, which was controlled by a Fenner brand motion
controller. This system combined the devices with an RPM sensor to create an open-loop feedback control. The user had two methods of interfacing and controlling the carriage. One method was to enter the desired carriage speed on a touch pad, and command motion via control buttons. The second method involved a DOS-based computer program. Figure 8 and Figure 9 depict the previous user interface and drive components, respectively.
While this system provided many years of reliable service, it was beginning to grow outdated. The integrated limit switch control board began causing problems, requiring the user to manually press a "stop" button to stop carriage motion. Additionally, the DOS-based program continually encountered errors because of the failed communication with the limit switches. Over the years of operation, the carriage gradually increased in
size and weight. As a result, the motor and corresponding controls began to meet their limitations. In comparison to modem day motor control methods, the open-loop feedback control was not providing the most accurate form of speed control.
Figure 8. Previous carriage controls. Figure 9. Prior carriage motor drive components.
Thus, these upgrades can be considered an investment in the facility. This investment was made only after conducting a careful analysis of several different upgrade options.
The primary goal of the upgrade was to bring the facility up to a modem state, where testing could be conducted more efficiently and with greater accuracy; thus expanding the potential of the towing tank for educational, research, and commercial applications. Several different carriage motor and drive systems were investigated and priced. The four most promising options were:
* Option 1: A complete servomotor system by Parker Hannifin.
* Option 2: A Vector Drive variable speed AC motor system by Baldor. * Option 3: A servomotor system by Mitsubishi.
" Option 4: Reuse the existing motor and install a new drive/controller.
To assist in the final selection, a wish list of features for the upgraded system was developed and used to evaluate each of the motor options. The criteria consisted of various aspects desired in a new system. This included:
" the motor's accuracy
* the ability to program a variety of motion profiles
* enough power to accelerate heavy loads and achieve relatively high speeds * a proven track record in similar applications
" ease of programming the controller and interface
" the ability to control carriage position, in addition to velocity
* the availability of the manufacturer's technical support * the capability to track the carriage's position and velocity.
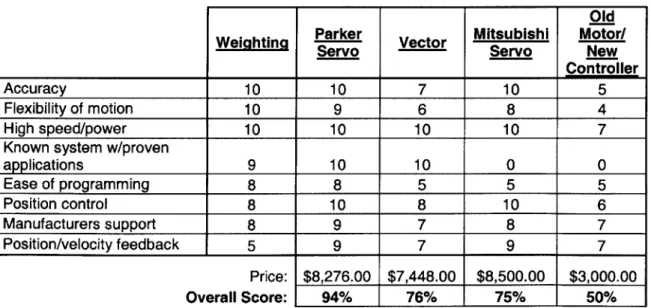
Prior to ranking each motor option, the criteria was first evaluated to determine which categories were most important to the upgrade. This was done by weighting each criterion on a scale of 1 to 10. Next, each motor option was ranked for its fit to each category. The final percentage score for each option was found by incorporating the weighting with each criterion and summing for each option. The results of the evaluation are outlined in Table 1 below.
Table 1. Merit-based analysis of motor/drive upgrade options.
Old
Weighting Parker Vector Mitsubishi Motor/
Servo Servo New
Controller
Accuracy 10 10 7 10 5
Flexibility of motion 10 9 6 8 4
High speed/power 10 10 10 10 7
Known system w/proven
applications 9 10 10 0 0 Ease of programming 8 8 5 5 5 Position control 8 10 8 10 6 Manufacturers support 8 9 7 8 7 Position/velocity feedback 5 9 7 9 7 Price: Overall Score: $8,276.00 $7,448.00 $8,500.00 $3,000.00 94% 76% 75% 50%
This analysis highlighted many of the strengths and weaknesses of each option. While the Mitsubishi servomotor would result in a similar amount of accuracy to the Parker system, it was not a fully packaged product and would require third party controllers and
complex programming. This also meant that versatile functionality would be more difficult to accomplish. The Vector AC motor system would achieve slightly less accuracy, and also had more limited capabilities. It would not allow for accurate
positioning control of the carriage. The last option to keep the old motor proved to be the least favorable, as it provided the least amount of accuracy and lacked enough power for the system. Another important criterion was to evaluate if each motor option has a proven track record in similar applications. Both the Parker and Vector systems have been installed in the Webb Institute and U.S. Naval Academy tanks, respectively. Both have provided reliable service and as such, received higher scores for this category than the other options.
In the final analysis, the Parker system proved to be far superior to the other choices. Interestingly, it was comparably priced to the other systems. As such, it appears that the
selected system provides significantly greater value per dollar spent.
The final choice was to purchase a brushless DC servomotor system manufactured by Compumotor, a division of the Parker Hannifin Corporation. This new configuration consists of two parts: the servomotor with reduction gearing and a Gemini drive/control unit (pictured in Figure 10 and Figure 11 respectively). The servomotor provides more than ample power and torque for the carriage; and with a closed loop control
configuration, offers the benefits of precise motion control with fast response capabilities. The drive/control unit powers the motor, but also contains a processor to control all motor functions. A personal computer, connected to the drive/controller either via serial or Ethernet communications, acts as the user interface for the system. Limit switches, emergency stop buttons, and other optional devices all connect to the drive/controller. Utilizing proprietary Compumotor software on the PC, motion profiles can be
programmed and uploaded to the drive/controller's processor. From that point, the computer acts as a simple interface, transmitting commands from the user to the controller. The result is a highly flexible and very capable motion control system.
Figure 10. Compumotor servomotor, gearhead, and shaft coupling.
Figure 11. Gemini servomotor drive/controller (source: Compumotor website).
The Gemini drive/control utilizes several basic motion programs, and adapts them for
specific use. The motion program to be used most often in the M.I.T. Towing Tank is the "S-Curve" profile. All usable test data will come from the steady-state, constant speed portion of the carriage's motion. Therefore, it is highly desirable to accelerate the carriage up to speed as quickly as possible, allowing it to run for the maximum distance at the set speed, and then decelerate to a stop. However, the acceleration and deceleration stages exert large and undue forces and jerk on the model (or test apparatus). Rather than having the carriage accelerate and decelerate at a set value, the drive/control unit is capable of creating smooth starting and stopping motions, thus minimizing jerk on the carriage. This ramp-up and ramp-down speed profile resembles the letter "S", and as such, has acquired its name. This is best demonstrated by a comparison of Figure 12 and Figure 13. Figure 12 shows constant acceleration and deceleration, with its resulting
"trapezoidal" velocity profile, while Figure 13 graphs the "S-Curve" velocity and acceleration profiles.
Trapezoidal S-Curve
0 -2
Time Time
Time Time
o Maximum Jerk o Less Jerk
Figure 12. Trapezoidal (or constant Figure 13. "S-Curve" velocity and
acceleration and decelleration) velocity and acceleration profiles (source: Compumotor). acceleration profiles (source: Compumotor).
The Gemini Drive offers additional flexibility, in addition to "S-Curve" motion. Due to the high accuracy of the 8000 count encoder, built into the servomotor, the carriage can be positioned anywhere along the length of the towing tank to within an accuracy of 14 millimeters. This feature can expand the uses of the towing tank for applications where precise distances are needed. It may also prove useful for testing sonar equipment in the towing tank. Another feature of the Gemini is that it can allow the motor to become a "slave" follower, to mimic a particular motion profile that is fed into the unit. One application where this may prove useful is when testing flapping foils. The lift and drag of the foil can be measured, the forward advance speed calculated, and immediately fed into the motor to advance the carriage accordingly. This new motor and controller configuration offers a degree of flexibility to the facility that opens it to a variety of new testing possibilities.
The installation of the motor required the fabrication of a steel bracket to which the motor could be mounted. The motor was attached, the drive/controller was wired, and motion programs were created. Figure 14 and Figure 15 are pictures of the assembly process and final outcome.
Figure 14. Motor/bracket/pulley Figure 15. Servomotor assembly permanently
configuration prior to final assembly. attached to the drive system.
Data Acquisition System
Depending upon the experiment, sensors are typically mounted to the "test subject" whether it is a model ship, VIV cylinder, or other device. To collect this data, all the sensors are wired to a BNC connector breakout board on the carriage. Wires which follow the carriage connect to a corresponding breakout board in the control station of the towing tank. From here, each individual sensor channel is wired to a third BNC panel that is connected to a PC via a data acquisition (DAQ) card.
A new Dell PC was purchased to act as the interface with the new servomotor system, as
well as serving as the data collection computer. This is a change from the previous system, where one station controlled the carriage motion, while another computer
collected the experimental data. The new system combines all functions at one computer for several reasons, which will be discussed shortly.
The new DAQ system consists of several pieces of hardware, all manufactured by National Instruments. The sensor channels will now be wired to two new BNC boards
(NI BNC-2090 adaptors), pictured in Figure 12, that are connected to a new PC DAQ
card (NI PCI-6259). This new configuration allows for 32 analog-in, 4 analog-out, and 48 digital 1/0 channels. For software, National Instruments LabVIEW software package is utilized to record all data. LabVIEW is also used for several other important functions,
to be explained shortly.
Figure 16. The new BNC DAQ adaptors are rack-mounted above the BNC breakout board that is wired to the carriage.
Software Programs
Since one goal of the upgrade was to simplify operation of the towing tank, it was
decided at the onset of the project that all important functions should be easily controlled from one, central station. To accomplish this, National Instrument's LabVIEW software was used to control all functions. LabVIEW is a very powerful software package used for data acquisition, motion control, signal processing, and a variety of other functions. Unlike most computer languages, LabVIEW is graphically-based, rather than text-based. LabVIEW programs are called "Virtual Instruments" or VIs, and consist of two windows. The first is the "Front Panel" which serves as the user interface screen when running the
VI. The Front Panel consists of the buttons, text inputs, and other items necessary to control the VI, and is customized during programming. The "Block Diagram" window is only used when programming the VI. Specific tasks are represented by graphical icons within the Block Diagram, which are wired together to transfer data from one task to the next. The flexible nature of LabVIEW programming has allowed several VIs to be created for controlling the various tasks necessary in the M.I.T. Towing Tank.
LabVIEW VIs have been created to fully control the carriage. The Front Panel, pictured in Figure 17 below, allows the user to home the carriage, enter the desired test speed, command motion, and reverse the carriage. An emergency stop button allows the user to
immediately stop the carriage motion. This emergency feature is in addition to several other safety stopping features. Complete instructions for carriage operation can be found in Appendix A.
Figure 17. LabVIEW Front Panel for controlling the towing tank carriage.
Data acquisition is very easily accomplished with LabVIEW, and several VIs have been created for this purpose. In most cases, however, experiments conducted at the M.I.T.
Towing Tank require slightly different data acquisition setups. Often the number of data channels, sensor types, and scaling vary. Fortunately, the LabVIEW VIs for data
acquisition are very easily modified to suite the requirements of the experiment. One useful Labview feature allows for the raw data to be scaled according to sensor
calibration tests, prior to testing. This allows for the recorded data to be in experimental units, rather than pure voltage. Detailed instructions for LabVIEW data acquisition are also located in the User Guide in Appendix A.
LabVIEW was also used to create a VI to control the towing tank's wave-maker. The paddle-type wave-maker spans the full width and height of the tank, and is normally in an upright position. It is connected to the bottom of the tank via a hinged connector. A hydraulic cylinder, attached to the top of the paddle, actuates motion and, thus, generates waves in the tank. The hydraulic cylinder is connected to a servo-amplifier, which receives an analog signal from a wave generator. By feeding sinusoidal waves into the servo-amplifier, regular waves of varying frequency and amplitudes are possible. Since the new DAQ system has analog-out functionality, the wave-maker servo-amplifier receives all commands from a new LabVIEW VI, as opposed to last system which used a simple signal generator. This results in increased accuracy and flexibility in the wave-making capabilities of the tank. It also allows for the operation of the wave-maker from the same single computer control station.
LabVIEW has allowed for the control of the carriage, data acquisition, and wave-maker to be seamlessly integrated at a single user station, as pictured in Figure 18. This has significantly increased the capability and ease of use of the towing tank.
Figure 18. New tow tank control station.
New High-Speed Carriage
The towing carriage has proven to be an excellent and quite versatile platform from which to perform tests. However, as previously mentioned, it is quite heavy and large. A photograph of the carriage during resistance testing of a 3-foot barge model can be seen in Figure 19. In comparison to the model, the carriage is extremely large. To attain higher test speeds, a lighter carriage is necessary. As a result, a new lighter-weight carriage was designed and built.
Figure 19. Primary carriage with 3' barge model mouted (at right).
This new carriage, pictured in Figure 20 and Figure 21, is constructed of 80-20, a
modular aluminum alloy building material. This carriage has been primarily designed for testing model ships, but because of the versatility and modularity offered by the 80-20 building material, the carriage can serve for any type of experiment with relatively small loads and which requires higher speeds. Due to the two rail system, the new carriage has a shelf, with surrounding cage-style railings, to hold amplifiers and signal conditioners. The new carriage has proven to be extremely sturdy, and should provide a research platform for all model testing and any research that requires light loads and forces.
Figure 20. Front-quarter view of the light- Figure 21. Rear-quarter view of light-weight
weight carriage and Series 60 model. carriage and Series 60 model.
Results of Upgrades
The new motor and drive system have substantially increased the accuracy, speed, and acceleration of the previous system. The goal at the onset of this project was to improve the acceleration capabilities of the carriage to enable long steady state runs at speeds of at least 1.5 meters per second (or 4.9 feet per second). At the present time, the original carriage has achieved speeds of 1.6 m/s, with what appears to be ample power to achieve greater speeds.
The creation of a lighter weight carriage enables researchers to perform tests at even higher speeds. Since the primary carriage weighs approximately 600 pounds, accelerating and decelerating it will require large amounts of torque. By creating a lighter carriage (on the order of 50 pounds), the loads and torques on the motor are significantly reduced. Table 2 outlines the speeds and accelerations that are obtainable with the combinations of the new motor with the existing heavy and new light-weight carriages.
Table 2. Target maximum velocities and accelerations of the new drive and control system.
Carriage Maximum Maximum
Configuration Velocity Acceleration
Primary 1.6 m/s 1.0 mIs2
Carriage (5.2 ft/s) (3.3 ft/s2)
Light-Weight 2.5 m/s 1.5 m/s2
Carriage (8.2 ft/s) (4.9 ft/s2)
In resistance tests of a Navy ship model prior to the motor upgrades, runs were performed up to 1.5 m/s. However, the highest speeds proved difficult to obtain, as the carriage took most of the towing tank's length to accelerate to speed. The chart in Figure 22 plots resistance versus time, but the resistance data can also be used to imply the carriage velocity (increasing resistance correlates to the carriage accelerating). This figure shows an initial spike where the carriage began motion, followed by a very long period where the speed was increasing. It is not until the very end of the run, where a "plateau" was possibly reached (the data is slightly doubtful), before the carriage was stopped from reaching the far end of the tank.
Following the installation of the new motor and control systems, the same model was run at 1.5 m/s. Figure 23 is a plot of the results. A comparison shows that the new motor and controller have provided greater acceleration of the carriage, resulting in a long "plateau" or region of steady state, where a resistance measurement can be taken. Note that in both cases there was "noise" within the resistance measurements. This is a normal part of towing tank data, which is accounted for by taking the average reading across time. Furthermore, there is less noise in the older data because it was run through a post-processing filter to reduce noise, while the newer data was not.
S U
IA
a,
Time
Figure 22. Resistance plot for a Navy Destroyer model, prior to the motor upgrade.
C
kn
Time
Figure 23. Resistance plot for the same model as Figure 22 after new motor upgrade was completed.
~jj)
4)
iMARINE INTERNET-BASED LEARNING TOOL
The educational value of towing tanks has been well known for many decades. In fact, it was a driving reason for the creation of the M.I.T. Towing Tank in the 1950's. With the new upgrades and the merger of all controls with LabVIEW, the potential emerged to allow M.I.T. to share the educational value of the towing tank with other schools. This is accomplished via the use of the Internet, and allows for web-based, distance learning experiments to take place. In creating this new system, the towing tank joined the iMarine project which was already underway at M.I.T..
The iMarine project is a web-based learning application designed to create online tools and educational resources for teaching naval architecture and naval engineering. It has been funded by the Office of Naval Research (ONR) under the National Naval
Responsibility for Naval Engineering (NNRNE) project. One part of the iMarine endeavor is to create online access to laboratories and experiments that might not otherwise be accessible to students. These laboratories have been termed "iLabs". A goal was set to incorporate the M.I.T. Towing Tank as an iLab, to allow students from other universities (and perhaps high schools) to perform simple ship resistance tests via the Internet.
The power and capabilities of the LabVIEW software have enabled this integration of the towing tank into the iMarine system. Programming was developed to allow for a
controlled interface between students and the towing tank. Through the remote
connection, students can input testing parameters, are able to watch the tests live via web-cameras, and are instantly supplied with the raw sensor data from the test, upon its
completion.
To further the educational usefulness of the towing tank, both for iMarine and local M.I.T. class labs, a 5-foot Series 60 -0.60 block coefficient parent hull was purchased by
M.I.T.. The fiberglass model was built by Creative Models and used a mold owned by Webb Institute. While the lines of Series 60 hulls are not "modern," there are several
benefits associated with this model. Series 60 models have been tested in nearly every model basin around the world. Resistance data is well published and accepted. As a result, testing of this model offers the opportunity to validate the accuracy of the M.I.T. Towing Tank. Furthermore, it gives students some baseline results for comparison when performing class-related tests.
Educational Value
Despite the limitations, small towing tanks offer many benefits, especially to educational institutions like M.I.T.. Interestingly, these benefits have not changed very much since the tank was first built in 1951. In their paper describing the M.I.T. Towing Tank, Abkowitz and Paulling (1953) listed the advantages of small towing tanks for university-based research. The list included:
" Small tanks require small models (5 to 6 feet on average), thus decreasing model
construction cost and time. Furthermore, small models can be constructed by students; something that would be impossible on larger scales.
* A small facility is easy to use, and can usually be operated short-handed, and even single-handed. This further facilitates student use of the towing tank for research.
" Academic institutions do not usually have sufficient funding to cover the
continual costs of operating and maintaining a large towing tank. These costs are significantly less for a smaller facility.
" Since the facility's primary purpose is to serve the academic and research needs
of the institute, rather than generate revenue via commercial work, outside work can be chosen based on the availability of the tank and by the "basis of the benefit to the educational process of the staff and students."
Today, this list can be expanded to include the benefit of providing a research platform for many types of experiments, other than ship model testing. This is especially
M.I.T. Towing Tank. In short, there seems to be no limit to the diversity of applications that can be tested at M.I.T.'s towing tank.
In addition to small scale, university research, the towing tank has many pure educational benefits. The hands-on and experimental nature of towing tanks offer students another means of comprehending the classroom subject matter. For example, watching a ship model generate a Kelvin wave pattern provides a concrete reference to the pictures and theory taught in class. Several times during the year, M.I.T. classes hold laboratory sessions where demonstrations and experiments are conducted in the towing tank. These tests include bare-hull resistance, resistance in waves, and seakeeping applications.
The educational value of a towing tank has been evident since well before the creation of M.I.T.'s towing tank, and the university has capitalized on these benefits for many decades. With the advent of new technology, linking the M.I.T. Towing Tank to the Internet was made possible; and under the same educational premise, this link was created for the purpose of learning. While hands on experiments are almost always the most educational, a web-based experiment can be considered the next best alternative for schools that do not have the resource of their own towing tank.
iMarine Features
Utilizing the functionality of LabVIEW, several of the towing tank controls were simplified, automated, and linked to the Internet. This allows students to have limited control of the towing tank, and offers them the opportunity to run customized
experiments.
Students are able to use the towing tank by logging onto an iMarine webpage that has been specifically created to act as the user interface. The webpage allows the student to input the desired testing speed. It also features two web cameras, from which the students can watch their live experiment. Figure 24 is a screen shot of the two web camera views during an actual experiment. The top camera is attached to the carriage to
allow students to see the ship model and the waves that are generated. The bottom camera is fixed to the side of the tank, and provides a view of the carriage approaching
and then moving past the camera.
http://imarine.mit.edu/gulfstroam both.html -Microsoft Internet Explorer
File Edit View Favorites Tools Help
Back ddSearch m 'Favorites
ij
jhttp:/imarne.mr.edugufstream both-htmf Go Lk,1 Applet cvcs started I Internet
At the M.I.T. Towing Tank, the LabVIEW program monitors the Internet and receives commands from the iMarine website. When the students submit a test, this speed is read
by LabVIEW and a fully automated run sequence is initiated. LabVIEW uploads the
speed to the motor, triggers the DAQ system to begin recording data, and commands the carriage to begin moving. Once the carriage has completed its run, the DAQ stops recording and immediately posts the data file to the iMarine website. This gives students immediate access to the results of the experiment. Simultaneously, the carriage begins its backup procedure to reset itself for the next test run. Lastly, a timer forces the system to wait a predetermined amount of time to allow the waves to dissipate in the tank before the next test is run.
Throughout the design of the system, safety and security was of primary concern. To achieve a safe test setting, several layers of security were incorporated into the system. First, the iMarine system cannot run without first being initialized by a supervising individual at the M.I.T. Towing Tank. When runs are being conducted, no input from this individual is required, but this person must remain at the facility as a precaution, and has the capability of terminating the Internet connection and stopping all testing at the press of a button. Second, the website is username and password enabled, which means only authorized users may use the iMarine system. Lastly, the LabVIEW program has been equipped with a queuing feature that allows the student to upload multiple runs. These runs will then commence in the order received, and only after the waiting period from the prior run has expired.
A set of detailed instructions for the set up and operation of the iMarine system is located
in Appendix A.
An Extended Example
In April 2006, the students of the Engineering Fluid Mechanics course at Maine Maritime Academy (MMA), instructed by Dr. Richard Kimball, participated in the first iMarine laboratory experiment of the M.I.T. Towing Tank. The lab was a series of simple ship
resistance tests, in which total drag was measured. The procedure and results of which are described below. The lab instructions that were provided to the students can be found in Appendix B.
The setup for the iMarine lab is extremely simple for the educator. At MMA, the
classroom setup consisted of a computer with Internet access and an LCD projector. For the MMA test, the entire class participated in one lab; however, it could be run in small groups, to allow for more interaction. Figure 25 is a photograph taken during the MMA iMarine lab.
Figure 25. iMarine lab underway at Maine Maritime Academy.
At the time of the experiment, the instructor logged onto the iMarine website with the pre-assigned user name and password. The instructor opened the webcams for the class
webpage allowed the instructor or student to input the testing speed decided upon by the class. While a maximum speed is predetermined and limited by the iMarine and
LabVIEW software, the open-ended input for test speeds gives the students to opportunity to learn about scaling techniques and perform the calculations. With the speeds determined, the speed, an experiment name, and any additional comments or notes for the test were entered on the iMarine website, as pictured in Figure 26.
My Dais. - Submit a Tow Tank Experiment -Microsoft Internet Explorer
Fie Edit View Favorites Tools Help
Q
Back X1 ,Search Favorites ~ - ~ ii~Jhttp//imar e.mt edusecuredase/submtExp_TowTank.ohp VjGo
Jomn
My Experiments Home
My Simulations Click To View Conero Log in as denmouer with no password. I - Lea
My &eometries Input your experiment parameters:
Submit your v i mo ~
mm":
experiment I - Experiment
Submit your I - Buid
simulation
Submit your
geometry My D AI5E
I-Sca Classroom
Change Password Input the carriage speed: (M U' 1.6 m/s) Web Museum
Sign Out
Run your Tow Tank Experiment
I MASSACHUSETINSTI-UOTE P
tkm I Sft I s It ErchI Ww " I na ctus corighF& Z05 Masaachusaetstitutseof Technology, Al rightsreserved
Internet
Figure 26. iMarine website screen capture.
Upon clicking the "Run your Tow Tank Experiment" button, the data was transmitted over the Internet to the towing tank computer running LabVIEW. As previously