Correlating the Ultrasonic Thrust
Force with Acoustic Streaming Velocity
The MIT Faculty has made this article openly available.
Please share
how this access benefits you. Your story matters.
Citation
Tan, A.C.H., and F.S. Hover. “Correlating the Ultrasonic Thrust Force
with Acoustic Streaming Velocity.” Ultrasonics Symposium (IUS),
2009 IEEE International. 2009. 2627-2630. ©2010 IEEE.
As Published
http://dx.doi.org/10.1109/ULTSYM.2009.5442075
Publisher
Institute of Electrical and Electronics Engineers
Version
Final published version
Citable link
http://hdl.handle.net/1721.1/62240
Terms of Use
Article is made available in accordance with the publisher's
policy and may be subject to US copyright law. Please refer to the
publisher's site for terms of use.
Correlating the ultrasonic thrust force with acoustic
streaming velocity
Alfred C.H. Tan, and Franz S. Hover Department of Mechanical Engineering
Massachusetts Institute of Technology
77 Massachusetts Avenue, Cambridge, MA 02139, USA [email protected]
Abstract—The UltraSonic Thruster (UST) is an actuator which
employs a piezoelectric transducer to generate a highly directive ultrasonic wave so as to produce bulk fluid movement. This streaming phenomenon can be utilized underwater for thrusting or maneuvering purposes in marine applications, and particularly at very small scale. We make a new connection between fluid flow and forces, establishing a specific formula for estimating overall thrust from the velocity field. Using Particle Image Velocimetry (PIV) and force measurements, we confirmed the result, with an error of about five percent in several tests. The use of PIV for characterizing UST properties is considerably richer than measuring thrust or acoustic intensity alone, and could lead to new insights during the design process.
Keywords-Underwater vehicle propulsion; fluid flow measurement; underwater acoustic transducers; acoustic fields; correlation
I. INTRODUCTION
The propulsion of marine craft today is almost exclusively achieved with rotary propellers, or impellers acting within a pump or jet assembly. One promising alternative paradigm is flapping foils, inspired by fish and other marine animals, e.g., [1]. But biomimetic approaches can bring added complexity into the physical design, and unsteady loading that must be carefully considered. At small scales – on the order of one centimeter – neither rotary blades nor biomimetic approaches are practical today, at least in terms of manufacturing and biofouling. At the same time, in marine robotics today, there is a high interest in very small vehicles that could be used for inspection of complex structures.
A third propulsion paradigm that we explore in this paper is the UltraSonic Thruster (UST), constructed using high-voltage, high-frequency actuation of a PZT (piezoelectric) membrane in a specially designed transducer body. A loss of mean momentum flux leads to a net force, as detailed in [2], [3]. This force is associated with the thrust experienced on the transducer surface, as we describe in the next section.
The UST is superbly suited to thrust generation at small scales, because it has no moving parts beyond the membrane, and the sound intensity is high enough to self-clean. Further, fabrication of small PZT membrane structures is mature.
Examples of thrust generation by ultrasonic means can be found in airborne applications, where Parviz et al. [4], [5] used
specially designed micro-thrusters mounted with ultrasonic membranes, to stream flow through an array of perforated holes, hence generating thrust. Underwater, Balamuth [6] used the concept of ultrasonic surface vibrations (Lamb wave) to excite a stator, which in turn rotates a rotor so as to produce thrust. Another example is found in the work of Saito et al. [7], where they utilize the acoustic radiation force generated from an ultrasonic transducer impinging on a small propeller to transfer energy. Rife et al. [8] attached a transducer externally onto a microfluidic, closed-loop chamber designed to pump or mix water, which is akin to microreactors found commercially. These applications, while generating flow by ultrasonic means, do not treat thrust as a direct locomotive agent for marine craft and only very few brief articles can be found addressing this idea [9], [10], [11].
Propeller action as described by momentum theory [12] is generally unlike an ultrasonic thruster in that the latter is an acousto-fluidic energy conversion between the electrical power across the piezoelectric transducer and the fluid loads (which amount to streaming), as characterized by the acoustic intensity. In order to evaluate this ultrasonic thrust quantitatively, Allison et al. [9] used the acoustic power to calculate thrust exerted on the transducer surface. They consider acoustic power to correspond to the electrical power applied to a transducer circuit with large electrical impedance. However, one must note the fact that this predictive approach suffers from the following drawbacks: (i) errors are introduced because of electrical power loss inside the transducer; (ii) it is applicable only at the resonant frequency of the transducer; and (iii) the fluid loads must be represented in the equivalent lumped circuit impedance. It is also an equally unattractive option to determine the acoustic power by hydrophone because of cavitation and the heating effect on the hydrophone, the presence of errors as induced from a finite-sized hydrophone tip in a narrowly focused ultrasonic beam, and errors introduced to the frequency response due to spurious harmonic components [13]. Indeed, Hariharan et al. [13] reported that acoustic intensity measurements do not perform well, having an error in excess of 20% with experimental data. Overall, the accurate prediction of thrust from properties observed or controlled at the transducer, or in the immediate acoustic field, is very difficult without a prior knowledge of the transducer characteristics.
As we describe below, a clean predictive capability can be found using the flow field of the wake. Non-invasive acoustic velocity profiling by particle image velocimetry (PIV) is known for outstanding accuracy; Myers et al. [14] for example report a 2% standard deviation at the point of maximum velocity. The procedure we develop here is to derive the thrust force through a parameterization of the axial velocity distribution, which we would expect to improve thrust quantification accuracy significantly compared to previous approaches, while taking advantage of the insights gained by whole-field PIV data.
II. VELOCITY CORRELATION WITH THRUST
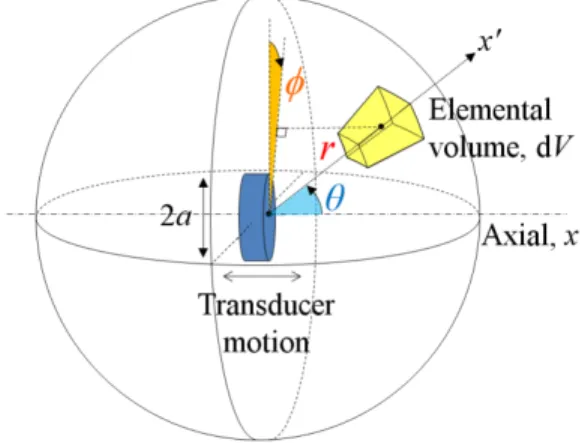
In Fig. 1, when a circular ultrasonic transducer emits a beam of acoustic energy into the fluid, a resultant thrust force (T) will be exerted on the surface of the transducer. This can be related to the volumetric integral of the radiating force [9]
∫∫∫
′ =V F dV
T cosθ (1)
where the radiation force F′ is acting per unit volume along the x′ axis, and the symbol overbar denotes time-averaging.
The upper bound of this thrust force is governed by the diameter of the transducer, the frequency of the ultrasound source, the amplitude of the transducer surface velocity, and the fluid density [9]. It is also known that the voltage applied across the transducer (V) and the acoustic impedance matching layer inserted at the transducer-fluid interface will also affect the thrust generation [9], but such optimal design parameters are not the focus of this study.
Figure 1. Definitions of an elemental control volume in the far-field. The ultrasonic transducer is at the center of the spherical shell, emitting ultrasound
toward the right hand side.
Next, we consider the conservation of momentum. Part of the acoustic energy will be absorbed, and following Lighthill [3], this absorption is exemplified by a loss in mean momentum flux in a viscous dissipative fluid medium, and hence generation of a streaming field. For a steady, incompressible acoustic streaming motion along the x-axis, the force derived can be expressed from the Navier-Stokes equation as
x x x x F x u x p x u u + ∂ ∂ + ∂ ∂ − = ∂ ∂ 2 2 0 0 μ ρ (2)
where the term on the left hand side of the equation depicts the fluid particle acceleration. The terms on the right hand side of the equation depict mean pressure gradient, flow resistance due to the viscosity μ, and the force generating the flow. It is assumed that the nonlinear terms in the velocity, ux are negligible. Assuming the fluid mass is conserved within the control volume, that is 0 =0
∂ ∂
x ux
ρ and following Rudenko [2], equation (2) can be solved by puttingFx =Ae−2αx, using
the initial conditions u
( )
0 =0, u( )
∞ =0, and limiting the case to where the ultrasonic field is fully developed (t → ∞). This gives( )
(
)[
e x e Bx]
B A u − − − − = α α ν 2 2 2 2 (3)where A and B are coefficients of the velocity profile, ν=μ /ρ is the kinematic viscosity and α is the sound absorption coefficient [2]. The velocity profile in (3) is valid for the spatial summation of each velocity vector pointing along the axial direction. The low-velocity distribution is considered to be axially symmetric; this distribution is consistent with the numerical solutions discussed in [13], [14], [15].
Lighthill [3] showed that the F′term in (1) can also be represented by the Reynolds stress of the ultrasonic field given by x u ∂ ∂ − 2
ρ where u is the time average of the acoustic particle velocity along the axial direction.
The elemental control volume dV coordinates in (1) are expressed geometrically in Fig. 1 as the elevation angle, azimuth angle and the axial distance from the transducer surface: θ, φ, and x respectively. We consider the angle of the ultrasonic beamwidth θ as the dominant acoustic lobe in the far-field, which has an upper limit governed by
ka 832 . 3 sin 1 1= −
θ [16], where k is the wave number and a is the radius of the transducer.
The variables of integration dθ dφ dr from (1) are expressed using the relationships
θ cos dx dr= and θ 2 2 2 cos x r = . The
limits of the integral in (1) can then be written as
. cos sin 0 2 0 0 2 2 2 1 dx d d x x u T θ φ θ θ ρ π θ
∫ ∫ ∫
∞ ⎟⎟ ⎠ ⎞ ⎜ ⎜ ⎝ ⎛ ∂ ∂ − = . (4)Substituting (3) into (4) eventually gives
(
)
(
)
(
)
⎥⎥⎦ ⎤ ⎢ ⎢ ⎣ ⎡ + + − − − = 2 2 2 2 2 2 2 1 2 2 1 2 4 8 1 4 1 sec 2 B B B v A T α α α θ π ρ . (5) Note that (5) is only applicable when discernable acoustic streaming exists in the acoustic field; the acoustic power contribution due to extraneous acoustic side lobes is neglected.From a naval engineering point of view, it is important to emphasize that the thrust level from a UST is not directly related to near-field wake cut velocity, as is the case in traditional propeller theory.
III. EXPERIMENTAL SETUP
Two water tanks are used to measure thrust, and to visualize streaming separately.
A. Thrust Tank Setup
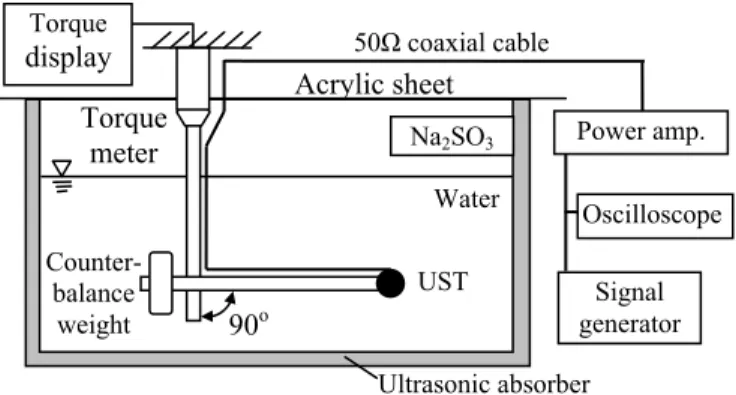
The 1.2×0.6×0.6m fiberglass water tank in Fig. 2 shows a clamped torque meter (MGT10Z) with a 0.5m long shaft forming an L-shape with another 0.5m arm. A UST is attached at the tip of the arm such that it will generate an effective torque moment. A counter-weight is placed at the opposite end of the arm for balance. Specialized ultrasonic absorbers (Aptflex F28) line the interior walls of the tank and vibration absorbers are mounted at the tank base because of the extreme sensitivity of the torque measurement. An acrylic sheet is placed atop the tank and clamp-sealed around the rubber rim. The torque meter calibration showed that measurements are found to be repeatable to a precision level of ±0.09mN.
Figure 2. Schematic diagram of the torque measurement setup. The UST is submerged in a semi-anechoic tank, and a moment on the torque meter is
generated by the UST via an L-shaft.
Grade 2 distilled water was used to avoid any impurities and to ensure reliable results; anhydrous sodium sulfite was suspended above the water level to absorb excess oxygen. The setup was allowed to stand for several days before measurements were taken.
The UST we study here is a 7mm diameter, 0.4mm thick piezoelectric transducer (adapted from MA40E7S, Murata Manufacturing Co. Ltd.), attached to a waterproof housing with a specialized air-gap backing. A signal generator (HP 8114A) and power amplifier (ENI 3100L) provide the amplified signals to the UST. All connections were made with 50Ω coax cables.
B. Particle Image Velocimetry (PIV) Tank Setup
Fig. 3 shows the 2-D Particle Image Velocimetry (PIV) water tank, measuring 2.4×0.7×0.7m. Polyamide seeding particles with a mean particle diameter of 50µm and density 1010kg/m3 were used. We used a Quantronix diode pumped
Q-switched frequency laser (Darwin-527-30M), and a LaVision Imager Pro HS digital camera, fitted with a 77mm diameter Sigma 24mm f/1.8 EX DG aspherical macro lens. At 400Hz, the camera samples 300 timed, paired images in a 10cm×10cm plan view. DaVis 7.1 software was used to post-process the streaming data. The UST was submerged at a depth of 0.2m from the water surface and 0.7m from the laser.
Figure 3. Schematic diagram of the streaming velocity measurement setup. The digital camera is mounted perpendicularly above the water surface and
the laser sheet, capturing the particle trajectories for post-processing. IV. RESULTS AND DISCUSSIONS
Two dominant thrust peaks were observed at 3.6MHz, 20Vpp and 7MHz, 40Vpp with thrust levels at 2.2mN and
9.6mN, respectively. Note that we cannot control the voltage delivered to the PZT explicitly, due to resonance conditions in the power circuit. Thrust peaks at 3.6 and 7MHz, however, are highly repeatable. The first peak at 2.2mN is likely due to resonance of the air-backed cavity on the transducer [4]. The other thrust peak is probably caused by electrical resonance of the PZT capacitive load with a fixed transducer circuit impedance.
As an example using the PIV system, velocity field contours in the plane of the transducer center, for 3.6MHz, 20Vpp, are shown in Fig. 4. As shown, the wake is narrow - one
centimeter across at nine centimeters from the face.
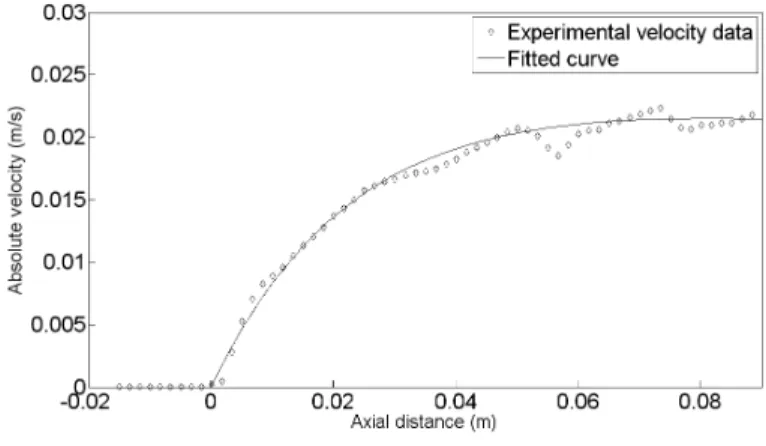
The axial velocity distribution is extracted for this case as shown in Fig. 5. Axial streaming velocity is observed to increase rapidly in the nearfield, reaching 0.022m/s at about 0.09m from the transducer face. A parameterized velocity profile is curve fitted into the recorded data using equation (4), where A=4.4×10⁻⁵ and B=1/0.024. With ν=1×10⁻⁶m2/s and
α=0.754 at 3.6MHz, the thrust calculated using (5) is 2.1mN. As mentioned earlier, the thrust measured experimentally at 3.6MHz is 2.2mN, which implies about a 5% error with the calculated value. Some of the error can be attributed to curve fitting and of course to measurement errors.
Na2SO3 Signal generator Torque display Power amp. 90o UST Water Oscilloscope Counter- balance weight 50Ω coaxial cable Ultrasonic absorber Torque meter Acrylic sheet Sheet optics UST Laser sheet Digital PIV camera Signal gen. Oscilloscope Power amp. Water Synchronized im age ac qu isi tion Nd-YLF
Figure 4. Velocity field contours generated by the UST with source signal at 3.6MHz, amplified to 20Vpp. Contours are plotted in steps of 0.004m/s. The
axial center of the UST surface is located at (0, 0).
Figure 5. Absolute velocity (m/s) versus axial distance (m) for the 3.6MHz signal source at 20Vpp.
V. CONCLUSION
We measured both the thrust and the velocity wake of an ultrasonic thruster (UST). Using the axial wake distribution, a velocity function was fitted using two characteristic coefficients, which were then used to estimate the thrust. The error level relative to the direct force measurement is about five percent, a significant improvement on some other methods for prediction of thrust by a UST.
PIV is a very useful tool in ultrasonic thrust, because it more fully characterizes the flow conditions than either an acoustic or acoustic intensity measurement. This increase in understanding the critical acousto-fluid interactions is likely to benefit the design and development of efficient and practical UST devices, for example in controlling the wake shape using appendages.
REFERENCES
[1] M. S. Triantafyllou, F. S. Hover, A. H. Techet, and D. K. P. Yue, “Review of Hydrodynamic Scaling Laws in Aquatic Locomotion and Fishlike Swimming,” Appl. Mech. Rev., vol. 58, no. 4, pp. 226–237, July 2005.
[2] O. V. Rudenko and S. I. Soluyan, “Theoretical foundations of nonlinear acoustics,” translated from Russian by Robert T. Beyer, Plenum, New York, 1977.
[3] M. J. Lighthill, “Waves in Fluids,” Cambridge University Press, Cambridge, England, U.K., 1978.
[4] B. A. Parviz, K. Najafi, M. O. Muller, L. P. Bernal and P. D. Washabaugh, “Electrostatically driven synthetic microjet arrays as a propulsion method for micro flight. Part I: principles of operation,
modeling, and simulation,” Microsyst. Technol., vol. 11, no. 11, pp.1214–1222, Oct. 2005.
[5] B. A. Parviz, K. Najafi, M. O. Muller, L. P. Bernal and P. D. Washabaugh, “Electrostatically driven synthetic microjet arrays as a propulsion method for micro flight. Part II: microfabrication and initial characterization,” Microsyst. Technol., vol. 11, no. 12, pp.1292–1300, Nov. 2005.
[6] L. Balamuth, “Macrosonics and the ultrasonic motor,” in 83rd Meeting of the Acoust. Soc.America (Abstracts only), vol. 52, no. 1(pt.1), Buffalo, NY, 1972, p. 134.
[7] H. Saito, K. Sato, K. Yokota, and N. Endo, “A study on a micro mover driven by ultrasonic waves,” Ultrasonics, vol. 43, no. 7, pp. 524–530, Jun. 2005.
[8] J. C. Rife, M. I. Bell, J. S. Horwitz, M. N. Kabler, R.C.Y. Auyeung and W.J. Kim, “Miniature valveless ultrasonic pumps and mixers,” Sens. Actuators A Phys., vol. 86, no. 1-2, pp. 135-140, Oct. 2000.
[9] E. M. Allison, G. S. Springer and J. Van Dam, “Ultrasonic propulsion,” J Propul Power, vol. 24, no. 3, pp. 547–553, May/Jun. 2008.
[10] H. Yu and E. S. Kim, “Ultrasonic Underwater Thruster,” in Proc. IEEE Int. Conf. Micro Electro Mech. Syst. MEMS, Maastricht, Netherlands, 2004, pp.486–489.
[11] S. Nobunaga, “Ultrasonic toy ship,” JP2004305510 (A) [In Japanese], Nov. 4, 2004.
[12] E. V. Lewis, Principles of Naval Architecture Volume II: Resistance, Propulsion and Vibration, Society of Naval Architects & Marine Engineers, NJ, 1988.
[13] P. Hariharan, M. R. Myers, R. A. Robinson, S. H. Maruvada, J. Sliwa and R. K. Banerjee, “Characterization of high intensity focused ultrasound transducers using acoustic streaming,” J. Acoust. Soc. Am., vol. 123, no. 3, pp.1706-19, Mar. 2008.
[14] M. R. Myers, P. Hariharan and R. K. Banerjee, “Direct methods for characterizing high-intensity focused ultrasound transducers using acoustic streaming,” J. Acoust. Soc. Am., vol. 124, no. 3, pp.1790-1802, Sept. 2008.
[15] M. Maezawa, K. Nemoto and T. Kamakura, “PIV measurement and CFD analysis of acoustic streaming from a miniature source,” IEIC Technical Report (In Japanese), vol. 103, no. 87, pp.27-30, May 2003. [16] D. T. Blackstock, “Fundamentals of Physical Acoustics,” Wiley, NY,
2000.