HAL Id: hal-01470399
https://hal.inria.fr/hal-01470399v2
Submitted on 22 Mar 2017
HAL is a multi-disciplinary open access
archive for the deposit and dissemination of
sci-entific research documents, whether they are
pub-lished or not. The documents may come from
teaching and research institutions in France or
abroad, or from public or private research centers.
L’archive ouverte pluridisciplinaire HAL, est
destinée au dépôt et à la diffusion de documents
scientifiques de niveau recherche, publiés ou non,
émanant des établissements d’enseignement et de
recherche français ou étrangers, des laboratoires
publics ou privés.
Characterizing the Performance of Modern
Architectures Through Opaque Benchmarks: Pitfalls
Learned the Hard Way
Luka Stanisic, Lucas Mello Schnorr, Augustin Degomme, Franz Heinrich,
Arnaud Legrand, Brice Videau
To cite this version:
Luka Stanisic, Lucas Mello Schnorr, Augustin Degomme, Franz Heinrich, Arnaud Legrand, et al..
Characterizing the Performance of Modern Architectures Through Opaque Benchmarks: Pitfalls
Learned the Hard Way. IPDPS 2017 - 31st IEEE International Parallel & Distributed Processing
Symposium (RepPar workshop), May 2017, Orlando, United States. �hal-01470399v2�
Characterizing the Performance of Modern Architectures
Through Opaque Benchmarks: Pitfalls Learned the Hard Way
Luka Stanisic
∗
, Lucas Mello Schnorr
†
, Augustin Degomme
‡
, Franz C. Heinrich
§
, Arnaud Legrand
§
, Brice Videau
§
∗
Inria Bordeaux Sud-Ouest, Bordeaux, France – Email: [email protected]
†
Informatics Institute, Federal University of Rio Grande do Sul, Porto Alegre, Brazil – Email: [email protected]
‡
Université de Basel, Basel, Switzerland – Email: [email protected]
§
CNRS/Inria/University of Grenoble Alpes, Grenoble, France – [email protected]
Abstract—Determining key characteristics of High
Perfor-mance Computing machines that allow users to predict their
performance is an old and recurrent dream. This was, for
example, the rationale behind the design of the LogP model
that later evolved into many variants (LogGP, LogGPS,
LoGPS, . . . ) to cope with the evolution and complexity of
network technology. Although the network has received a lot of
attention, predicting the performance of computation kernels
can be very challenging as well. In particular, the tremendous
increase of internal parallelism and deep memory hierarchy
in modern multi-core architectures often limits applications by
the memory access rate. In this context, determining the key
characteristics of a machine such as the peak bandwidth of each
cache level as well as how an application uses such memory
hierarchy can be the key to predict or to extrapolate the
performance of applications. Based on such performance
mod-els, most high-level simulation-based frameworks separately
characterize a machine and an application, later convolving
both signatures to predict the overall performance. We evaluate
the suitability of such approaches to modern architectures
and applications by trying to reproduce the work of others.
When trying to build our own framework, we realized that,
regardless of the quality of the underlying models or software,
most of these frameworks rely on “opaque” benchmarks to
characterize the platform. In this article, we report the many
pitfalls we encountered when trying to characterize both the
network and the memory performance of modern machines.
We claim that opaque benchmarks that do not clearly separate
experiment design, measurements, and analysis should be
avoided as much as possible in a modeling context. Likewise,
an a priori identification of experimental factors should be done
to make sure the experimental conditions are adequate.
I. I
NTRODUCTION
HPC architectures and application have become
increas-ingly complex and evaluating the requirements of modern
HPC applications or planning platform upgrades requires
rigorous performance characterization. In such context, the
ultimate goal is to predict the performance of an application
on a given platform, enabling users and researchers to
study scalability, deployment optimizations, extrapolation,
and what-if scenarios. A common approach consists in
convolving platform characteristics with application
char-acteristics through a simulator [1]. However, faithful
pre-dictions require to instantiate such simulators with faithful
measurements obtained on existing platforms.
Such measurements are generally obtained through
well-known or hand-tailored benchmarks. They measure key
platform characteristics such as network latency and
band-width, software overhead, memory speed, floating point
performance or energy usage. These benchmarks generally
execute precise sequences of operations and rely on data
captured from CPU hardware counters, by dynamic binary
instrumentation or from MPI tracing hooks, for instance.
Nevertheless, most of these benchmarks have “opaque”
and even sometimes arbitrary procedures, especially as
hard-ware evolves. To achieve a minimal measurement duration
and memory footprint, they perform both measurements
and the corresponding statistical analysis in a black-box
like manner, directly generating statistical summaries as
output. No intermediary data is kept after the benchmark
has finished the measurements and analysis. This absence
of intermediary raw measurements makes any performance
investigation and model validity assessment impossible to
accomplish and ultimately leading to inaccurate models and
wrong conclusions that easily go unnoticed. Furthermore,
modern architectures and operating systems have become
intricate. It is thus essential to meticulously setup and
control the environment to establish meaningful benchmark
conditions. We believe the experimental design, the
measure-ments, and the statistical analysis should be done through
rigorous and open tools to provide sound and faithful data
for model and simulation instantiation.
In this article we explain how opaque benchmarks
typ-ically work and explain how they should instead be
orga-nized to provide better information for the instantiation of
performance models. We motivate this claim by reporting
many pitfalls we encountered when we tried to reproduce
earlier strategies for performance characterization of recent
hardware. The encountered pitfalls include the impact of
compiler optimizations, the DVFS policy, the operating
sys-tem scheduler, and peculiarities of the machine architecture.
Our analysis relies on simple scripts, the R language [2],
and the org-mode’s literate programming approach [3]. Our
activity is registered in a reproducible research spirit so that
although some of these experiments were done five years
ago, we are still able to faithfully exploit them.
Section II presents some related work on performance
pre-diction through simulation that motivated our investigation
along with classical underlying network and memory
mod-els. This allows the reader to understand the rationale behind
most benchmarks’ structure. Sections III and IV present
some performance characterization of both the network layer
and memory hierarchy, illustrating the many pitfalls one
can stumble upon when pursuing such task. Section V
presents the measurement and analysis methodology we
used and which we believe to be more appropriate when
characterizing the performance of modern HPC architectures
for model instantiation purposes.
II. R
ELATED
W
ORK
We present the general context of HPC performance
prediction through simulation and the most common
under-lying models. This motivates the presentation of common
benchmarks for network and memory performance
charac-terization that are detailed in Sections III and IV.
A. Performance Prediction with Simulation
The diversity and complexity of HPC applications makes
their modeling quite challenging. Depending on the
expecta-tions and scope, some approaches rely on simple first-order
analytic models (e.g., Amdahl’s law or roofline models [4]),
while others rely instead on cycle/packet-level simulations.
For large MPI applications, it is common to rely on an
intermediate approach (e.g., PMaC
[1], Dimemas [5],
BigSim [6], LogGopsim [7], or SimGrid [8]) that convolves
the application and machine signatures through a high
level discrete event simulator. The PMaC framework [1],
depicted in Figure 1, offers a good example to explain the
method. Computational and communication capabilities are
first considered separately to predict the performance of a
given application
A
on a machine
M
. An MPI application can
be seen as a series of sequential computation blocks
inter-leaved with MPI calls. The processor usage (e.g., number
of instructions and floating point operations, or the hit rate
in each level of the memory hierarchy) of each block may
be obtained through an instrumented execution, a detailed
cycle-level simulation (the MetaSim tracer in PMaC), or a
static analysis. The performance of the processor (e.g., the
peak performance of each level of the cache hierarchy and
of the memory) is measured independently by a benchmark
(MAPS in PMaC) and both series of values are convolved
using the MetaSim convolver through a formula (e.g., the
maximum or the sum over cache levels of the products
of the hit rate, the number of accesses, and the inverse
of the bandwidth). Likewise, MPI operations are traced
(with MPIDtrace in PMaC) and the network parameters are
benchmarked (with PMB [9] in PMaC) and later convolved
(with the DIMEMAS [5] discrete event simulator in PMaC).
Most simulators designed for HPC use a similar approach
but differ in sophistication of the underlying models.
Many network performance models [10], [11], [12], [13],
[7] have been developed over the last 30 years. Memory
performance modeling, on the other hand, is much more
recent, especially in the context of multi-core machines.
Single-Processor Model
Characterization of memory performance capabilitiesMachine M
MAPS
Characterization of memory operations needed to be performedApplication A
MetaSim Tracer
Communication Model
Characterization of network performance capabilitiesMachine M
PMB
Characterization of network operations needed to be performedApplication A
MPIDtrace
Mapping memory usage needs of Application A to the capabilities of
Machine M
Convolution Method
MetaSim Convolver
Mapping network usage needs of Application A to the capabilities of Machine M Convolution Method
DIMEMAS
Performance Prediction of
parallel application A on Machine M
Figure 1.
General approach proposed in the PMaC Framework [1]
to predict performances of HPC applications: application and machine
signatures are convolved through a network and memory model.
Complex and undisclosed hardware architectures, with
user-transparent memory access, make it difficult to conceive a
proper model because it is hard to obtain direct and faithful
observations. As follows, we briefly discuss the efforts
re-garding network and memory performance characterization.
B. Network Performance Characterization
Network performance modeling generally involves three
aspects: the characterization of CPU and network usage as
described for example in the LogP model [14], the
synchro-nization mode between the sender and the receiver, and the
presence or lack of linearity for each of the modes. In LogP,
o is the software overhead per byte and models the CPU
occupation per message, L is the minimal transmission delay
over the network (latency), and g is the gap per byte between
two messages (i.e., the invert of the bandwidth). We can
distinguish between three synchronization protocols: eager
(totally asynchronous), rendez-vous (fully synchronized),
and detached (an intermediate behavior). Finally, piecewise
modeling accounts that different values for the previous
parameters may be used depending on the range in which
the message size falls. The more elaborate models comprise
all such aspects and are generally needed to capture the
behavior of modern MPI implementations and interconnects.
Several tools enable the measurement of network
param-eters (latency, gap, and software overhead). The Pallas MPI
Benchmarks (PMB) suite [9], SkaMPI [15], Conceptual [16],
NetGauge [17], and Confidence [18] all demonstrate unique
qualities in such measurement task. The PMB suite provides
a framework to measure a subset of MPI operations and is
detached from a performance model. It characterizes
net-work performance and helps identifying potential problems
and improvements. PMB only reports mean values for each
requested message size and number of repetitions.
SkaMPI and Conceptual feature a Domain-Specific
Lan-guage (DSL) to describe how experiments should be
ac-complished. While SkaMPI focuses only on MPI,
Concep-tual has a much broader set of backends, including MPI.
for
datasize
in
(0, 1, 2, 4, 8, ..., 2^16) {
for
repetition
in
(1..N) {
timer_start();
if
(sender) Send()
else
Recv()
timer_stop();
}
# Compute statistics (average, standard deviation);
# Test for performance rupture and possibly
#
reset the corresponding breakpoints;
}
# Summary report of network metrics for each data size
Figure 2.
Pseudo-code to measure network performance, varying the data
size and repeating the experiment to quantify variability; with on-the-fly
statistics, piecewise models’ breaks are immediately defined.
Both make it possible to very rapidly generate complex
benchmarking programs with a few lines of DSL code.
Unlike the previous two tools, NetGauge provides a way to
explicitly output all the necessary parameters to instantiate
the LogGP [10] and PLogP [11] models for a given
ma-chine. NetGauge supports many communication protocols
including InfiniBand, Myrinet/GM, TCP/IP as the Ethernet
Datagram Protocol (EDP) and the Ethernet Streaming
Pro-tocol (ESP), and MPI.
Finally, the authors of Confidence [18] note that many
sources of performance variability can be found in modern
HPC systems (e.g., OS noise, network collapse or transient
effects resulting from user timeshare) and focus on reporting
the variability that users may actually face and which is
hidden by common benchmarks. Such information about
variability could be used for simulation purposes provided
its dependence on message size is properly characterized.
C. Memory Performance Characterization
Roofline estimations [4] are the simplest way to
esti-mate memory access performance. The principle of such
benchmarks is to saturate the memory utilization, effectively
defining the peak access rate (GB/s). The Performance
Modeling and Characterization (PMaC) framework [1] relies
on the MultiMAPS benchmark to measure the memory
bandwidth for different data sizes, strides and line sizes. By
changing the data sizes, this benchmark captures different
characteristics of the memory cache levels. PChase [19]
also assesses memory latency and bandwidth on multi-socket
multi-core systems, captures the interference between CPUs
and cores when accessing memory, and ultimately provides
a richer model.
III. N
ETWORK
L
AYER
P
ERFORMANCE
M
ODELING
The simplest network characterization strategy consists
in measuring the time it takes to transfer a given amount
of data between two endpoints. Measurement variability
should also be assessed since network stack interactions are
complex. Figure 2 presents this prevailing approach used
by many tools (described in Section II). Increasing the data
size in powers of 2, the benchmarks measure N times the
0
50
100
150
200
250
300
350
0
10000 20000 30000 40000 50000 60000
Time in microseconds
Datasize in bytes (s)
Open MPI - G*s+g
Open MPI - o
Myrinet/GM - G*s+g
Myrinet/GM - o
Figure 3. Time as a function of message size for different communication
libraries using a Myrinet/GM network (taken from [20] as example).
same experimental configuration. In this example, a simple
send/recv is placed to illustrate the principle although more
complex operations may be also used (e.g., non-blocking,
one-sided, collective). The measured operation can also be a
more complex pattern involving several message exchanges,
as in the LogGP [20], the LoOgGP [21], and the PLogP [11]
benchmarks that directly output model parameters. Most
strategies employ per message size measurements to
calcu-late statistics (bandwidth, calcu-latency, etc.) in an online fashion.
If piecewise linear modeling is investigated, the behavioral
breaks are automatically detected during the experiment,
using linear extrapolations from the already measured points
or outlier definition schemes. At the end of the main loop,
tools report the aggregated results per operation and per data
size in textual or CSV file format for external exploitation.
The automatic detection of protocol changes depending on
the message size has been the object of several strategies.
NetGauge [20], PLogP [11], and LoOgGP [21], for instance,
provide good examples. When linearly increasing the
mes-sage size, and for every new measurement, NetGauge checks
for protocol changes by using the mean least squares
devia-tion (lsq) between the previous point that started a new slope
and the latest measurement. If the lsq has changed more than
a factor defined by the analyst, NetGauge waits for five new
measurements before confirming the protocol change. This
technique avoids that “anomalous” measurements mislead
the detection of true protocol changes. In PLogP, at every
new measurement when increasing the message size in
powers of 2, the implementation extrapolates the previous
two measurements and checks if the difference between the
new measurement and the linear extrapolation is within an
acceptable range. If that is not the case, a new measurement
is undertaken with a message whose size is the mid-value
between the latest two measurements. This is repeated,
halving the intervals, until the extrapolation is matched
by measurements or a maximum number of attempts is
attained. The LoOgGP linearly increases the message sizes,
using the same approach as NetGauge, but adopts an offline
analysis with user intervention. After removing outliers, a
local neighborhood of a configurable extent is defined for
each measurement. If a measurement has a maximum value
in a neighborhood, it is considered as a protocol change. It is
up to the analyst, using plots for T
o
(s) (overhead) and T
g
(s)
(gap), to finally decide if detected points are real protocol
changes or not. Despite the analyst’s mediation, authors state
that the mechanism is sensitive to the neighborhood size and
the message size steps during the measurement stage.
We detail potential problems faced by these common
methods to model network performance. Our
recommenda-tions to avoid such pitfalls are presented in Section V.
1) Impact of Temporal Perturbations:
The system being
measured may suffer temporal perturbations which may
mislead completely the result interpretation. Perturbations
can be natural or caused by external activity in a poorly
isolated system. Repeating the benchmark would probably
lead to divergent estimations. Without a manual check, the
measurements could be filtered out as outliers, or affect the
online detection of protocol changes. An anomaly could pass
as a break point by the heuristics implemented in NetGauge
and PLogP, for instance. Concerning results, there is no
guarantee that the reported breaks are actually meaningful.
2) Impact of Message Sizes in the Network Modeling:
Another issue regards the input message sizes used in the
experiments, as they are frequently biased. Using messages
in powers of 2 may miss the real behavior of the network
software stack. Some values, such as 1024 for instance,
may have special behavior coded into the network layers
that are nonlinear when compared with close values directly
smaller or larger than that one. Such small changes in the
data sizes might pass undetected by statistical analysis that
is conducted without supervision. On benchmarks that use
linear increments, such as NetGauge and LoOgGP, the bias
issue is still present because the measurements depend on
the selected starting message size and the increment value.
3) Impact of Preconceived Assumptions in the Analysis:
Figure 3, reported by Hoefler et al. [20], demonstrates a
typical case of a piecewise network modeling with protocol
changes. They report a single protocol change for messages
larger than 32KBytes. However, a new look to the data could
indicate another break at 16KBytes, when the slope of the
OpenMPI (G × s + g) and OpenMPI (o) slightly changes.
So the assumption of the presence of a fixed number of
breakpoints might mislead the network modeling.
Current MPI and network driver implementations
typi-cally incur several synchronization modes (eager, detached,
rendez-vous) and each of these might need a piecewise
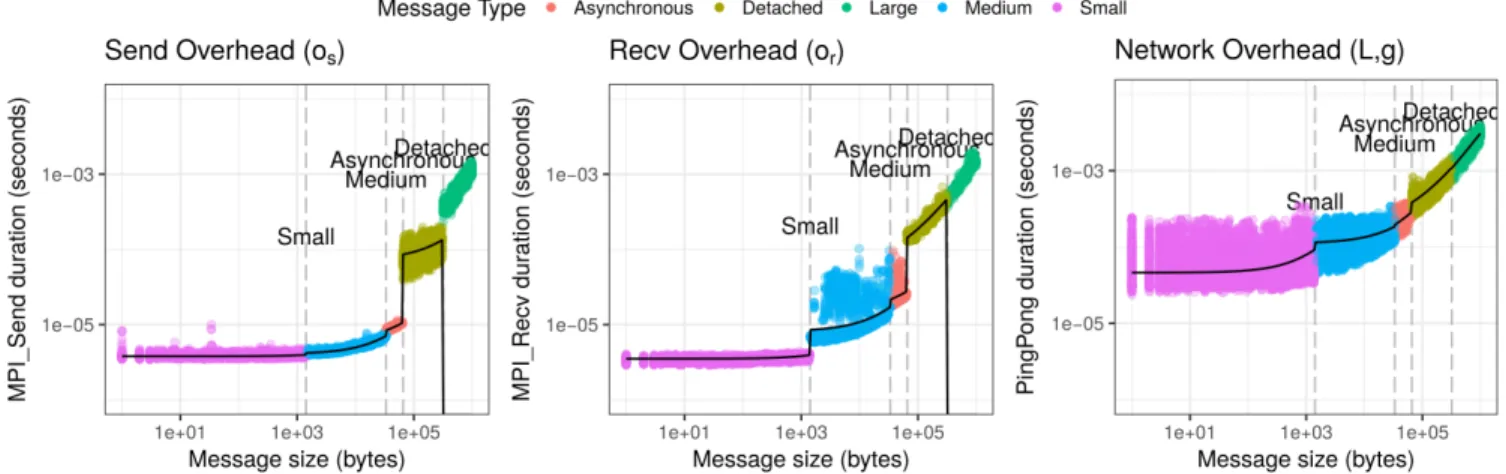
modeling. Figure 4 depicts an example for the Grid5000’s
Taurus cluster (OpenMPI 2.0.1, TCP, 10Gb Ethernet). We
depict the network modeling of the send overhead (left),
receive overhead (center), and the network latency and
band-width (right). Raw observations (points) and the piecewise
linear (the lines are bent because of the logarithmic scale)
regression calculated from them (black line) are plotted as
a function of the message size. The color indicates probable
changes in the communication protocols. The receive
oper-ation (blue area on the center plot) for the medium message
size has a much higher variability than for other message
sizes. The same happens, but with a different pattern, for
the send overhead (yellow on the left). In our case, since
sizes were randomized (instead of taking measurements in
an incremental order, as it is commonly done), we can safely
conclude that this variability is a real phenomenon and not
an artifact resulting from temporal perturbation.
IV. M
EMORY
H
IERARCHY
P
ERFORMANCE
M
ODELING
Our initial objective was to build upon the
Mul-tiMAPS benchmark. This benchmark is an upgraded version
of the MAPS benchmark, which itself is derived from
STREAM [23]. Figure 6 presents the pseudo-code of the
main algorithm behind MultiMAPS. It measures the time to
execute the
for
loop in which it makes consecutive memory
accesses (by stride) to an array of elements. At the end, it
computes the memory bandwidth. Two factors are expected
to affect such bandwidth estimation: the buffer size and the
access stride. Together, they somehow capture the temporal
and spatial locality behavior of the memory hierarchy.
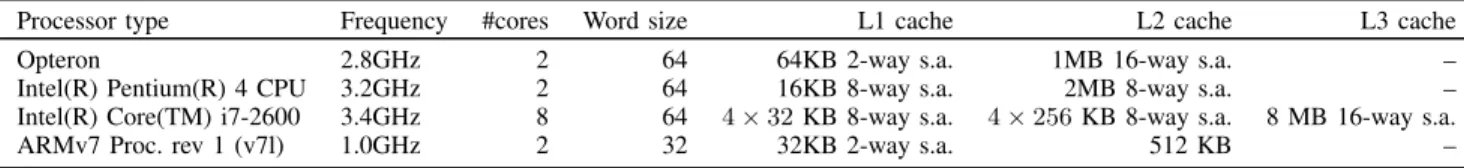
Processor type
Frequency
#cores
Word size
L1 cache
L2 cache
L3 cache
Opteron
2.8GHz
2
64
64KB 2-way s.a.
1MB 16-way s.a.
–
Intel(R) Pentium(R) 4 CPU
3.2GHz
2
64
16KB 8-way s.a.
2MB 8-way s.a.
–
Intel(R) Core(TM) i7-2600
3.4GHz
8
64
4 × 32 KB 8-way s.a.
4 × 256 KB 8-way s.a.
8 MB 16-way s.a.
ARMv7 Proc. rev 1 (v7l)
1.0GHz
2
32
32KB 2-way s.a.
512 KB
–
Figure 5.
Technical characteristics of the CPUs used in this study.
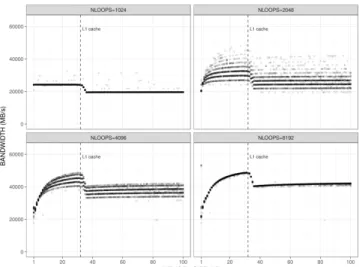
Figure 7 shows typical MultiMAPS results, in this case for
strides 2, 4, and 8 on an Opteron machine (see Figure 5 for
more details). As the size of the buffer increases, the memory
bandwidth decreases. Three plateaus directly correspond to
the L1 cache, L2 cache, and main memory sizes. Strides
have no impact when all accesses are done inside L1.
However, they play an important role when the array size
no longer fits in L1, since bandwidth is almost reduced by
a factor 2.
Such behavior seemed quite regular and sound so we
envisioned to directly use the MultiMAPS benchmark for
characterizing memory capabilities. Our goal was to improve
the SimGrid [8] processor model using an approach similar
to the one of the PMaC framework [22]. However, when
trying to reproduce this approach with recent hardware,
several unexpected difficulties forced us to change our initial
plan.
First, a closer inspection of the MultiMAPS code revealed
that it is much more complicated than the simple STREAM
benchmark on which it was based. Many parameters require
MultiMAPS(size, stride, nloops) {
allocate
buffer
[size];
timer_start();
for
rep
in
(1..nloops)
for
i
in
(0..size/stride)
access buffer
[stride*i]; // s = s+
buffer
[stride*i]
timer_stop();
bandwidth=(naccesses*sizeof(elements))/elapsed_time;
deallocate
buffer
;
}
Figure 6. Pseudo-code of the benchmark allowing to evaluate performance
in the different levels of the cache hierarchy.
Figure 7.
Excerpt from [22] exploiting the output of MultiMAPS and
illustrating the impact of the working set and of the stride on performance
of an Opteron. Performance drops when array exceeds 64KB and 1MB.
careful tuning, which is extremely hard without prior
knowl-edge of the benchmark and the machine it is running on. We
anticipated that we would have to modify many parts of the
benchmark to understand more deeply the performance on
modern architectures. A second issue was that the output
of the benchmark is very verbose and it is unclear how
the final plot is obtained from the measured data. Finally,
our initial results were far from the expected bandwidth
peaks, which was surprising as we thought that achieving
the maximal performance should be relatively easy with
such simple programs. Unfortunately, the benchmark only
reported aggregated values, without raw data to allow us to
better understand where the problem could come from.
Therefore, we decided to try to reproduce the essence
of the MultiMAPS approach, but with our own code. We
wrote our own benchmark script inspired by MultiMAPS,
trying to mimic the spirit of the reported experiments.
Although we aimed at studying all levels of the memory
hierarchy with parallel execution, we quickly discovered that
there is huge number of challenges even for the simplest
case. Consequently, we restrict our investigation report to
characterize solely L1 cache READ bandwidth, for a
single-threaded program.
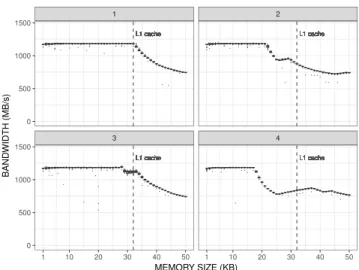
Building on our previous experience with network
mea-surements (see Section III), our first concern was to
thor-oughly randomize each parameter of the micro-kernel (stride
and size). Figure 8 shows the first experimental results on
a Pentium 4 CPU (see Figure 5 for more details). Each
dot represents one measurement (42 repetitions for each
configuration) of the bandwidth as a function of the buffer
size. The color indicates the stride, while the solid lines
rep-resent smoothed local regressions indicating measurement
Stride 2 Stride 4 Stride 8
![Figure 1. General approach proposed in the PMaC Framework [1]](https://thumb-eu.123doks.com/thumbv2/123doknet/14507623.529088/3.918.470.840.107.317/figure-general-approach-proposed-pmac-framework.webp)
![Figure 3. Time as a function of message size for different communication libraries using a Myrinet/GM network (taken from [20] as example).](https://thumb-eu.123doks.com/thumbv2/123doknet/14507623.529088/4.918.501.805.104.331/figure-function-message-different-communication-libraries-myrinet-network.webp)