HAL Id: hal-03044417
https://hal-amu.archives-ouvertes.fr/hal-03044417
Submitted on 7 Dec 2020
HAL is a multi-disciplinary open access
archive for the deposit and dissemination of
sci-entific research documents, whether they are
pub-lished or not. The documents may come from
teaching and research institutions in France or
abroad, or from public or private research centers.
L’archive ouverte pluridisciplinaire HAL, est
destinée au dépôt et à la diffusion de documents
scientifiques de niveau recherche, publiés ou non,
émanant des établissements d’enseignement et de
recherche français ou étrangers, des laboratoires
publics ou privés.
Distributed under a Creative Commons Attribution - NonCommercial| 4.0 International
input synchrony in local brain circuits
Mickaël Zbili, Sylvain Rama, Pierre Yger, Yanis Inglebert, Norah
Boumedine-Guignon, Laure Fronzaroli-Moliniere, Romain Brette, Michaël
Russier, Dominique Debanne
To cite this version:
Mickaël Zbili, Sylvain Rama, Pierre Yger, Yanis Inglebert, Norah Boumedine-Guignon, et al..
Ax-onal Na + channels detect and transmit levels of input synchrony in local brain circuits. Science
Advances , American Association for the Advancement of Science (AAAS), 2020, 6 (19), pp.eaay4313.
�10.1126/sciadv.aay4313�. �hal-03044417�
C E L L U L A R N E U R O S C I E N C E
Axonal Na
+
channels detect and transmit levels of input
synchrony in local brain circuits
Mickaël Zbili1*†, Sylvain Rama1*†, Pierre Yger2, Yanis Inglebert1, Norah Boumedine-Guignon1,
Laure Fronzaroli-Moliniere1, Romain Brette2, Michaël Russier1, Dominique Debanne1†
Sensory processing requires mechanisms of fast coincidence detection to discriminate synchronous from asyn-chronous inputs. Spike threshold adaptation enables such a discrimination but is ineffective in transmitting this information to the network. We show here that presynaptic axonal sodium channels read and transmit precise levels of input synchrony to the postsynaptic cell by modulating the presynaptic action potential (AP) amplitude. As a consequence, synaptic transmission is facilitated at cortical synapses when the presynaptic spike is produced by synchronous inputs. Using dual soma-axon recordings, imaging, and modeling, we show that this facilitation results from enhanced AP amplitude in the axon due to minimized inactivation of axonal sodium channels. Quan-tifying local circuit activity and using network modeling, we found that spikes induced by synchronous inputs produced a larger effect on network activity than spikes induced by asynchronous inputs. Therefore, this input synchrony–dependent facilitation may constitute a powerful mechanism, regulating synaptic transmission at proximal synapses.
INTRODUCTION
Higher brain function such as sensory processing or encoding of memory requires biological mechanisms to be able to discriminate highly synchronized inputs from weakly synchronized or asynchro-nous inputs with a temporal accuracy in the millisecond range (1–4). This property is classically thought to be achieved by mechanisms of coincidence detection occurring at the postsynaptic side such as activation of NMDA receptors at glutamatergic synapses (5), den-dritic amplification of synaptic responses (6), and spike threshold dynamics (7). Spike threshold adaptation represents the most accu-rate mechanism known for detection of fast input synchrony in central neurons (7–10). The spike threshold recorded in cortical neurons in vivo depends on the rate of depolarization and the na-ture of the stimulus (7, 11). For example, in the barrel cortex, the spike threshold is hyperpolarized for the preferred stimulus and de-polarized for the nonpreferred stimulus (11). Theoretical work has
underlined the importance of Na+ channel inactivation in the
adap-tation of spike threshold (9, 12). However, it is not known whether the readout of input synchrony by adaptation of spike threshold can be transmitted within the network. This amounts to asking the question: Does an action potential (AP) produced by synchronous inputs convey more information than a spike produced by asyn-chronous inputs? Axonal ion channels have been shown to deter-mine presynaptic spike waveform and hence synaptic transmission in a context-dependent manner that corresponds to analog-digital modulation of synaptic strength (13–18). We therefore examined whether levels of input synchrony could be read and transmitted through the network by axonal channels.
We show here that axonal sodium channels detect levels of input synchrony with millisecond precision and transmit this informa-tion to the network through modulainforma-tion of AP amplitude and
presynaptic release. Synaptic transmission is facilitated at cortical connections when the presynaptic AP is produced by synchronous inputs. Using dual soma-axon recordings, calcium imaging, and computer modeling, we show that this facilitation results from the enhancement of axonal spike amplitude caused by minimized inac-tivation of axonal sodium channels. In addition, we reveal that syn-chronous input-mediated spikes provoke a larger increase in local circuit activity than asynchronous input-mediated spikes. This sug-gests that this form of context-dependent enhancement of synaptic transmission may represent a robust way for information coding. RESULTS
Input synchrony–dependent facilitation
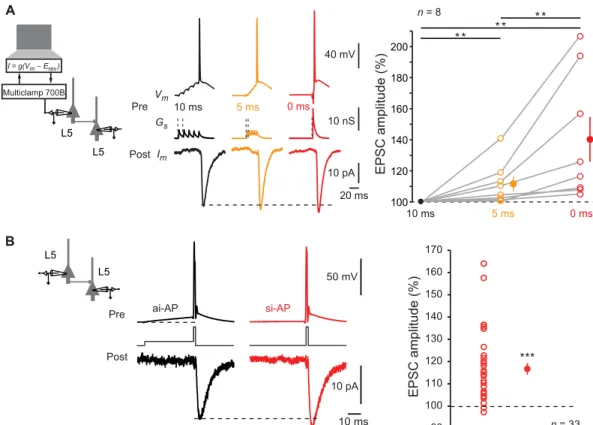
Pairs of monosynaptically connected L5 pyramidal neurons were recorded in acute slices of P13-49 rats. The effect of synchronous activation on synaptic transmission was tested by injecting AMPA- like excitatory presynaptic potentials (EPreSPs) into the presynaptic neuron using dynamic clamp. Postsynaptic responses were found to be larger when the presynaptic AP was produced by highly syn-chronized inputs (0-ms delay between inputs) than when elicited by intermediate (5-ms delay) or weakly synchronous (10-ms delay) inputs (140 ± 14%, n = 8; Wilcoxon test, P < 0.01; Friedman-test,
P < 0.01; Fig. 1A). Therefore, the synchrony level of the inputs
determines output synaptic strength. We named this phenomenon input synchrony–dependent facilitation (ISF). As previously re-ported, the AP threshold of the presynaptic neuron was found to be lower as EPreSP synchrony increased (fig. S1).
ISF could also be induced by a simple protocol based on two ways of inducing the presynaptic AP (i.e., directly from resting po-tential to mimic synchronous inputs or after a 50-ms depolarizing prepulse to mimic asynchronous inputs). Each stimulation type was evoked in alternation. Consistent with our preceding results (Fig. 1A), APs emitted by a synchronous-like input (si-APs) pro-duced larger postsynaptic responses than APs emitted by asynchronous- like input (ai-APs) (117 ± 3%, n = 33; Wilcoxon test, P < 0.001; Fig. 1B). During ISF, the EPSC2/EPSC1 ratio diminished (from
1UNIS, INSERM, UMR 1072, Aix-Marseille Université, 13015, Marseille, France. 2Sorbonne Université, INSERM, CNRS, Institut de la Vision, 75012 Paris, France.
*These authors contributed equally to this work.
†Corresponding author. Email: dominique.debanne@inserm.fr (D.D.); zbili.mickael@ gmail.com (M.Z.); rama.sylvain@gmail.com (S.R.)
Copyright © 2020 The Authors, some rights reserved; exclusive licensee American Association for the Advancement of Science. No claim to original U.S. Government Works. Distributed under a Creative Commons Attribution NonCommercial License 4.0 (CC BY-NC). on May 7, 2020 http://advances.sciencemag.org/ Downloaded from
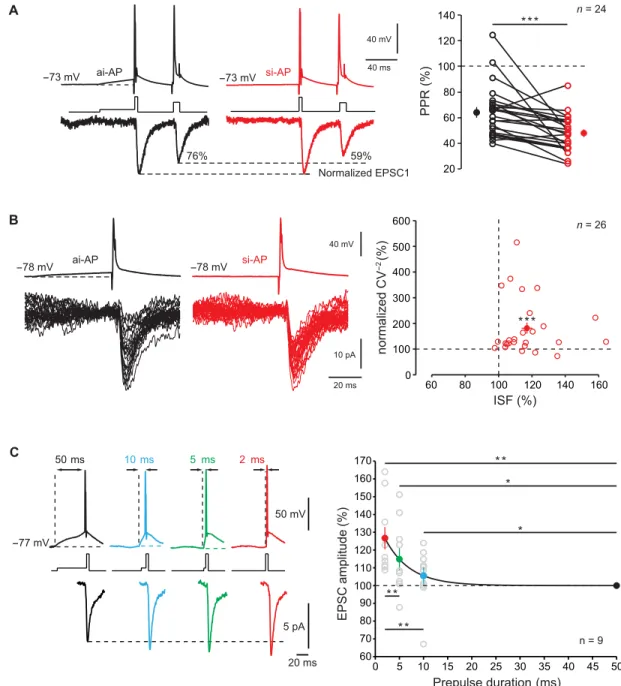
64 ± 4% to 47 ± 3%, n = 24; Wilcoxon test, P < 0.001; Fig. 2A), and
the CV−2 of EPSC amplitude increased (181 ± 22% of the control,
n = 26; Wilcoxon test, P < 0.001; Fig. 2B), indicating the presynaptic
origin of ISF. Magnitude of ISF was not related to age (fig. S2A) but followed an inverse function of synaptic strength (fig. S2B). ISF was also observed at local excitatory synapses in area CA3 of the hippo-campus (117 ± 3% of the control EPSC, n = 20; fig. S2C), indicating that ISF may be a general feature in excitatory brain circuits.
We next determined the time course of ISF by measuring ISF magnitude as a function of the pre-pulse duration (PD). Presynap-tic spikes were induced following depolarizations ranging between 50 and 2 ms (corresponding to input synchrony increase), and the resulting postsynaptic responses were recorded. ISF magnitude fol-lowed an exponential decay with increasing PD (time constant of 5.1 ms; Fig. 2C). Synaptic facilitation observed with a PD of 2 ms was found to be substantially larger than that observed for a PD of 5 ms (Wilcoxon test, P < 0.01). We conclude that ISF is highly time discriminative.
Mechanisms of ISF: Modulation of axonal spike amplitude
Since ISF has a presynaptic origin, we examined whether ISF was
associated with an elevation in presynaptic Ca2+ influx. L5 neurons
were recorded with a pipette filled with 50 M Alexa Fluor 594 and 250
M Fluo-4, and spike-evoked Ca2+ signals were measured in putative en
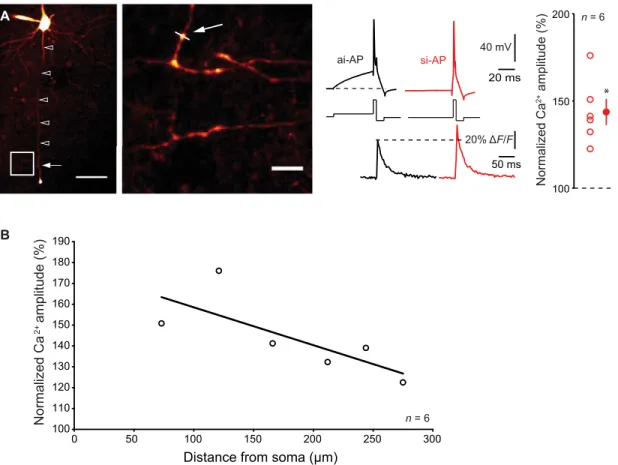
passant boutons (Fig. 3A). The amplitude of the spike-evoked Ca2+
transient was increased when the spike was evoked by a synchronous- like input (144 ± 8%, n = 6, Wilcoxon test, P < 0.05; Fig. 3A). The
ratio between si-AP–evoked Ca2+ entry and ai-AP–evoked Ca2+
en-try declined with the distance from the soma with a space constant of 232 m (Fig. 3B), a value compatible with previous estimation of axonal space constant (14, 15).
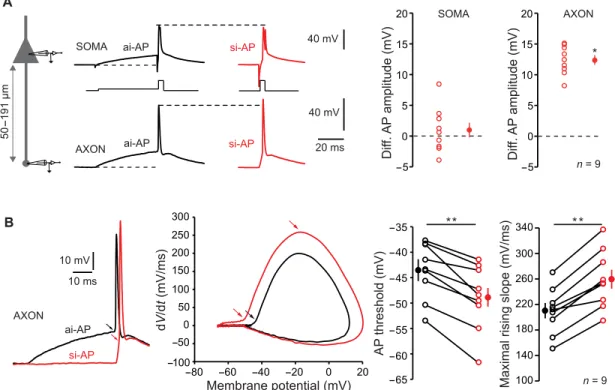
To examine the presynaptic spike shape, L5 neurons were re-corded simultaneously from the soma with a pipette filled with Alexa 488 (50 M) to visualize the axon and from the axon cut end (i.e., bleb) at distances ranging from 50 to 191 m (mean, 92 ± 19 m;
n = 9). The subthreshold depolarization attenuated along the axon
according to an exponential decay with a space constant of 360 m
(fig. S3A). In accordance with the increased Ca2+ influx during ISF,
amplitude of si-AP was found to be increased in the axon (by 12.4 ± 0.8 mV, n = 9; Wilcoxon test, P < 0.05; Fig. 4A) but not in the soma (difference, 1.0 ± 1.2 mV; n = 9; Wilcoxon test, P > 0.1). More-over, the axonal spike amplitude followed an exponential decay as a function of PD that is similar to the decay of synaptic strength found in Fig. 1C (time constant of 4.0 ms; fig. S3B). However, the half-width of the axonal si-AP was not notably broader than the ai-AP (105 ± 3%, n = 8; Wilcoxon test, P > 0.1; fig. S3C). The spike threshold measured in the axon was hyperpolarized by ~4 mV during ISF (from −43.5 ± 1.8 to −48.9 ± 2.2 mV, n = 9; Wilcoxon B L5 L5 EPSC amplitude (%) 100 110 120 130 140 150 160 170 90 50 mV 10 ms EPSC amplitude (%) 100 120 140 160 180 200 20 ms 10 ms 40 mV 10 nS Vm Gs Im 0 ms 5 ms 10 pA A Pre Post Multiclamp 700B L5 L5 Pre Post 10 pA 10 ms 5 ms 0 ms ai-AP si-AP *** * * ** ** n = 33 n = 8 I = g(Vm− Erev)
Fig. 1. ISF at L5-L5 synapses. (A) Induction of ISF with physiological stimuli. Left: Schematic representation of the system used to inject a dynamic current mimicking five glutamatergic inputs into the presynaptic neuron. Middle: Examples of electrophysiological recordings from a connected pair of L5 neurons. The five EPreSGs were injected with a delay of 10 ms (black traces), 5 ms (orange traces), or synchronously (red traces). Note the increase in the postsynaptic response amplitude with the increase in EPreSGs synchrony. Resting membrane potential of the presynaptic neuron: −78 mV. Right: Statistics (open circles, individual pairs; closed circles, averages). Willcoxon test, **P < 0.01. (B) Induction of ISF with current pulses. The presynaptic AP was induced by a brief step of current with or without preceding 50-ms prepulse to mimic weakly synchronized or highly synchronized inputs, respectively. Note the increased excitatory postsynaptic current (EPSC) amplitude induced by a presynaptic AP induced by a synchronous-like input (si-AP) compared to that produced by an asynchronous-like input (ai-AP). Resting membrane potential of the presynaptic neuron: −77 mV. Right: Plot of ISF observed in 33 cell pairs. Wilcoxon test, ***P < 0.001.
on May 7, 2020
http://advances.sciencemag.org/
test, P < 0.01; Fig. 4B), and the maximal slope of the rising phase of the spike was increased (from 210 ± 12 to 259 ± 15 mV/ms; n = 9; Wilcoxon test, P < 0.01; Fig. 4B), indicating that voltage-dependent sodium (Nav) channel inactivation is minimized when the spike is induced by synchronous inputs. Together, these data indicate that modulation of spike amplitude is at the origin of ISF through a
Ca2+-dependent mechanism (19).
Role of sodium channel inactivation
The differential sensitivity of the spike amplitude in the axonal and the somatic compartment to depolarization may result from the
dif-ference in Nav channel inactivation in these two compartments. Ax-onal Nav channels display a hyperpolarized inactivation curve (half inactivation of −80 mV) and are highly sensitive to inactivation by subthreshold depolarization (20). We used a NEURON model of a fully reconstructed L5 neuron (20) to determine the role of axonal Nav channel inactivation in ISF. Synaptic conductance was injected in the soma in the form of five inputs whose delay varied between 0 and 10 ms to simulate different input synchrony. Presynaptic Nav
channel inactivation, spike-evoked Na+ current, and AP overshoot
were measured under each condition in the presynaptic terminal located at 150 m from the soma. Increased input synchrony leads C EPSC amplitude (%) Prepulse duration (ms) 60 70 80 90 100 110 120 130 140 150 160 170 0 5 10 15 20 25 30 35 40 45 50 * * * * * 50 mV 5 pA 20 ms 2 ms 5 ms 10 ms 50 ms * * * B normalized CV -2 (%) 0 100 200 300 400 500 600 ISF (%) 40 mV 20 ms 10 pA ai-AP si-AP 60 80 100 120 140 160 40 ms 40 mV ai-AP si-AP 76% 59% Normalized EPSC1 A PPR (%) 20 40 60 80 100 120 140 * ** * * * n = 24 n = 26 n = 9 -73 mV -78 mV -78 mV -73 mV -77 mV
Fig. 2. Properties of ISF. (A) Reduced EPSC2/EPSC1 ratio after ISF. Left traces, paired-pulse ratio (PPR) with an asynchronous-like weak (black) and synchronous-like (red) input. Note the decrease in EPSC2/EPSC1 ratio (here from 76 to 59%). Right: Group data (Wilcoxon test, ***P < 0.001). (B) Reduced EPSC variability during ISF. Left: Examples of 30 EPSCs evoked by an asynchronous- like (back) or synchronous-like (red) input. Right: Plot of normalized CV−2 as a function of ISF (Wilcoxon test, ***P < 0.001). (C) Time
course of ISF. Presynaptic spikes were evoked with prepulse duration (PD) ranging from 50 to 2 ms. Note that evoked postsynaptic responses increased when the PD decreased. Right: Plot of EPSC amplitude normalized to that produced by a PD of 50 ms (black line, exponential regression y = 39.6 * e−x/ + 99.98 with = 5.1 ms; R2 = 0.3)
Wilcoxon test, *P < 0.05, **P < 0.01.
on May 7, 2020
http://advances.sciencemag.org/
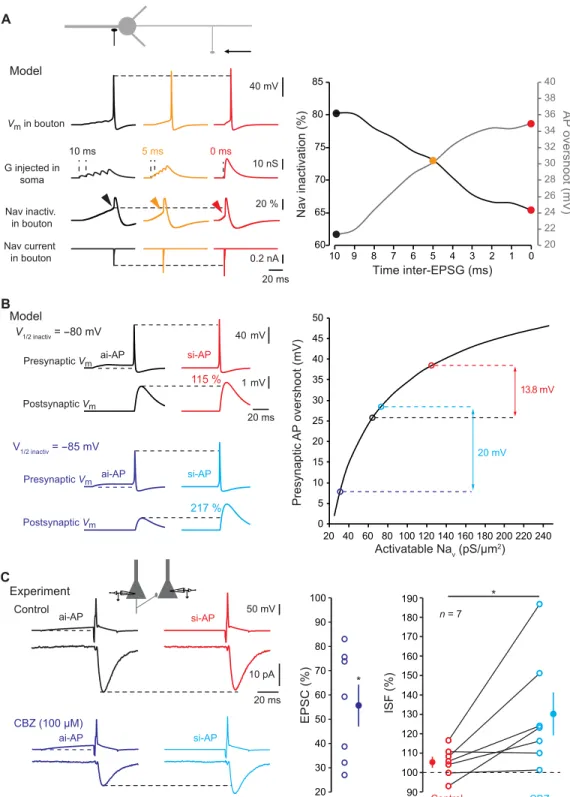
to a decrease in Nav channel inactivation and therefore to larger Na+ current and spike overshoot (Fig. 5A). Next, we used the model of an L5 neuron connected to a postsynaptic cell by a synapse to deter-mine the incidence of Nav channel availability on ISF. In agreement with the experiments, a si-AP had a larger amplitude and evoked a larger postsynaptic response than an ai-AP in control conditions [i.e., when half inactivation of axonal Nav channels was set to −80 mV (20); Fig. 5B]. The difference between si-AP and ai-AP amplitude was enhanced if inactivation of axonal Nav channels was increased by hyperpolarizing their basal inactivation curve (half inactivation at −85 mV; Fig. 5B), leading to enhanced ISF. We verified experi-mentally the model prediction by using carbamazepine (CBZ; 100 M), an anti-epileptic drug that hyperpolarizes Nav half-inactivation by ~6 mV (21, 22). In L5 connections, addition of CBZ reduced synap-tic transmission to 56 ± 9% of the control amplitude (n = 7; Wilcoxon test, P < 0.05; Fig. 5C) and increased the magnitude of ISF by 23 ± 8% (n = 7; Wilcoxon test, P < 0.05; Fig. 5C). Thus, hyperpolar-izing Nav half-inactivation by CBZ enhances ISF possibly through the increase of the dynamic range of the axonal AP amplitude.
To confirm the effect of changing Nav channel availability on ISF in the model, we next reduced the density of Nav channels in the
axon from 300 to 150 pS/m2 while keeping all other parameters
constant. In this condition, ISF was enhanced from 116 to 165%
(fig. S4A). We tested experimentally the second prediction of the model by partially blocking Nav channels with a low concentration of tetrodotoxin (TTX; 20 to 40 nM). TTX reduced synaptic transmission to 75 ± 9% of the control value (n = 7; fig. S4B) and increased ISF by 10 ± 2% (n = 7; Wilcoxon test, P < 0.05). We conclude that ISF results from the minimization of Nav channel inactivation by synchronous inputs that, in turn, leads to the in-crease in presynaptic AP amplitude, calcium influx, and glutamate release.
ISF induced in a single neuron affects network activity
Next, we tested whether ISF triggered in a single neuron had a sub-stantial impact on spontaneous activity in cortical circuits. For this, we approached the physiological conditions of extracellular calcium [i.e., 1.3 mM external calcium instead of 3 mM (23, 24)]. First, we measured the effect of reducing external calcium on ISF. We found that decreasing extracellular calcium concentration from 3 to 1.3 mM decreased synaptic strength (to 40 ± 8% of the control EPSC, n = 8; Wilcoxon test, P < 0.01) but increased ISF amplitude (from 106 ± 4% to 118 ± 6%, n = 8; Wilcoxon test, P < 0.01; fig. S5, A and B). In a second step, paired recordings from adjacent L5 pyramidal neurons were obtained, and a spike was elicited in one of the two cells. The spontaneous activity was measured in the nonspiking cell by counting
20 ms 50 ms A 40 mV 20% ∆F/F ai-AP si-AP B 100 110 120 130 140 150 160 170 180 190 0 50 100 150 200 250 300 Normalized Ca 2+ amplitude (%)
Distance from soma (µm)
n = 6 100 150 200 n = 6 Normalized Ca 2+ amplitude (%) *
Fig. 3. Ca2+ imaging. (A) Left: Ensemble view and detail of axonal arborization of an L5 pyramidal neuron filled with Alexa 594 and Fluo-4. The white arrow indicates the line scan made at ~200 m from the cell body. Scale bars, 50 and 5 m. Middle traces: Simultaneous electrophysiological (top) and Ca2+ imaging (bottom) recordings
during ISF. Note the increase in Ca2+ fluorescence when the spike is evoked by a synchronous-like input compared with a spike evoked by an asynchronous-like input.
Resting membrane potential: −76 mV. Right: Normalized amplitude of the spike-evoked Ca2+ signal (Wilcoxon test, *P < 0.05). (B) Attenuation of the enhanced
spike-evoked Ca2+ influx produced by si-APs along the axon. Plot of the normalized amplitude of Ca2+ signal as a function of the distance from the soma. The data have been
fitted with an exponential regression (y = 89.6 * e−x/ + 100, with = 232 m, R2 = 0.65).
on May 7, 2020
http://advances.sciencemag.org/
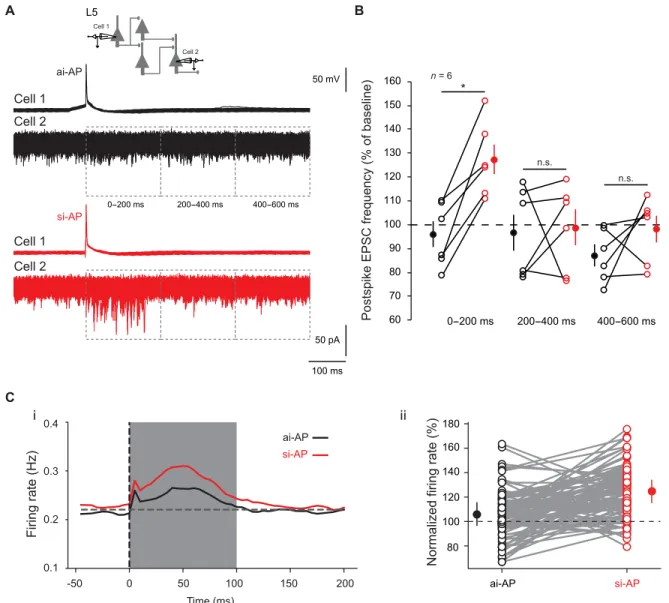
the number of postsynaptic events occurring 200 ms before the spike and 200 ms after the spike (Fig. 6A). To verify the integrity of the axon, neurons were filled with Alexa 488, and recordings from cells with damaged axons were rejected. We found that sponta-neous activity in the nonspiking cell increased during the first 200 ms following a si-AP but not after an ai-AP (127 ± 6% versus 96 ± 5%, n = 6; Wilcoxon test, P < 0.03; Fig. 6B). We conclude that ISF induced in a single neuron substantially affects spontaneous activity in local cortical circuits, suggesting that transmission of input synchrony through ISF would represent a robust way for information coding.
To confirm this result, we used a computational approach. We built a network model made of 4000 excitatory cells and 1000 inhib-itory cells randomly connected with a probability of 10%. Neurons present a low spiking activity around 0.2 Hz (fig. S5C). The network was balanced for excitatory and inhibitory synaptic weights (see Materials and Methods for details; fig. S5, D to H). We reproduced the protocol used in the experiments to check the effect of ISF on the network. One excitatory neuron was randomly chosen and was forced to fire one extra spike. To model a si-AP, EPSPs induced by this extra spike were increased by 30% in target neurons. For an ai-AP, EPSPs were left unchanged. The spiking rate of the network was measured 100 ms before and 100 ms after the extra spike. This pro-tocol was repeated for 100 ai-APs and 100 si-APs for a given neu-ron, and results over five random networks were averaged. Overall, we found that an ai-AP produced, on average, an increase of 8.7% of the network spiking activity, while a si-AP induced, on average, an
increase of 25.2% (t test, P < 0.00001; Fig. 6C). This result confirms our experimental observation that ISF induced in a single neuron can affect local circuit activity.
DISCUSSION
We show here that sodium channels read and transmit levels of input synchrony with a high temporal precision to local cortical circuits through the modification of presynaptic AP amplitude. Synaptic transmission was found to be facilitated at L5-L5 or at CA3-CA3 connections when the presynaptic AP was triggered by highly synchronous inputs or by a short pulse of current that produced in all cases a steep depolarization from resting membrane potential. Using dual soma-axon recordings, calcium imaging, pharmacological tools, and computer modeling, we demonstrate that this facilitation results from an elevation in presynaptic calcium due to the enhancement of axonal spike amplitude caused by minimized inactivation of axonal Nav channels. This ISF was found to enhance local circuit activity, suggesting that it may represent a robust way of transmitting synchrony in the brain.
So far, spike threshold adaptation reported in cortical neurons was thought to represent the most accurate mechanism for detec-tion of fast input synchrony in central neurons (7–10). We suggest here that it may represent only the first visible step of a longer process because spike threshold dynamics appears to be only an indicator of Nav channel inactivation in the presynaptic cell, and the consequences on the network can only be evaluated by paired A 40 mV 40 mV 20 ms SOMA AXON ai-AP si-AP ai-AP si-AP * Dif f. AP amplitude (mV) AXON -5 0 5 10 15 20 SOMA -5 0 5 10 15 20 Dif f. AP amplitude (mV) B n = 9 50 -191 µm -100 -50 0 50 100 150 200 250 -80 -60 -40 -20 0 Membrane potential (mV) dV /d t (mV/ms) 100 140 180 220 260 300 340
Maximal rising slope (mV/ms)
** n = 9 -65 -60 -55 -50 -45 -40 -35 AP threshold (mV) ** 10 ms 10 mV AXON ai-AP si-AP 20 300
Fig. 4. Modulation of axonal spike amplitude. (A) ISF is associated with a modulation of axonal spike amplitude. Left: Recording configuration. Simultaneous whole-cell recordings from the soma and cut end axon in L5 pyramidal cells were obtained. Middle: Comparison of somatic and axonal AP amplitudes evoked by asynchronous-like (black traces) and synchronous-like (red traces) inputs. Note the increased amplitude in the axon but not in the soma. Resting membrane potential: −78 mV. Right: Quantitative data (Wilcoxon test, *P < 0.05). (B) Hyperpolarization of spike threshold and increase in the slope of the spike rising-phase during ISF (Wilcoxon test, **P < 0.01). Left: Comparison of axonal spikes induced by asynchronous and synchronous inputs. Resting membrane potential: −80 mV. Middle: Phase-plot of the APs. Note the hyperpolarization of the threshold during and the increase of maximal slope during ISF. Right: Quantitative data.
on May 7, 2020
http://advances.sciencemag.org/
13.8 mV 20 mV Activatable Nav (pS/µm2) Presynaptic AP overshoot (mV) B 40 mV 1 mV 20 ms ai-AP si-AP Presynaptic Vm Postsynaptic Vm V1/2 inactiv = -85 mV si-AP ai-AP Presynaptic Vm Postsynaptic Vm 217 % 115 % Model V1/2 inactiv = -80 mV A Model Time inter-EPSG (ms) Nav inactivation (%) 20 22 24 26 28 30 32 34 36 38 40 0 1 2 3 4 5 6 7 8 9 10 AP overshoot (mV) 60 65 70 75 80 85 Nav current in bouton Nav inactiv. in bouton 40 mV 20 % 0.2 nA 20 ms Vm in bouton 10 nS G injected in soma 10 ms 5 ms 0 ms EPSC (%) 50 mV 10 pA 20 ms ai-AP si-AP ai-AP si-AP Control CBZ (100 µM) 20 30 40 50 60 70 80 90 100 C ISF (%) Control CBZ 90 100 110 120 130 140 150 160 170 180 190 * Experiment * n = 7 0 5 10 15 20 25 30 35 40 45 50 20 40 60 80 100 120 140 160 180 200 220 240
Fig. 5. Minimization of Nav channel inactivation. (A) Reduced Nav channel inactivation during ISF in a model L5 pyramidal cell. Left: Voltage (top line), Nav channel
inactivation (middle line), and presynaptic Na+ current (bottom line) traces for asynchronous (black), intermediate (orange), or synchronous (red) inputs. Note the increase
in spike and Nav current amplitude and the decreased Nav channel inactivation measured before the spike. Resting membrane potential of the presynaptic bouton: −78 mV.
Right: Plot of presynaptic Nav channel inactivation and presynaptic spike overshoot as a function of synaptic input synchrony. (B) Increasing presynaptic Nav channel
inactivation enhances ISF in a Hodgkin-Huxley model of an L5-L5 connection. Top left: Control conditions (V1/2 inactiv = −80 mV). A presynaptic AP evoked by a synchronous
input is 13.8 mV larger than that produced by an asynchronous input. This larger presynaptic spike produces a larger EPSP (ISF = 115%). Bottom left: Test conditions (V1/2 inactiv = −85 mV). Because Nav channel inactivation is larger, the modulation of presynaptic spike amplitude (20 mV) and ISF (217%) is enhanced. Resting membrane
potential of the presynaptic bouton: −78 mV. Right: Plot of the amplitude of presynaptic spike overshoot as a function of Nav channel availability. (C) Experimental verification
of the role of Nav channel inactivation during ISF. Top left: Example of L5 connection showing no ISF in control conditions. Bottom left: Same connection in the presence
of carbamazepine (CBZ). The evoked EPSC is ~40% smaller and ISF is now clearly visible. Resting membrane potential of the presynaptic neuron: −83 mV. Middle: Plot of EPSC reduction caused by CBZ. Right: Plot of ISF in control (red) and in the presence of CBZ (light blue). Wilcoxon test, *P < 0.05.
on May 7, 2020
http://advances.sciencemag.org/
intracellular recording from connected neurons, a particular challenging technique in vivo. The most important consequence of input synchrony–dependent adaptation in spike threshold is an enhancement of presynaptic release caused by modification of presynaptic spike amplitude. As a consequence, input synchrony increases both cell excitability by lowering the spike threshold and synaptic transmission via the enhancement of the spike amplitude in the axon.
An AP evoked by synchronous AMPA-like synaptic inputs (0-ms delay) produced a larger postsynaptic response than an AP evoked by asynchronous AMPA-like synaptic inputs (5- or 10-ms delay between inputs). We have not tested in this study the impact of dendritic input location on ISF. However, one can expect that asyn-chronous distal inputs, which present slower rise time and decay
time, may maximize both the duration and magnitude of depolar-ization preceding spike emission. This should lead to a greater amount of Nav inactivation and a larger decrease of spike overshoot and synaptic release. Therefore, distal inputs may provoke larger ISF than proximal ones.
Synaptic change during ISF was found to vary from no change to +70% at L5-L5 connections. This variation can be attributed to the size of unitary connection as ISF follows an inverse function of EPSC size (fig. S2B). However, one cannot exclude the contribution of the axonal length that can also vary from connection to connec-tion and that may attenuate propagaconnec-tion of voltage along the axon. The contribution of axonal Nav channels in input synchrony– dependent change in presynaptic release is shown by four lines of evidence. First, whole-cell recording from the axon showed that the C i ii si-AP ai-AP si-AP ai-AP Firing rate (Hz) 0.4 0.3 0.2
0.1 Normalized firing rate (%
) 80 100 120 140 160 180 50 100 150 200 -50 0 Time (ms) A B Cell 1 Cell 2 L5 n = 6
Postspike EPSC frequency (% of baseline)
* 60 70 80 90 100 110 120 130 140 150 160 n.s. n.s. 0-200 ms 200-400 ms 400-600 ms 50 mV 100 ms 50 pA ai-AP si-AP Cell 1 Cell 2 Cell 1 Cell 2 0-200 ms 200-400 ms 400-600 ms
Fig. 6. Effects of ISF on network activity. (A) Incidence of ISF on cortical network activity. Spontaneous activity was measured in cell 2 before and after the spike triggered in cell 1 and the event frequency after spike was normalized to that measured 200 ms before the spike. Black traces, no change in network activity is induced by ai-APs. Red traces, transient increase in network activity induced by si-APs (127%). (B) Plots of normalized EPSC frequency triggered by ai-APs (black circles) and by si-APs (red circles) in different time windows (0 to 200, 200 to 400, and 400 to 600 ms). Note that the increase in network activity induced by si-APs is limited to the first 200-ms postspike. Wilcoxon test, *P < 0.05, n.s., not significant. (C) Effect of ISF in a balanced network model. (i) Averaged firing rate (over 100 repeats on 100 neurons and over five networks) just before and after the injection of an ai-AP spike (black curve) and a si-AP spike (red curve). (ii) Individual normalized changes in spiking activity, for the 100 neurons in a given network, when injecting an ai-AP (black) and a si-AP (red).
on May 7, 2020
http://advances.sciencemag.org/
spike amplitude in the axonal compartment was highly modulated. In particular, the maximal slope of the rising phase of the spike was increased. Second, computer simulation showed that Nav channel inactivation caused by subthreshold depolarization preceding the spike decreased substantially when input synchrony increased. Third, enhancement of Nav channel inactivation by CBZ was found to enhance the magnitude of ISF. Last, reduction of Nav channel availability by TTX increased ISF. The implication of Nav channels had been shown in another context-dependent enhancement of synaptic transmission that depends on presynaptic hyperpolariza-tion (17). This facilitahyperpolariza-tion was due to recovery of axonal sodium channels from inactivation. Therefore, availability of presynaptic Nav channels represents a major determinant of synaptic transmis-sion at local excitatory connections. ISF relies on inactivation of axonal Nav channels. Several studies report that axonal Nav chan-nels display a more hyperpolarized inactivation curve than somatic Nav channels. Nav1.6 channels are present in the axon from the AIS to synaptic terminals, while Nav1.2 channels are present in the somato-dendritic region of the neuron including the proximal region of the AIS (20). Inactivation of sodium channels found in the soma (i.e., Nav1.2) is ~15 mV more depolarized than sodium channels found in the axon (Nav1.6). An accessory channel subunit of Nav channels, A-type fibroblast growth factor homologous factor (FHF), is specifically localized in the proximal part of the axon and could be responsible for this difference. FHF shifts Nav channel inactivation by ~15 mV in the depolarized direction (25, 26). The hyperpolar-ized inactivation curve of axonal Nav channels makes them more sensitive to subthreshold variations of membrane potential and therefore more suited to underlie ISF.
The modification of release we report here is due to a Nav channel– dependent enhancement of presynaptic AP amplitude and calcium influx. The fact that increasing presynaptic spike amplitude enhances calcium entry and neurotransmitter release has been shown in many axon types. For example, in cultured hippocampal neurons, voltage imaging of presynaptic boutons indicates that APs display a very small overshoot (27), a condition favorable for the modulation
of Ca2+ entry by changes in AP amplitude. Moreover, voltage-clamp
recordings from presynaptic boutons in cerebellar cultured neurons show that enhanced spike amplitude results in larger presynaptic
Ca2+ currents and in enhanced release (19). In addition, partial
blockade of Nav channels with low concentration of TTX reduces both AP amplitude and synaptic release in connected pairs of L5 pyramidal neurons (28). To optimize detection of small unitary synaptic currents, external calcium concentration was elevated to 3 mM under our control conditions. Under these conditions, release probability is already high, and upward modulations of axonal Nav spike and calcium entry may probably not produce a large increase in glutamate release. Supporting this view, when release probability was reduced by recording L5-L5 connection in 1.3 mM external calcium, ISF was found to be enhanced.
ISF enters into the group of context-dependent modifications of synaptic release that depends on axonal ion channels. To date, three following types have been identified: (i) a Kv1 channel–dependent form of synaptic facilitation induced by long presynaptic depolar-izations preceding the presynaptic AP (14, 15, 29, 30), (ii) a Cav2.1
channel–dependent accumulation of presynaptic Ca2+ induced by
slow presynaptic depolarizations that facilitates presynaptic release in short cerebellar axons (31, 32), and (iii) a Nav-dependent facilita-tion induced by a short presynaptic hyperpolarizafacilita-tion (17). Among
these context-dependent modifications of synaptic transmission, only the last one may have a substantial impact on the activity of fast cortical circuits, the two other processes being too slow and proba-bly involved in slower network activity (14, 15, 29, 30). While both ISF and Kv1-dependent modulation of synaptic release are ob-served on the same synapses, their respective time windows are dis-tinct (in the millisecond range for ISF and in the second range for Kv1-dependent modulation). In addition, Kv1-dependent tion induced by a long depolarization and Nav-dependent facilita-tion induced by transient hyperpolarizafacilita-tion have been shown to be additive (17).
From a functional point of view, ISF can be seen as a time coding process in which APs elicited with a short latency would produce stronger responses than those induced with a long latency. Theoret-ical work suggests that coding based on absolute spike time is by far the most powerful because of its high capacity for information transfer compared to rate coding or rank coding (33). In addition, several experimental studies indicate that the precise timing of the first spike carries critical information about the stimulus in sensory responses (34–37). Our data indicate that ISF conveys presynaptic spike timing information to the postsynaptic cell with high tempo-ral precision and thus provides strong biological support for time coding based on spike latency at cortical synapses (33, 38). ISF de-fines a rule in which highly relevant neuronal information comes early and is transmitted in the circuit, while poorly relevant infor-mation comes later and is filtered. This rule is reminiscent of the principle governing the release-dependent variation in synaptic delay at unitary L5-L5 synapses where large synaptic responses dis-play the shortest synaptic delays and small responses, the longest ones (39).
Does ISF also occur in vivo? Although a direct answer to this question is technically extremely challenging, we assume that this might be the case. Visually evoked inputs differentially inactivate Nav channels and therefore highly modulate spike threshold in pri-mary visual cortical neurons (7). In the barrel cortex, preferred di-rection elicits steeper EPSPs that, in turn, evoke spikes with a lower threshold (11). Thus, spikes evoked by highly synchronous inputs (or fast rates of depolarization) are likely to better transmit infor-mation in the network than spikes evoked by weakly synchronous inputs (or slow rates of depolarization). Our experimental results show that this might be the case. Spikes elicited by synchronous-like inputs have a stronger impact on network activity compared to spikes elicited by asynchronous-like inputs.
The magnitude of ISF reported in the present study is relatively modest (20 to 40%). There are, however, good reasons to believe that ISF could be substantially larger in vivo. First, we show that ISF
is notably enhanced in physiological extracellular Ca2+. Second,
the presence of neuromodulators such as acetylcholine may promote ISF. Acetylcholine specifically depolarizes axon membrane potential by blocking Kv7 channels (40) and reduces sodium current (41), which should increase ISF (see TTX experiment, fig. S6). In addi-tion, spike threshold adaptation (the prerequisite for ISF) has been reported in at least three independent in vivo studies (7, 10, 11). In addition, ISF might be larger at 37°C than at 30°C (experimental temperature) mainly because as kinetics is faster, sodium channels would be fully inactivated when an ai-AP is generated. Although ISF is present in mature cortical neurons (P42-P49), the contribu-tion of ISF to network dynamics might be even larger during early development. The low density of Nav channels, together with the
on May 7, 2020
http://advances.sciencemag.org/
slow kinetics of EPSPs observed during development, represents two factors that may optimize ISF. Further experimental investiga-tions will be needed to determine the importance of ISF in the cor-tex in vivo.
MATERIALS AND METHODS Acute slices of rat neocortex
Our experiments were conducted according to the European and Institutional guidelines [Council Directive 86/609/EEC and French National Research Council and approved by the local health au-thority (Préfecture des Bouches-du-Rhône, Marseille)]. Neocortical slices (350 to 400 m) were obtained from 14- to 49-day-old Wistar rats of both sexes. Rats were deeply anesthetized with chloral hy-drate (intraperitoneal, 200 mg/kg) and killed by decapitation. For animals older than P40, rats were deeply anesthetized with isoflu-rane and ice-cold perfused with the slicing solution (see composition below) and killed by decapitation. Slices were cut in an ice-cold
solution containing 92 mM n-methyl-d-glutamine, 30 mM NaHCO3,
25 mM d-glucose, 10 mM MgCl2, 2.5 mM KCl, 0.5 mM CaCl2, 1.2 mM
NaH2PO4, 20 mM Hepes, 5 mM sodium ascorbate, 2 mM thiourea, and 3 mM sodium pyruvate and were bubbled with 95% O2–5% CO2 (pH 7.4). Slices recovered (1 hour) in a solution containing 125 mM NaCl, 26 mM NaHCO3, 2 mM CaCl2, 2.5 mM KCl, 2 mM
MgCl2, 0.8 mM NaH2PO4, and 10 mM d-glucose and were
equili-brated with 95% O2–5% CO2. Each slice was transferred to a sub-merged chamber mounted on an upright microscope (Olympus BX51WI or Zeiss Axio-Examiner Z1), and neurons were visualized using differential interference contrast infrared videomicroscopy.
Organotypic slices of rat hippocampus
Hippocampal slice cultures were prepared using an interface tech-nique (42). Briefly, postnatal day 5 to 7 Wistar rats were deeply anesthetized by intraperitoneal injection of chloral hydrate, the brain was quickly removed, and each hippocampus was individually dissected. Hippocampal slices (350 m) were placed on 20-mm latex membranes (Millicell) inserted into 35-mm petri dishes con-taining 1 ml of culture medium and maintained for up to 21 days in an incubator at 34°C, 95% O2–5% CO2. The culture medium con-tained 25 ml of Eagle’s Minimum Essential Medium (MEM), 12.5 ml of Hank’s balanced salt solution, 12.5 ml of horse serum, 0.5 ml of penicillin/streptomycin, 0.8 ml of glucose (1 M), 0.1 ml of ascorbic acid (1 mg/ml), 0.4 ml of Hepes (1 M), 0.5 ml of B27, and 8.95 ml of sterile H2O. To avoid glial proliferation, 5 M Ara-C was added to the medium at 3 days in vitro (DIV) for one night. Pyramidal cells from the CA3 area were recorded at the age of 8 to 12 DIV.
Paired recordings and data analysis
Dual recording from pairs of L5 neurons or CA3 neurons were obtained as previously described (42). The external saline contained 125 mM NaCl, 26 mM NaHCO3, 3 mM CaCl2 (1.3 mM in specific cases), 2.5 mM KCl, 2 MgCl2 (1 mM in specific cases), 0.8 mM
NaH2PO4, and 10 mM d-glucose and was equilibrated with 95%
O2–5% CO2. Synaptic inhibition was kept intact in both cortical and hippocampal recordings. Patch pipettes (5 to 10 megohm) were pulled from borosilicate glass and filled with an intracellular solu-tion containing 120 mM K gluconate, 20 mM KCl, 10 mM Hepes, 0.5 mM EGTA, 2 mM MgCl2, 2 mM Na2ATP, and 0.3 mM NaGTP (pH 7.4). Recordings were performed with 2 Axopatch-200B
(Axon Instruments, Molecular Devices) or a MultiClamp-700B (Molecular Devices) at 30°C in a temperature-controlled recording chamber (Luigs & Neumann, Ratingen, Germany). Usually, the presynaptic neuron was recorded in current clamp and the postsyn-aptic cell in voltage clamp. The membrane potential was corrected for the liquid junction potential (−13 mV). Both pre- and postsyn-aptic cells were held at their resting membrane potential (approxi-mately −77 mV). Presynaptic APs were generated by injecting brief (3 nA for 2 ms) depolarizing pulses of current at a frequency of 0.1 Hz. For si-APs, the depolarizing pulse was evoked directly from the resting membrane potential. For ai-APs, the depolarizing pulse was evoked after a 50-ms depolarization of the presynaptic cell to ~−60/−55 mV. Synaptic transmission rundown can occur during the recordings. To prevent the potential rundown that could mask or artificially enhance ISF, si-APs and ai-APs were collected in al-ternation all along the recordings (si-AP, ai-AP, si-AP, ai-AP, …). EPSC2/EPSC1 ratio was assessed with two presynaptic stimulations (50-ms interval). Voltage and current signals were low pass–filtered (3 kHz), and sequences (200 to 500 ms) were acquired at 10 to 20 kHz with pClamp 10 (Axon Instruments, Molecular Devices). In all recordings, access resistance was fully compensated using bridge balance and capacitance neutralization (>70%). Electrophysiological signals were analyzed with ClampFit (Axon Instruments). Postsynaptic re-sponses were averaged over 30 to 50 trials following alignment of the presynaptic APs using automatic peak detection. The presence or absence of a synaptic connection was determined on the basis of averages of 30 individual traces. Spike threshold was determined on AP phase plots as the voltage value exceeding 10 mV/ms.
Calcium imaging
Thin axon collaterals from L5 pyramidal neurons were imaged with a LSM-710 Zeiss confocal microscope. Putative boutons were iden-tified as swellings on thin axon branches. For imaging calcium in the axon of L5 pyramidal neurons, 50 M Alexa 594 and 250 M Fluo-4 (Invitrogen) were added to the pipette solution, as previously described (17). Alexa 594 fluorescence was used to reveal neuronal morphology, whereas fluorescence signals emitted by Fluo-4 were used for calcium imaging. L5 neurons with a long axon in the plane of the slice were selected. Laser sources for fluorescence excitation were set at 488 nm for Fluo-4 and 543 nm for Alexa 594. Calcium signals were measured in the linear range of Fluo-4 detection. Emitted fluorescence was collected between 500 and 580 nm for Fluo-4 and between 620 and 750 nm for Alexa 594. After whole-cell access, the dyes were allowed to diffuse for at least 15 to 20 min before acquisi-tion of fluorescence signals. APs were evoked by a brief (2 ms) and strong (2 to 3 nA) pulse of depolarizing current with or without a preceding subthreshold depolarization (50 ms, 50 to 100 pA). Elec-trophysiological signals were synchronized with calcium imaging in line scan mode (speed, 0.5 to 2 kHz). Acquired Fluo-4 signals were converted to F/F values, and peak amplitudes were measured with a custom-made analysis program (LabView, National Instruments). Rundown of calcium signals may occur during imaging. To prevent the potential rundown that could mask or artificially enhance ISF, calcium signals resulting from si- and ai-APs were collected in alter-nation all along the recordings (si-AP, ai-AP, si-AP, ai-AP, etc.).
Axonal recordings
Simultaneous recordings from the soma and axonal cut ends (blebs, at 50 to 152 m from the cell body) were obtained in L5 pyramidal
on May 7, 2020
http://advances.sciencemag.org/
neurons, as previously described (17). The axon was recorded 10 to 15 min after whole-cell access of the somatic compartment and the full labeling of the axon by Alexa 488 and visualized with the LSM-710 confocal microscope.
Network activity
To test the incidence of spiking activity on cortical network activity, paired recordings from adjacent L5 pyramidal neurons were ob-tained in physiological extracellular calcium conditions (1.3 mM). A spike was elicited in one of the two cells after having verified the integrity of the axon in the spiking neuron. For this, neurons were recorded with 50 M Alexa 488, and only recordings in which the spiking cell displayed an axon longer than 100 m were kept for the final analysis. The spontaneous excitatory postsynaptic activity was measured in the nonspiking cell by counting the number of post-synaptic events occurring 200 ms before and 200 ms after the spike with the use of a custom-made software programmed in LabView.
Pharmacology
TTX and CBZ were provided by Tocris. All drugs were bath applied.
Dynamic clamp
Excitatory postsynaptic conductance (Fig. 1A) was injected into the presynaptic neuron using a dynamic clamp system (SM-1; Cambridge Conductance, Cambridge, UK), and a computer conductance pro-file was delivered via an analog-digital interface (Digidata 1440A; Molecular Devices). The conductance profile was derived from the Exp2syn Point Process from the NEURON 7.4 software (rise time, 1.5 ms; decay time, 10 ms). The reversal potential for AMPA receptor–like component was set at 0 mV. Amplitude of AMPA-like conductance was adjusted to produce in each case only one AP in the presynaptic neuron per episode of stimulation. In the synchro-nous configuration, the latency of the spike from the EPSP onset was 4.7 ± 0.7 ms (n = 8). In the intermediate configuration, the latency of the spike from the EPSP onset was 24.9 ± 1.3 ms (n = 8). In the asynchronous configuration, the latency of the spike from the EPSP onset was 43.7 ± 0.7 ms (n = 8).
Hodgkin-Huxley modeling
A multicompartment model of L5 pyramidal neuron was simulated with NEURON 7.4. The neuronal morphology was taken from Hu and coworkers (20). All simulations were run with 10-s time steps, and the nominal temperature of simulation was 30°C. The voltage dependence of activation and inactivation of Hodgkin-Huxley– based conductance models were taken from Hu et al. (20) for gNav1.2 and gNav1.6, from Mainen et al. (43) for gKDR, from Shu et al. (44) for gKv1, and from Bischofberger et al. (45) for gCa. The equilibrium
potentials for Na+, K+, Ca2+, and passive channels were set to +60,
−90, +140, and −70 mV, respectively. The conductance density is provided in table S1, and the biophysics of Nav channels is provided in fig. S6. The resting membrane potential was set to −78 mV. The current was injected in the soma to produce APs. EPSPs were sim-ulated in Fig. 5A with synaptic conductance whose waveform was determined by two exponential functions (EPSC rise time, 1.5 ms; and EPSC decay, 10 ms) and matched experimentally determined mEPSCs (46). In other modeling figures (Fig. 5B and fig. S4A), APs evoked by synchronous-like inputs were produced by injection of 1.6 nA during 2 ms directly from the resting membrane potential.
APs evoked by asynchronous-like inputs were produced by injection of 1.6 nA during 2 ms after a 50-ms subthreshold depolarization via injection of 0.3 nA. To observe the postsynaptic response, a presyn-aptic terminal of the L5 neuron located at 150 m from the soma and located on an axonal collateral was synaptically connected to a postsynaptic neuron. The postsynaptic neuron was a single- compartment model, containing only passive conductance. The level
of release was dependent on the Ca2+ concentration in the presynaptic
terminal. The synapse model was taken from Destexhe et al. (47).
Network modeling
Neuron model
Simulations were performed using current-based leaky integrate-
and-fire neurons with membrane time constant m = 20 ms and
resting membrane potential Vrest = − 70 mV. When the membrane
potential Vm reaches the spiking Vthresh = − 55 mV, a spike is
gener-ated and the membrane potential is clamped to the reset potential
Vreset = − 70 mV during a refractory period of duration ref = 5 ms. Each presynaptic spike produces an exponentially decaying current with time constant exc = 5 ms for excitation and inh = 10 ms for inhibition. All neurons are stimulated with a zero-mean white noise current (t), resulting in voltage fluctuation of standard deviation
= 4 mV. The model equations are thus
m d V ─dt = ( V m (t) rest − V m (t)) + g exc (t) + g inh (t) + √ (2 m ) (t)
syn ─d g syn (t)
dt = − g syn (t)
where syn ∈ {exc, inh} and each presynaptic spike trigger an
instan-taneous increase: gsyn → gsyn + synwi, where wi is the synaptic weight
and syn is a scaling factor calculated so that a synaptic weight of
1 mV produces PSPs of peak size 1 mV. Note that gsyn is in units of
volt, i.e., the membrane resistance is implicitly included in the variable. For exponential synapses, we can compute analytically
syn = ( ─ syn ) m m _ m − syn Network model
We used a random balanced network (48) composed of 4000 excit-atory neurons and 1000 inhibitory neurons. Every neuron in the network is connected to 10% of the others, with delays drawn from a uniform distribution between 0 and 5 ms. To set the network in a balanced regime, we neglected the contribution of spikes and used Campbell’s theorems, which give the mean and variance of a shot noise (corresponding to sums of PSPs with Poisson statistics)
< V m > = F N exc w exc <∫ EPSP> + F N inh w inh <∫ IPSP> + V rest
where F is in the firing rate of the network, and Nsyn is the average number of incoming synapses per neuron. In the balanced regime,
we want to have <Vm > = Vrest, so we should have
w exc N exc <∫ EPSP> = − w inh N inh <∫ IPSP>
Since the connection probability is uniform, we have Nexc =
4Ninh. Using the fact that <∫EPSP> = excexc and <∫IPSP> = inhinh,
we have the following equation for the balance g = winh/wexc
on May 7, 2020
http://advances.sciencemag.org/
g = − 4 ─ exc exc
inh inh = − 2 ─ exc inh
Initial synaptic weights for recurrent excitatory connections are drawn from a log-normal distribution such that <wexc > = 1 mV, to match experimental findings (see fig. S5D) (49). To be in a strong balanced regime, recurrent inhibitory connections are drawn from a Gaussian distribution such that <winh > = − 1.5g < wexc>. SD of the Gaussian distributions is chosen to be a fourth of the means.
In the spontaneous regime, the network displays an asynchro-nous irregular regime characterized by a low firing rate (0.2 Hz) (see fig. S5C) and an average coefficient of variation for the interspike intervals close to 1 (see fig. S5G).
Protocol
To mimic the experimental protocol, we randomly selected 100 ex-citatory neurons within the network and forced them to spikes at controlled times. In half of the trials (100 repeats), the spike had a “normal” effect (ai-AP), while in the other half of the trials (100 re-peat), to mimic the fact that this particular spike was considered to be a si-AP spike, all the effective weights of the spiking neuron were artificially increased by 30%. Injections of consecutive spikes were spaced by a short duration of 200 ms, and the si-AP spike effect was limited to the effective weights onto excitatory neurons. Simula-tions where all effective weights were increased (both to excit-atory and inhibitory neurons) showed that the effect was strongly reduced.
Simulator
All simulations were performed using the Brian simulator version 2 (50) with a fixed time step of 0.1 ms.
Quantification and statistical analysis
Membrane potentials are specified with correction for liquid junc-tion potentials. Values indicate mean value ± SEM. Significance of difference between two groups of paired data was assessed by non-parametric Wilcoxon signed-rank test. For comparison between unpaired groups of data, Mann-Whitney U test was used. Differ-ences were considered significant if P < 0.05.
SUPPLEMENTARY MATERIALS
Supplementary material for this article is available at http://advances.sciencemag.org/cgi/ content/full/6/19/eaay4313/DC1
View/request a protocol for this paper from Bio-protocol. REFERENCES AND NOTES
1. C. M. Gray, P. König, A. K. Engel, W. Singer, Oscillatory responses in cat visual cortex exhibit inter-columnar synchronization which reflects global stimulus properties.
Nature 338, 334–337 (1989).
2. M. Stopfer, S. Bhagavan, B. H. Smith, G. Laurent, Impaired odour discrimination on desynchronization of odour-encoding neural assemblies. Nature 390, 70–74 (1997). 3. W. Singer, Neuronal synchrony: A versatile code for the definition of relations? Neuron 24,
111–125 (1999).
4. J. Fell, N. Axmacher, The role of phase synchronization in memory processes.
Nat. Rev. Neurosci. 12, 105–118 (2011).
5. P. Paoletti, C. Bellone, Q. Zhou, NMDA receptor subunit diversity: Impact on receptor properties, synaptic plasticity and disease. Nat. Rev. Neurosci. 14, 383–400 (2013). 6. R. A. Deisz, G. Fortin, W. Zieglgansberger, Voltage dependence of excitatory postsynaptic
potentials of rat neocortical neurons. J. Neurophysiol. 65, 371–382 (1991). 7. R. Azouz, C. M. Gray, Dynamic spike threshold reveals a mechanism for synaptic
coincidence detection in cortical neurons in vivo. Proc. Natl. Acad. Sci. U.S.A. 97, 8110–8115 (2000).
8. R. Azouz, C. M. Gray, Adaptive coincidence detection and dynamic gain control in visual cortical neurons in vivo. Neuron 37, 513–523 (2003).
9. J. Platkiewicz, R. Brette, Impact of fast sodium channel inactivation on spike threshold dynamics and synaptic integration. PLOS Comput. Biol. 7, e1001129 (2011). 10. B. Fontaine, J. L. Peña, R. Brette, Spike-threshold adaptation predicted by membrane
potential dynamics in vivo. PLOS Comput. Biol. 10, e1003560 (2014).
11. W. B. Wilent, D. Contreras, Stimulus-dependent changes in spike threshold enhance feature selectivity in rat barrel cortex neurons. J. Neurosci. 25, 2983–2991 (2005). 12. J. C. Wester, D. Contreras, Biophysical mechanism of spike threshold dependence
on the rate of rise of the membrane potential by sodium channel inactivation or subthreshold axonal potassium current. J. Comput. Neurosci. 35, 1–17 (2013). 13. H. Alle, J. R. P. Geiger, Combined analog and action potential coding in hippocampal
mossy fibers. Science 311, 1290–1293 (2006).
14. Y. Shu, A. Hasenstaub, A. Duque, Y. Yu, D. A. McCormick, Modulation of intracortical synaptic potentials by presynaptic somatic membrane potential. Nature 441, 761–765 (2006).
15. M. H. Kole, J. J. Letzkus, G. J. Stuart, Axon initial segment Kv1 channels control axonal action potential waveform and synaptic efficacy. Neuron 55, 633–647 (2007). 16. D. Debanne, A. Bialowas, S. Rama, What are the mechanisms for analogue and digital
signalling in the brain? Nat. Rev. Neurosci. 14, 63–69 (2013).
17. S. Rama, M. Zbili, A. Bialowas, L. Fronzaroli-Molinieres, N. Ankri, E. Carlier, V. Marra, D. Debanne, Presynaptic hyperpolarization induces a fast analogue modulation of spike-evoked transmission mediated by axonal sodium channels. Nat. Commun. 6, 10163 (2015).
18. M. Zbili, D. Debanne, Past and future of analog-digital modulation of synaptic transmission. Front. Cell. Neurosci. 13, 160 (2019).
19. S. Y. Kawaguchi, T. Sakaba, Control of inhibitory synaptic outputs by low excitability of axon terminals revealed by direct recording. Neuron 85, 1273–1288 (2015).
20. W. Hu, C. Tian, T. Li, M. Yang, H. Hou, Y. Shu, Distinct contributions of Nav1.6
and Nav1.2 in action potential initiation and backpropagation. Nat. Neurosci. 12,
996–1002 (2009).
21. M. Willow, T. Gonoi, W. A. Catterall, Voltage clamp analysis of the inhibitory actions of diphenylhydantoin and carbamazepine on voltage-sensitive sodium channels in neuroblastoma cells. Mol. Pharmacol. 27, 549–558 (1985).
22. C.-C. Kuo, R.-S. Chen, L. Lu, R.-C. Chen, Carbamazepine inhibition of neuronal Na+
currents: Quantitative distinction from phenytoin and possible therapeutic implications.
Mol. Pharmacol. 51, 1077–1083 (1997).
23. H. C. Jones, R. F. Keep, Brain fluid calcium concentration and response to acute hypercalcaemia during development in the rat. J. Physiol. 402, 579–593 (1988). 24. F. Ding, J. O’Donnell, Q. Xu, N. Kang, N. Goldman, M. Nedergaard, Changes
in the composition of brain interstitial ions control the sleep-wake cycle. Science 352, 550–555 (2016).
25. K. Dover, S. Solinas, E. D'Angelo, M. Goldfarb, Long-term inactivation particle for voltage-gated sodium channels. J. Physiol. 588, 3695–3711 (2010).
26. K. Dover, C. Marra, S. Solinas, M. Popovic, S. Subramaniyam, D. Zecevic, E. D’Angelo, M. Goldfarb, FHF-independent conduction of action potentials along the leak-resistant cerebellar granule cell axon. Nat. Commun. 7, 12895 (2016).
27. M. B. Hoppa, G. Gouzer, M. Armbruster, T. A. Ryan, Control and plasticity
of the presynaptic action potential waveform at small CNS nerve terminals. Neuron 84, 778–789 (2014).
28. S. Boudkkazi, L. Fronzaroli-Molinieres, D. Debanne, Presynaptic action potential waveform determines cortical synaptic latency. J. Physiol. 589, 1117–1131 (2011). 29. T. Sasaki, N. Matsuki, Y. Ikegaya, Effects of axonal topology on the somatic modulation
of synaptic outputs. J. Neurosci. 32, 2868–2876 (2012).
30. A. Bialowas, S. Rama, M. Zbili, V. Marra, L. Fronzaroli-Molinieres, N. Ankri, E. Carlier, D. Debanne, Analog modulation of spike-evoked transmission in CA3 circuits is determined by axonal Kv1.1 channels in a time-dependent manner. Eur. J. Neurosci. 41, 293–304 (2015).
31. J. M. Christie, D. N. Chiu, C. E. Jahr, Ca2+-dependent enhancement of release by
subthreshold somatic depolarization. Nat. Neurosci. 14, 62–68 (2011). 32. B. Bouhours, F. F. Trigo, A. Marty, Somatic depolarization enhances GABA release
in cerebellar interneurons via a calcium/protein kinase C pathway. J. Neurosci. 31, 5804–5815 (2011).
33. S. Thorpe, A. Delorme, R. Van Rullen, Spike-based strategies for rapid processing.
Neural Netw. 14, 715–725 (2001).
34. S. Celebrini, S. Thorpe, Y. Trotter, M. Imbert, Dynamics of orientation coding in area V1 of the awake primate. Vis. Neurosci. 10, 811–825 (1993).
35. T. J. Gawne, T. W. Kjaer, B. J. Richmond, Latency: Another potential code for feature binding in striate cortex. J. Neurophysiol. 76, 1356–1360 (1996).
36. S. Panzeri, R. S. Petersen, S. R. Schultz, M. Lebedev, M. E. Diamond, The role of spike timing in the coding of stimulus location in rat somatosensory cortex. Neuron 29, 769–777 (2001).
37. S. Panzeri, N. Brunel, N. K. Logothetis, C. Kayser, Sensory neural codes using multiplexed temporal scales. Trends Neurosci. 33, 111–120 (2010).
on May 7, 2020
http://advances.sciencemag.org/
38. G. G. de Polavieja, A. Harsch, I. Kleppe, H. P. C. Robinson, M. Juusola, Stimulus history reliably shapes action potential waveforms of cortical neurons. J. Neurosci. 25, 5657–5665 (2005).
39. S. Boudkkazi, E. Carlier, N. Ankri, O. Caillard, P. Giraud, L. Fronzaroli-Molinieres, D. Debanne, Release-dependent variations in synaptic latency: A putative code for short- and long-term synaptic dynamics. Neuron 56, 1048–1060 (2007). 40. W. Hu, B. P. Bean, Differential control of axonal and somatic resting potential by
voltage-dependent conductances in cortical layer 5 pyramidal neurons. Neuron 97, 1315–1326.e3 (2018).
41. A. R. Cantrell, J. Y. Ma, T. Scheuer, W. A. Catterall, Muscarinic modulation of sodium current by activation of protein kinase C in rat hippocampal neurons. Neuron 16, 1019–1026 (1996).
42. D. Debanne, S. Boudkkazi, E. Campanac, R. H. Cudmore, P. Giraud, L. Fronzaroli-Molinieres, E. Carlier, O. Caillard, Paired-recordings from synaptically coupled cortical
and hippocampal neurons in acute and cultured brain slices. Nat. Protoc. 3, 1559–1568 (2008).
43. Z. F. Mainen, J. Joerges, J. R. Huguenard, T. J. Sejnowski, A model of spike initiation in neocortical pyramidal neurons. Neuron 15, 1427–1439 (1995).
44. Y. Shu, Y. Yu, J. Yang, D. A. McCormick, Selective control of cortical axonal spikes by
a slowly inactivating K+ current. Proc. Natl. Acad. Sci. U.S.A. 104, 11453–11458 (2007).
45. J. Bischofberger, J. R. P. Geiger, P. Jonas, Timing and efficacy of Ca2+ channel activation
in hippocampal mossy fiber boutons. J. Neurosci. 22, 10593–10602 (2002). 46. V. Sourdet, M. Russier, G. Daoudal, N. Ankri, D. Debanne, Long-term enhancement
of neuronal excitability and temporal fidelity mediated by metabotropic glutamate receptor subtype 5. J. Neurosci. 23, 10238–10248 (2003).
47. A. Destexhe, Z. F. Mainen, T. J. Sejnowski, Synthesis of models for excitable membranes, synaptic transmission and neuromodulation using a common kinetic formalism.
J. Comput. Neurosci. 1, 195–230 (1994).
48. C. van Vreeswijk, H. Sompolinsky, Chaos in neuronal networks with balanced excitatory and inhibitory activity. Science 274, 1724–1726 (1996).
49. S. Lefort, C. Tomm, J. C. Floyd Sarria, C. C. Petersen, The excitatory neuronal network of the C2 barrel column in mouse primary somatosensory cortex. Neuron 61, 301–316 (2009). 50. D. F. Goodman, R. Brette, The Brian simulator. Front. Neurosci. 3, 192–197 (2009).
Acknowledgments: We thank A. Bialowas and V. Marra for sharing preliminary data;
U. Gerber, G. Laurent, E. Neher, and W. Singer for critically reading a preliminary version of the manuscript; and R. Cossart and M. Scanziani for helpful discussion. Funding: This work was supported by INSERM, CNRS (to D.D.), Ecole Normale Supérieure (doctoral grant to M.Z.), Agence Nationale de la Recherche (grant ANR-14-CE13-0003 to D.D., R.B., and P.Y.), and Fondation pour la Recherche Médicale (DVS-2013-1228768 to D.D. and FDT-2015-0532147 to M.Z.). Author contributions: M.Z., S.R., and D.D. conceived the project. M.Z., S.R., Y.I., N.B.-G., L.F.-M., and M.R. performed the experiments. M.Z., S.R., Y.I., and D.D. analyzed the data. M.Z., P.Y., and R.B. performed modeling and M.Z., S.R., P.Y., and D.D. wrote the manuscript. D.D. supervised the project. Competing interests: The authors declare that they have no competing interests. Data and material availability: All data needed to evaluate the conclusions in the paper are present in the paper and/or the Supplementary Materials. Additional data related to this paper may be requested from the authors.
Submitted 18 June 2019 Accepted 19 February 2020 Published 6 May 2020 10.1126/sciadv.aay4313
Citation: M. Zbili, S. Rama, P. Yger, Y. Inglebert, N. Boumedine-Guignon, L. Fronzaroli-Moliniere,
R. Brette, M. Russier, D. Debanne, Axonal Na+ channels detect and transmit levels of input
synchrony in local brain circuits. Sci. Adv. 6, eaay4313 (2020).
on May 7, 2020
http://advances.sciencemag.org/
DOI: 10.1126/sciadv.aay4313 (19), eaay4313.
6 Sci Adv
ARTICLE TOOLS http://advances.sciencemag.org/content/6/19/eaay4313
MATERIALS
SUPPLEMENTARY http://advances.sciencemag.org/content/suppl/2020/05/04/6.19.eaay4313.DC1
REFERENCES
http://advances.sciencemag.org/content/6/19/eaay4313#BIBL
This article cites 50 articles, 13 of which you can access for free
PERMISSIONS http://www.sciencemag.org/help/reprints-and-permissions
Terms of Service
Use of this article is subject to the
is a registered trademark of AAAS.
Science Advances
York Avenue NW, Washington, DC 20005. The title
(ISSN 2375-2548) is published by the American Association for the Advancement of Science, 1200 New
Science Advances
License 4.0 (CC BY-NC).
Science. No claim to original U.S. Government Works. Distributed under a Creative Commons Attribution NonCommercial Copyright © 2020 The Authors, some rights reserved; exclusive licensee American Association for the Advancement of
on May 7, 2020
http://advances.sciencemag.org/