HAL Id: hal-00295595
https://hal.archives-ouvertes.fr/hal-00295595
Submitted on 1 Feb 2005
HAL is a multi-disciplinary open access
archive for the deposit and dissemination of
sci-entific research documents, whether they are
pub-lished or not. The documents may come from
teaching and research institutions in France or
abroad, or from public or private research centers.
L’archive ouverte pluridisciplinaire HAL, est
destinée au dépôt et à la diffusion de documents
scientifiques de niveau recherche, publiés ou non,
émanant des établissements d’enseignement et de
recherche français ou étrangers, des laboratoires
publics ou privés.
and precipitation depending on the polar vortex strength
K. Walter, H.-F. Graf
To cite this version:
K. Walter, H.-F. Graf. The North Atlantic variability structure, storm tracks, and precipitation
depending on the polar vortex strength. Atmospheric Chemistry and Physics, European Geosciences
Union, 2005, 5 (1), pp.239-248. �hal-00295595�
Atmos. Chem. Phys., 5, 239–248, 2005 www.atmos-chem-phys.org/acp/5/239/ SRef-ID: 1680-7324/acp/2005-5-239 European Geosciences Union
Atmospheric
Chemistry
and Physics
The North Atlantic variability structure, storm tracks, and
precipitation depending on the polar vortex strength
K. Walter1and H.-F. Graf1,2
1Max-Planck-Institute for Meteorology, Bundesstrasse 54, D-20146 Hamburg, Germany
2Centre for Atmospheric Science, University of Cambridge, Dept. Geography, Cambridge, CB2 3EN, UK
Received: 10 June 2004 – Published in Atmos. Chem. Phys. Discuss.: 5 October 2004 Revised: 7 December 2004 – Accepted: 27 January 2005 – Published: 1 February 2005
Abstract. Motivated by the strong evidence that the state
of the northern hemisphere vortex in boreal winter influ-ences tropospheric variability, teleconnection patterns over the North Atlantic are defined separately for winter episodes where the zonal wind at 50 hPa and 65◦N is above or below the critical velocity for vertical propagation of zonal plane-tary wave 1. We argue that the teleconnection structure in the middle and upper troposphere differs considerably between the two regimes of the polar vortex, while this is not the case at sea level. If the polar vortex is strong, there exists one meridional dipole structure of geopotential height in the up-per and middle troposphere, which is situated in the central North Atlantic. If the polar vortex is weak, there exist two such dipoles, one over the western and one over the eastern North Atlantic. Storm tracks (and precipitation related with these) are determined by mid and upper tropospheric condi-tions and we find significant differences of these parameters between the stratospheric regimes. For the strong polar vor-tex regime, in case of a negative upper tropospheric “NAO” index we find a blocking height situation over the Northeast Atlantic and the strongest storm track of all. It is reaching far north into the Arctic Ocean and has a secondary maximum over the Denmark Strait. Such storm track is not found in composites based on a classic NAO defined by surface pres-sure differences between the Icelandic Low and the Azores High. Our results suggest that it is important to include the state of the polar vortex strength in any study of the variabil-ity over the North Atlantic.
Correspondence to: H.-F. Graf
1 Introduction
During boreal winter the climate in large parts of the North-ern Hemisphere is under the influence of the North Atlantic Oscillation (NAO). The latter constitutes the dominant mode of tropospheric variability in the North Atlantic region in-cluding the North American East Coast and Europe, with ex-tensions to Siberia and the Eastern Mediterranean. The NAO is characterised by a meridional oscillation of mass between two major centres of action over the subtropical Atlantic and near Iceland: the Azores High and the Iceland Low. Sev-eral studies suggest that the NAO is closely associated with the strength and direction of the North Atlantic storm tracks as well as with precipitation and temperature over Europe (Rogers, 1990; Hurrell, 1995; Hurrell and van Loon, 1997, among others). The difference of normalized sea level pres-sures between the Azores High and Iceland Low is often used to construct index time series of the NAO (Walker and Bliss, 1932; Hurrell, 1995). During winter months with a posi-tive NAO index, i.e. with an enhanced north-south pressure gradient over the north Atlantic, northern Europe is in gen-eral characterized by warm and wet conditions and south-ern Europe (and in particular the Iberian Peninsula) by dry conditions. The opposite holds for months with a negative NAO index. However, Rogers (1997) stated that one of the two polarities of the leading mode of North Atlantic storm track variability corresponds to a blocking situation over the Northeast Atlantic with a strong northeastward tilt of the storm track axis and reduced precipitation over West Europe. This situation is not captured by standard NAO indices.
The typical time scale of the NAO is on the order of two weeks (Feldstein, 2003), but there are clearly much longer periods involved when the NAO tends to prefer one polar-ity. During the last decade these monthly, seasonal and even decadal NAO fluctuations were intensively studied concern-ing their connection to the upper boundary, the stratospheric polar vortex (Baldwin et al., 1994; Perlwitz and Graf, 1995;
and many others). The stratospheric polar vortex is primarily driven by radiative cooling during the polar night and can be disturbed by tropospheric planetary waves entering the stratosphere. In linear theory the probability for such waves propagating upward to higher atmospheric layers depends on the zonal wind speed and the vertical structure of the atmo-sphere as well as on the latitude and zonal wave number (Charney and Drazin, 1961). Under normal conditions in winter, only ultra long planetary waves can propagate into the stratosphere. This leads to much less variability, fewer degrees of freedom and longer time scales in the stratosphere than in the troposphere (Perlwitz and Graf, 2001). Feedbacks between the vortex strength and wave disturbances can lead to the formation of “regimes” of the stratospheric circula-tion – characterized by either a strong or a weak polar vortex (Hu and Tung, 2002). These natural regimes were found by Christiansen (2003) and by Perlwitz and Graf (2001) in ob-served data.
Baldwin and Dunkerton (2001) reported changes in the probability distribution function of the NAO index depend-ing on the polarity of the stratospheric circulation regime: When the polar vortex is strong, the NAO index tends to be positive. They claimed that the build-up of either a strong or weak polar vortex in winter might he a harbinger for tropo-spheric climate related to the NAO. Perlwitz and Graf (2001) documented an impact of the troposphere on the lower sphere under any circumstances in winter, whereas the strato-sphere acts back on the tropostrato-sphere only if the polar vortex is strong. Castanheira and Graf (2003) were able to demon-strate that tropospheric variability structures are different for different stratospheric regimes. Namely a negative correla-tion between the Icelandic and the Aleutian Lows (Honda et al., 2002) exists only when the polar vortex is strong.
The processes responsible for coupling the stratospheric and the tropospheric circulation are still under discussion. Castanheira et al. (2002) showed that NAO and stratospheric polar vortex constitute two different Normal Modes of the at-mosphere. A shift in atmospheric mass between subtropics and polar latitudes occurs when stratospheric regimes change polarity (Castanheira and Graf, 2003) and the pattern of this shift is very much like the pattern of the Arctic Oscillation as described by Thompson and Wallace (1998). Such shifts of the stratospheric circulation regimes can be forced externally, e.g. by volcanic eruptions in the tropics (Graf et al., 1994), by higher greenhouse gas concentration (Shindell et al., 1999) or, in late winter and spring, by loss of stratospheric ozone (Ramaswamy et al., 1996; Graf et al., 1998). But also in-ternal dynamical processes can lead to changes of the strato-spheric polar vortex (Matsuno, 1970). Waves generated in the troposphere play a dominant role, which can even lead to the breakdown of the vortex.
While the processes influencing the strength of the strato-spheric polar vortex are quite well understood from mod-elling studies and observations, the dynamical reasons for the downward propagation of such signals are not. One
ex-planation (Hines, 1974) is based on linear theory and sug-gests that the zonal winds in the stratosphere influence the refractive index and, thus, the propagation/refraction proper-ties of planetary waves and their interaction with the mean flow (Charney and Drazin, 1961; Matsuno, 1970; Andrews et al., 1987). Limpasuvan and Hartmann (2000) and Hu and Tung (2002) found that such reflection takes place near the tropopause rather than in the lower stratosphere. This pro-cess may be strongest where the planetary waves are most pronounced, i.e. in the middle and high, but not in the polar latitudes. Hartley et al. (1998), Ambaum and Hoskins (2002) and Black (2002) suggested another mechanism. It is based on the fact that large-scale anomalies of potential vorticity in the lower stratosphere induce geopotential height anomalies in the polar troposphere through hydrostatic and geostrophic adjustment of the atmospheric column. A strong vortex in the lower stratosphere is then associated with anomalously low pressure in the troposphere near the pole. This represents a large scale annular “stirring” of the troposphere from above. In the current paper we extend the work of Castanheira and Graf (2003) and investigate if the state of the stratospheric circulation also has an influence on the variability structure of the NAO. For this purpose we will first redefine the at-mospheric teleconnectivity over the North Atlantic Ocean. We will do this for the upper troposphere rather than for the surface pressure, which is normally used for the definition of NAO indices. The reason is that the biggest differences in geopotential height and zonal winds are found in the up-per troposphere when the data are separated into strong and weak polar vortex regimes (Christiansen, 2003). It turns out that in fact teleconnectivity is most different in the upper tro-posphere between the two stratospheric regimes. In a sec-ond step we will then, based on the newly defined indices for the North Atlantic teleconnections, study the differences in storm tracks and precipitation over the North Atlantic and Europe.
We used reanalysis data of geopotential height, air temper-ature, wind and precipitation from the National Centres for Environmental Prediction/National Centre for Atmospheric Research (NCEP/NCAR; Kalnay et al., 1996) for the win-ter months December to March from 1958 to 1998. The an-nual cycle was removed from the data prior to performing the analyses. Since the data are not completely homogeneous due to changes in the density and quality of observational input (e.g. the introduction of satellite information in 1979) we did not study trends, which were removed by subtract-ing ten year runnsubtract-ing means from the data. The results pre-sented in the following, however, are not very different if the trends were included. The problems with data homogeneity are most evident in the tropics and over the Southern Hemi-sphere. Thus, we constrained our analyses to the Northern Hemisphere extra-tropics. Reanalysis data in the Northern Hemisphere extra-tropics are fairly accurate (Kistler et al., 2001). Rainfall estimates have limited reliability, particu-larly for convective rain, but in winter large-scale anomalies
K. Walter and H.-F. Graf: North Atlantic variability structure, storm tracks and precipitation 241 may be considered accurate to first order (Reid et al., 2001).
The zonal mean zonal wind at 65◦N in 50 hPa proved to be a good indicator of the strength of the polar vortex and was used to define stratospheric polar vortex regimes by Cas-tanheira and Graf (2003). We adopted their thresholds of
>20 m/s for the strong and <10 m/s for the weak polar vor-tex regime and defined 71 months as SVR and 32 months as WVR. The stratification of the polar vortex regimes is based on monthly anomalies, which reflect the time scale of strato-spheric variability of several weeks (Baldwin and Dunkerton, 2001) rather than the tropospheric NAO time scale of two weeks (Feldstein, 2003).Upper tropospheric teleconnections are based on filtered daily data to capture the time scale of tropospheric variability. Climate anomalies like storm tracks and precipitation are analyzed on the basis of monthly means of the teleconnection indices.
2 Results and discussion
2.1 Teleconnectivity
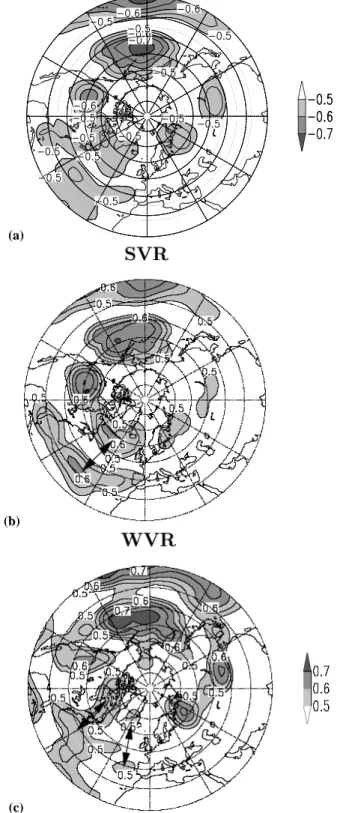
Wallace and Gutzler (1981) introduced teleconnectivity as a search variable for teleconnections. For a given grid point, the correlations of a variable with all other grid points in a field are computed and the teleconnectivity for this grid point then is defined as the maximum negative correlation. The existence of real teleconnections has to be proved by the computation of correlation fields between the points of maximum teleconnectivity (centres of action) with the whole field. We performed a teleconnectivity analysis (Wallace and Gutzler, 1981) for the upper troposphere (300 hPa) geopoten-tial height fields separately for periods of strong (SVR) and weak (WVR) stratospheric polar vortex. Since remote tele-connections are characterized by low frequencies, the data has been low pass filtered with a Fourier filter removing fluc-tuations with periods shorter than 15 days.
Using all data (Fig. 1c), over the North Atlantic two large diffuse maxima of teleconnectivity extend zonally over al-most the entire North Atlantic: One in the subpolar and the other over the subtropical latitudes. The maximum tele-connectivity is found between the western subtropical North Atlantic and northeastern Canada. The structures over the Pacific area constitute a wave train-like teleconnection pat-tern reaching from the (sub) tropical Pacific to the southeast coast of the USA, the Pacific/North American pattern (PNA). These will not be discussed any further in this paper since correlation analyses of geopotential height in their centres of actions revealed that the pattern structures are not profoundly different between the entire period, SVR, and WVR. This in-dicates that the PNA structure is not dependent on the state of the polar stratospheric vortex. However, the amplitude of PNA is correleted to the polar vortex strength (Castanheira et al., 2002).
(a)
(b)
(c)
Fig. 1. Teleconnectivity of the 15-day low pass filtered
geopoten-tial height of the 300-hPa level in December to March from 1958 to 1998. Isoline interval is 0.05, only larger values than 0.5 are shown. (a) only periods with strong polar vortex, (b) only periods with weak polar vortex used, (c) all data. Arrows mark Atlantic centres of action of dominant teleconnection patterns in SVR and WVR.
Fig. 2. As in Fig. 1, but for 15-day low pass filtered data at the 1000 hPa level. The isoline interval is 0.05. Only values larger than 0.5 are
shown.
In the SVR, there are two zonally elongated areas of strong teleconnectivity over much of the North Atlantic (Fig. 1a). Their centres are located southeast of Greenland and in the subtropical central North Atlantic, respectively. Correlation maps of the geopotential height averaged over the two At-lantic teleconnectivity centres correlated with the geopoten-tial height at each grid point revealed that we really diag-nosed a dipole structured teleconnection pattern. This pat-tern will be referred to as the NA-SVR patpat-tern in the follow-ing. Weak, but statistically significant anti-correlation be-tween the Greenland centre and the Aleutian Low is found under SVR conditions in accordance with Castanheira and Graf (2003).
The associated pattern is reminiscent of a south-westward-displaced North Atlantic Oscillation pattern or of the com-bined “western” and “eastern Atlantic” patterns described by Wallace and Gutzler (1981). They derived their patterns for the 500-hPa heights and found the “eastern Atlantic” pattern about 5◦S of our NA-SVR pattern.
While the NA-SVR pattern is thus characterized by a sin-gle teleconnection pattern over the central North Atlantic, there are two meridionally oriented dipole patterns in the WVR (Fig. 1b). The western pattern comprises centres of action over northeastern Canada and over the western part of the subtropical North Atlantic. The eastern pattern is found with centres of action northwest of Iceland/east of Green-land and just west of the Iberian Peninsula. Both patterns were proven to represent real teleconnection patterns by cor-relation analysis applied to the geopotential height field (not shown here), with the values at the centres of action taken as key values. They will be called western and eastern NA-WVR patterns in the following. None of these centres of
action is significantly correlated with the region of the Aleu-tian Low. This supports the argument of Castanheira and Graf (2003) that such correlation only appears under strong vortex conditions. The WVR patterns are characterized by a large number of March events, but the same patterns are obtained also when March is excluded. Hence, there is no seasonal effect included in the patterns. This also shows that the definitions of the regimes by fixed limits of zonal mean wind for the separation into regimes instead of statistically derived ones results in regimes that are physically based and stable. The vertical propagation characteristics of planetary waves are the same within one regime, independent of the season.
The teleconnection patterns described above do not differ much for different low pass filters: We also investigated 10-and 20-day low pass filtered data 10-and the results were simi-lar. The only exception is that the western NA-WVR pattern is concealed by other teleconnection maxima in the 10-day low pass filtered data case. These teleconnection maxima vanish if higher frequencies are removed from the data set. For monthly mean data, the teleconnection patterns are also mainly similar to those presented in Fig. 1. In general, larger temporal smoothing increases teleconnection values. When monthly mean data are used, the eastern NA-WVR pattern is particularly prominent, both centres have values above 0.8.
While the teleconnection patterns for the 500 hPa geopo-tential height (not shown) are almost identical with those at 300 hPa, the situation is different in the lower troposphere (Fig. 2). Teleconnections are much weaker and all centres of action are located further to the east than in the upper tropo-sphere. In the WVR there are imprints of the western NA-WVR pattern with centres over Baffin Bay/northeast Canada
K. Walter and H.-F. Graf: North Atlantic variability structure, storm tracks and precipitation 243
(a) (b)
(c) (d)
(e) (f)
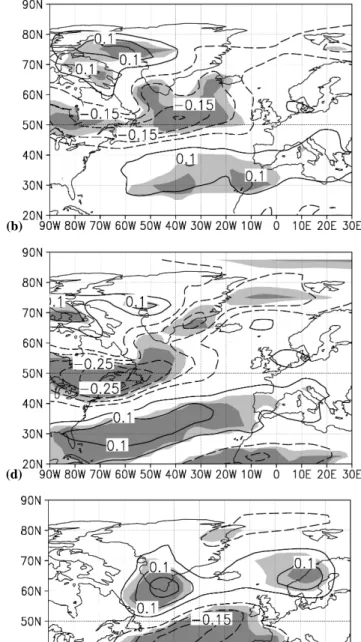
Fig. 3. Composites of the Eady growth rate (anomaly from 1958-1998 mean) for the positive (left) and negative (right) phase of the index of
eastern NA-WVR pattern (a), (b), western NA-WVR pattern (c), (d), and SVR pattern (e), (f). Shadings indicate deviations from the time mean above the 95 (99) significance level (light (dark)).
and over the central North Atlantic. The structures of the eastern NA-WVR and the NA-SVR patterns are difficult to distinguish in the lower troposphere. While the subtropical centres may be separated by approximately 10◦longitudes, the subpolar centres overlap.
These results show that it is worthwhile to study North At-lantic teleconnections in the upper troposphere rather than
near the surface if one wants to examine their connection to the state of the wintertime stratospheric circulation. Monthly means are a good trade-off between the strength of the tele-connections and detail of information in the retrieved cli-mate anomaly patterns. However, it will not be sufficient for studies concerning the dynamic background of these. In the following we will investigate moonthly mean storm tracks
and precipitation anomalies separately for the above defined teleconnection patterns under the two stratospheric circula-tion regimes (SVR and WVR). Due to the double seleccircula-tion process (stratospheric regime and phase of the index) the samples become relatively small, and so the only reasonable method is composite analysis together with t -test analysis to estimate the statistical significance of the anomalies. 2.2 Index time series
Index time series were constructed for the eastern (65◦– 70◦N, 27.5◦–35◦W and 37.5◦–40◦N, 15◦–22.5◦W) and western (62.5◦–65◦N, 77.5◦–82.5◦W and 35◦–37.5◦N, 55◦–62.5◦W) NA-WVR patterns, and for NA-SVR (55◦– 60◦N, 30◦–45◦W and 30◦–35◦N, 35◦–45◦W) using the dif-ference of normalized geopotential height anomalies at the southern and northern centres of action of the respective tele-connection pattern. A positive index then stands for an en-hanced north-south geopotential height gradient. The defi-nition corresponds to a commonly used version of the NAO index based on the difference between normalized sea level pressures at the Azores and Iceland (Hurrell, 1995).
The monthly mean eastern NA-WVR pattern index is highly correlated (0.91) with a “classic” NAO index based on sea level pressure over Iceland and the Azores, while the western NA-WVR index (0.62) and the NA-SVR (0.74) in-dex are much less, although still significantly, correlated with the NAO index. The correlation between the eastern and western NA-WVR monthly mean indices is 0.41. This is a result of spatial overlapping of the patterns and of temporal averaging. Eastern and western NA-WVR indices are only very weakly correlated based on 15-day (the time scale of the NAO life cycle) low pass filtered data (0.18), but the corre-lation increases to 0.37 if the eastern index leads the western by approximately 4 days. This may give rise to the specula-tion that there might be an upstream connecspecula-tion between the two patterns. This phenomenon shall be discussed in a later study. Only the western NA-WVR pattern index is signifi-cantly correlated (0.68) with the strength of the polar vortex when the polar vortex is leading by 1–2 days (based on 10 and 15 day low pass filtered data). The eastern NA-WVR pattern index and the NA-SVR index are only marginally correlated to the strength of the polar vortex. This means that, within the limits of the polar vortex regimes, only the western NA-WVR pattern reacts to changes in the polar vor-tex strength, very probably to changes in the vertical wind profile (see discussion of Eady growth rate below).
2.3 Storm tracks and precipitation
In order to examine the effects of stratospheric regimes on storm tracks and precipitation in the North Atlantic area we applied composite analysis. The composites were averaged over all months in which the monthly mean time series of the corresponding teleconnection index was above (below)
+(−)0.5 standard deviation. The strength and direction of the storm tracks is represented by the monthly root mean square of band pass filtered 500-hPa geopotential heights. The data were band pass filtered using the filter of Black-mon and Lau (1980) capturing fluctuations between 2.5 and 6 days. Monthly mean precipitation rates and Eady growth rates (Fig. 3) were considered as anomalies from the aver-age over the entire period from 1958 to 1998. The “Eady” growth rate of the most unstable wave in the Eady model (Eady, 1949; see also James, 1994) is a measure for the baro-clinic production of transient eddies. It depends on the static stability and on vertical wind shear and is calculated for the lower troposphere (700 hPa). The vertical derivatives were approximated by centred differences between the 500 hPa and 925 hPa levels. We will use this parameter for the in-terpretation of the storm track anomalies.
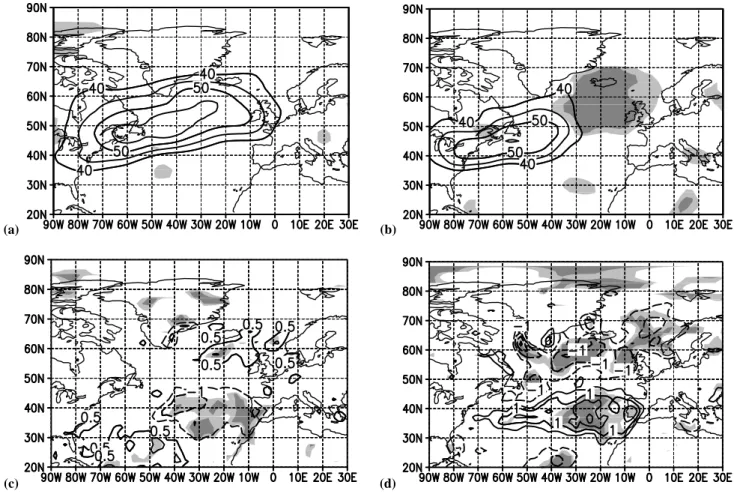
Figure 4 shows composites for the eastern NA-WVR pat-tern index, which consist of 11 (10) months in the positive (negative) index case. In the positive index phase, the North Atlantic storm track is more zonally elongated (Fig. 4a) than in the negative phases (Fig. 4b) and has a stronger southwest to northeast tilt. The area with standard deviations above 40 gpm reaches the Greenwich meridian, whereas it only reaches 30◦W in the negative index case. In the positive index case, cyclones are led to northwestern Europe bringing more precipitation to this area and less precipitation to the Iberian Peninsula (Fig. 4c). The situation is vice versa in the negative index phase (Fig. 4d). This result perfectly matches the results of “classic” NAO studies (see e.g. Rogers, 1997 and in Hurrel et al., 2003). This is in accordance with the very high correlation between eastern NA-WVR and surface NAO indices. Anomalies in the WVR are larger in the nega-tive index phase because they are calculated against the total mean 1958–1998 and during WVR the NAO has a negative bias.
The elongation of the storm track in the positive index phase can be explained by the stronger upper level easterly wind of the anomalous low near Iceland. This is connected to a larger Eady growth rate and, hence, stronger baroclinicity in this area. Positive (negative) wind anomalies are located north of the jet core and negative (positive) anomalies are found to the south of it. Therefore, the area of strongest baro-clinicity over the North American East Coast is displaced north (south) in the positive (negative) index case. This is as-sociated with northward (southward) shift of the storm track axis.
The composites for the western NA-WVR also consist of 11 (10) months (Fig. 5). The storm tracks show a similar qualitative behaviour with the polarity of the index as for eastern NA-WVR. In the positive phase the storm track is longer and stronger than in the negative phase. This differ-ence is more pronounced than in the eastern NA-WVR case. This may be explained by the strong anomalies of the upper tropospheric westerly wind over the western North Atlantic and America. Consequently, fluctuations in the western
NA-K. Walter and H.-F. Graf: North Atlantic variability structure, storm tracks and precipitation 245
(a) (b)
(c) (d)
Fig. 4. Composites of the positive (left) and negative (right) of the index of eastern NA-WVR pattern: (a), (b) monthly rms of bandpass
filtered 500 hPa geopotential height, (c), (d) precipitation rate (mm/d). Anomalies are deviations from 1958–1998 time mean. Shadings indicate deviations from the time mean above the 95 (99) significance level (light (dark)).
WVR pattern strongly modify the baroclinicity over the East Coast of North America, i.e. in a region, which is already characterized by strong synoptic eddy growth due to baro-clinic instability. In the positive phase, the position of the strongest baroclinicity is displaced northward, leading to a similar displacement of the storm track axis. The area of (weakly) enhanced precipitation is located further south than in the positive eastern NA-WVR index case, i.e. it is situ-ated over western to southern Europe, while the precipitation at the Norwegian coast is weakly, but significantly, reduced. The anomaly pattern of the negative phase of the western NA-WVR index resembles the negative eastern NA-WVR case – apart from the fact that the maxima and minima are shifted to the west and that the effects over the continents are smaller.
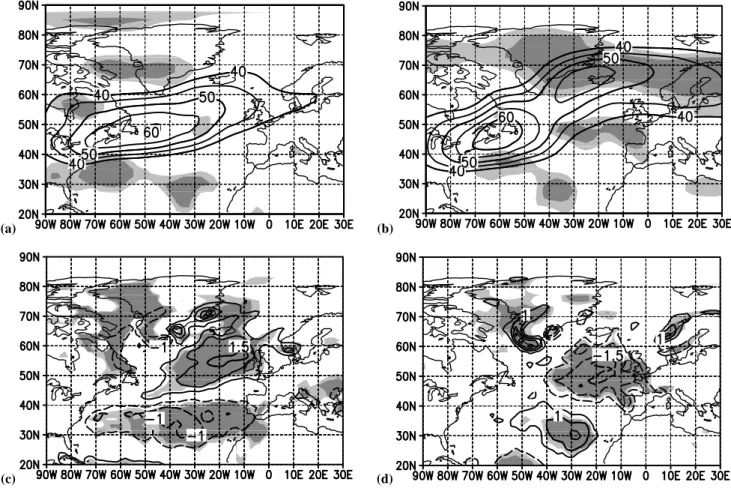
The behaviour of storm tracks and precipitation in the SVR is much different from that in WVR. Figure 6 shows the composites for the NA-SVR pattern in the strong vortex regime, which consists of 26 (24) monthly values in the pos-itive (negative) index case. For both polarities of the
telecon-nection index, the storm tracks span the entire North Atlantic Ocean. This corresponds to the fact that the time mean west-erly flow in the midlatitude North Atlantic region is stronger in the SVR than in the WVR (e.g. Castanheira and Graf, 2003). The storm track is extremely tilted in the negative in-dex case (Fig. 6b) when an (blocking) anticyclone southeast of Iceland is associated with enhancement of the westerly flow to its north and reduction south of it.
The storm track axis runs from the southwest to the north-east over the Denmark Strait and north of Iceland. Cyclones move along this path to the Norwegian coast and are respon-sible for enhanced precipitation in this region (Fig. 6d). Al-though small in space, these precipitation rate anomalies are statistically highly significant (above the 99.9% level) and can be explained by orographic effects. Very important also are the strong positive precipitation anomalies at the south-west coast of Greenland that occur during the SVR nega-tive index phase. These anomalies are due to the northerly-deflected storm tracks and may, together with the anomalies at the Norwegian coast, serve as a proxy for the strength of
(a) (b)
(c) (d)
Fig. 5. As Fig. 4, but for western NA-WVR.
the polar vortex. The precipitation over the British Isles and Western Europe is reduced corresponding to the blocking sit-uation. When the NA-SVR index is in its positive phase, the westerly wind south of the anomalously deep low near Ice-land is enhanced. Therefore, the storm track is more zonally oriented (Fig. 6a). In the positive NA-SVR phase cyclones reach Europe more southerly than in the negative NA-SVR phase. This results in more precipitation over (north-) west-ern, and less over southern Europe in the negative than in the positive phase – just the opposite of what would be expected from a standard NAO analysis.
3 Conclusions
Teleconnections of North Atlantic geopotential heights were examined separately for winter months (December to March) characterized by either a strong or a weak stratospheric polar vortex. In both cases, the major teleconnection patterns have north-south dipole structures with opposing centres of action in subpolar and subtropical latitudes. The middle to upper troposphere in the strong vortex regime (SVR) is character-ized by a single teleconnection pattern over the central North
Atlantic with a basically dipolar structure, the NA-SVR pat-tern. In contrast, there are two dipole patterns in the weak polar vortex regime (WVR): One over north-eastern Canada and the western North Atlantic (western NA-WVR pattern) and one over the eastern North Atlantic (eastern NA-WVR pattern). In the lower troposphere, however, the NA-SVR and the eastern NA-WVR patterns are very similar, in partic-ular concerning their northern centres of action.
The fluctuations in both, the North Atlantic storm track and the precipitation rates, show significant differences be-tween the two polar vortex regimes. Composites of the win-ter North Atlantic storm track and precipitation rates for the two polarities of a “classic” NAO index (without considering the polar vortex regimes in the stratosphere) mainly corre-spond to the composites of the positive phase of the NA-SVR pattern index and the negative phase of the eastern NA-WVR pattern index, respectively.
The composites of the negative phase of the NA-SVR pat-tern index, however, describe a blocking situation (in the SVR low frequency energy is enhanced significantly over the central-east NA as compared with WVR (not shown here) over the North Atlantic with a very strong north-eastward
K. Walter and H.-F. Graf: North Atlantic variability structure, storm tracks and precipitation 247
(a) (b)
(c) (d)
Fig. 6. As Fig. 4, but for SVR.
tilt of the storm track axis and reduced precipitation over Western Europe. This situation is consistent with results of Rogers (1997). He showed that one of the two polarities of the leading mode of the North Atlantic storm track variabil-ity corresponds to a blocking high situation, which is not captured by a classic NAO index composite. This empha-sizes the need to consider the state of the polar vortex for describing the atmospheric variability in the North Atlantic region. While a classic NAO index may be appropriate for a statistical description of fluctuations in the lower troposphere (like the advection of warm and cold air masses leading to near surface temperature anomalies), it should not be used for examining processes in higher tropospheric layers – like the propagation of synoptic storms and the precipitation con-nected therewith. A substantial subset of variability will be missed if the dynamic processes in above-tropospheric lay-ers associated with the strength of westerly winds in the po-lar vortex are not considered. Climate forecasts based on a forecast of the NAO and statistical downscaling of its effects would lead to wrong conclusions when the state of the strato-sphere is not taken into account (Castanheira et al., 2002). The dynamical processes behind the results discussed in this paper will be investigated in a forthcoming paper based on an analysis of stream function divergence.
Acknowledgements. This work was supported by BMBF under the
AFO2000 project KODYACS and by the European Commission FW5 Project PARTS.
Edited by: P. Haynes
References
Ambaum, M. H. P. and Hoskins, B. J.: The NAO troposphere-stratosphere connection, J. Climate, 15, 1969–1978, 2002. Andrews, D. G., Holton, J. R., and Leovy, C. B.: Middle
Atmo-sphere Dynamics, Academic press, Orlando, 487, 1987. Baldwin, M. P. and Dunkerton, T. J.: Propagation of the Arctic
Os-cillation from the stratosphere to the troposphere, J. Geophys. Res., 104, 30 937–30 946, 1999.
Baldwin, M. P. and Dunkerton, T. J.: Stratospheric harbingers of anomalous weather regimes, Science, 294, 581–584, 2001. Baldwin, M. P., Cheng, X. H., and Dunkerton, T. J.: Observed
rela-tions between winter-mean tropospheric and stratospheric circu-lation anomalies, Geophys. Res. Lett., 21, 1141–1144, 1994. Black, R. X.: Stratospheric forcing of surface climate in the Arctic
Oscillation, J. Climate, 15, 268–277, 2002.
Blackmon, M. L. and Lau, N.-C.: Regional characteristics of the Northern Hemisphere wintertime circulation: A comparison of the simulation of a GFDL general circulation model with obser-vations, J. Atmos. Sci., 37, 497–514, 1980.
Castanheira, J. M., Graf, H.-F., DaCamara, C. C., and Rocha, A.: Using a physical reference framework to study global circulation variability, J. Atmos. Sci., 59, 1490–1501, 2002.
Castanheira, J. M. and Graf, H.-F.: North Pacific-North Atlantic relationships under stratospheric control?, J. Geophys. Res., 108, Art. No. 4036, doi:10.1029/2002JD002754, 2003.
Charney, J. G. and Drazin, P. G.: Propagation of planetary-scale dis-turbances from the lower into the upper atmosphere, J. Geophys. Res., 66, 83–109, 1961.
Christiansen, B.: Evidence for nonlinear climate change: Two stratospheric regimes and a regime shift, J. Climate, 16, 22, 3681–3690, doi:10.1175/1520-0442(2003)016<3681:EFNCCT>2.0.CO;2, 2003.
Eady, E. T.: Long waves and cyclone waves, Tellus, 1, 33–52, 1949. Feldstein, S. B.: The dynamics of NAO teleconnection pattern growth and decay, Quart. J. Roy. Met. Soc., 129, 901–924, 2003. Graf, H.-F., Perlwitz, J., and Kirchner, I.: Northern Hemisphere tropospheric mid-latitude circulation after violent volcanic erup-tions, Contrib. Atmos. Phys., 67, 3–13, 1994.
Graf, H.-F., Kirchner, I., and Perlwitz, J.: Changing lower strato-spheric circulation: The role of ozone and greenhouse gases, J. Geophys. Res., 103, 11 251–11 261, 1998.
Hartley, D. E., Villarin, J. T., Black, R. X., and Davies, C. A.: A new perspective on the dynamical link between the stratosphereand troposphere, Nature, 391, 471–474, 1998.
Hines, C. O.: A possible mechanism for the production of sun-weather correlations, J. Atmos. Sci., 31, 589–591, 1974. Hu, Y. Y. and Tung, K. K.: Interannual and decadal variations
of planetary wave activity, stratospheric cooling, and Northern Hemisphere Annular mode, J. Climate, 15, 1659–1673, 2002. Hurrell, J. W.: Decadal trends in the North Atlantic Oscillation:
Regional temperatures and precipitation, Science, 269, 676–679, 1995.
Hurrell, J. W. and van Loon, H.: Decadal variations in climate as-sociated with the North Atlantic Oscillation, Clim. Change, 36, 301–326, 1997.
Hurrell, J. W., Kushnir, Y., Ottersen, G., and Visbek, M. (Eds): The North Atlantic Oscillation: Climate Significance and Environ-mental Impact, Geophysical Monograph Series, 134, 279 pp., 2003.
James, I. N.: Introduction to Circulating Atmospheres, Cambridge University press, Cambridge, 422 pp., 1994.
Kalnay, E., Kanamitsu, M., Kistler, R., Collins, W., Deaven, D., Gandin, L., Iredell, M., Saha, S., White, G., Woollen, J., Zhu, Y., Chelliah, M., Ebisuzaki, W., Higgins, W., Janowiak, J., Mo, K. C., Ropelewski, C., Wang, J., Leetmaa, A., Reynolds, R., Jenne, R., and Joseph, D.: The NCEP/NCAR 40-year reanalysis project, Bull. Amer. Meteor. Soc., 77, 437–472, 1996.
Kistler, R., Kalnay, E., Collins, W., Saha, S., White, G., Woollen, J., Chelliah, M., Ebisuzaki, W., Kanamitsu, M., Kousky, V., van den Dool, H., Jenne, R., and Fiorino, M.: The NCEP–NCAR 50-year reanalysis: Monthly means CD-ROM and documentation, Bull. Amer. Meteor. Soc., 82, 247–268, 2001.
Limpasuvan, V. and Hartmann, D. L.: Wave-maintained annular modes of climate variability, J. Climate, 13, 4414–4429, 2000. Matsuno, T.: Vertical propagation of stationary planetary waves in
the winter Northern Hemisphere, J. Atmos. Sci, 27, 871–883, 1970.
Perlwitz, J. and Graf, H.-F.: The statistical connection between tro-pospheric and stratospheric circulation of the Northern Hemi-sphere in winter, J. Climate, 8, 2281–2295, 1995.
Perlwitz, J. and Graf, H.-F.: The variability of the horizontal circu-lation in the troposphere and stratosphere: A comparison, Theor. Appl. Clim., 69, 149–161, 2001.
Perlwitz, J. and Harnik, N.: Observational evidence of a strato-spheric influence on the troposphere by planetary wave reflec-tion, J. Climate, 16, 3011–3026, 2003.
Ramaswamy, V., Schwarzkopf, M. D., and Randel, W. J.: Finger-print of ozone depletion in the spatial and temporal pattern of recent lower-stratospheric cooling, Nature, 382, 616–618, 1996. Raible, C. C., Luksch, U., Fraedrich, K., and Voss, R.: North At-lantic decadal regimes in a coupled GCM simulation, Clim. Dyn., 18, 321–330, 2001.
Reid, P. A., Jones, P. D., Brown, O., Goodess, C. M., and Davies, T. D.: Assessments of the reliability of NCEP circulation data and relationships with surface climate by direct comparisons with station based data, Clim. Res., 17, 247–261, 2001.
Rogers, J. C.: Patterns of low-frequency monthly sea-level pres-sure variability (1899–1986) and associated wave cyclone fre-quencies, J. Climate, 3, 1364–1379, 1990.
Rogers, J. C.: North Atlantic storm track variability and its associ-ation to the North Atlantic Oscillassoci-ation and climate variability of Northern Europe, J. Climate, 10, 1635–1647, 1997.
Shindell, D. T., Miller, R. L., Schmidt, G. A., and Pandolfo, L.: Simulation of recent winter climate trends by greenhouse-gas forcing, Nature, 399, 452–455, 1999.
Thompson, D. W. J. and Wallace, J. M.: The Arctic Oscillation signature in the wintertime geopotential height and temperature fields, Geophys. Res. Lett., 25, 1297–1300, 1998.
Walker, G. T. and Bliss, E. W.: World weather V, Mem. Roy. Mete-orol. Soc. 4, 53–84, 1932.
Wallace, J. M. and Gutzler, D. S.: Teleconnections in the geopo-tential height field during the Northern Hemisphere winter, Mon. Wea. Rev., 109, 784–812, 1981.