HAL Id: hal-00805817
https://hal.archives-ouvertes.fr/hal-00805817
Submitted on 30 Mar 2016
HAL is a multi-disciplinary open access
archive for the deposit and dissemination of
sci-entific research documents, whether they are
pub-lished or not. The documents may come from
teaching and research institutions in France or
abroad, or from public or private research centers.
L’archive ouverte pluridisciplinaire HAL, est
destinée au dépôt et à la diffusion de documents
scientifiques de niveau recherche, publiés ou non,
émanant des établissements d’enseignement et de
recherche français ou étrangers, des laboratoires
publics ou privés.
DETECTION OF GEOMAGNETIC JERKS USING
WAVELET ANALYSIS
M. Alexandrescu, D. Gibert, G. Hulot, Jean Louis Le Mouël, Ginette Saracco
To cite this version:
M. Alexandrescu, D. Gibert, G. Hulot, Jean Louis Le Mouël, Ginette Saracco. DETECTION OF
GEOMAGNETIC JERKS USING WAVELET ANALYSIS. Journal of Geophysical Research : Solid
Earth, American Geophysical Union, 1995, 100 (B7), pp.12557-12572. �10.1029/95JB00314�.
�hal-00805817�
JOURNAL OF GEOPHYSICAL RESEARCH, VOL. 100, NO. B7, PAGES 12,557-12,572, JULY 10, 1995
Deection of geomagnetic jerks using wavelet analysis
Mioara,
Alexa,ndrescu,
x Dominique
Gibert,
2 Ga,uthier
Hulot,
Jean-Louis
Le Mou•l, • and Ginette Sa,ra,cco
2
Abstract. Wa,velet
a,na,lysis
is a.pI•lied
to detect
a.nd
cha,
ra.cte,'ize
singula,
r events,
or singula,
rities, or jerks, in the time series
,,•a,de
of the last centu,-y
monthly
mean
values
of the east component
of the geomagnetic
field fi'om Europea,
n observa.tories.
After choosing
a, wel!-a,da,pted
wavelet
function,
the analysis
is first performed
on
synthetic
series
including
a,n "inte,'na,l",
or 'hnain'.',
signal ma,de
of smooth
variation
intervals
sepa.rated
by singnla,
r events
with different
"regula,
rities", a white noise
and
an "externa.l"
signa.1
ma,de
of the sunt of a few ha,
r,nonics
of a, long-period
va,ria.tion
(11
yea,rs).
The signa.tures
of the ,hain,
noise,
a.nd
ha,rmonic
signals
a,re
studied
and
compared,
and the conditions
in which
the singular
events
ca,n
be clea,rly
isola,
ted in
the composite
signa,1
a,re
elucida,ted.
The,t we a,lq•ly
the n•ethod
systema,tica.lly
to
the
real geoma,gnetic
series
(monthly
meaats
of Y f,'om
Eurolma.
n ol>serva,t.
ories)
a,nd
sl•ow
that five a.nd
only five re•a,,'ka,l•le
events
a.re
fo•nd i• 1901, 1913, 1925, 1969,
and 1978. The cha,ra,cteristics
of these
singula,rities
(i•t l•a,rticula,r,
homogeneity
of
some
derived
functions
of the waarelet
tra.nsibrn•
over a. la.rge
ra,nge
of timesca.les)
demonstra.te
tha.t these
events
ha.ve
a. si•tgle
source
(of course,
inte,'na.1).
Also the
events
a,
re more singula.r
thaa• wa.s
l•reviously
S•l•l•osed
(their "regula,rity"
is closer
to 1.5 tha,n to '2., indica.ting tlta.t noirinteger I•owers of ti•t•e should be used in
representing the time series l•etween the jerks).
Introduction
Tile study of the time-varying geontagnetic fieM ½•l•-
served at the Earth's surface is o•e of the best !•ea,ns
of gaining information about t,l•e core dyna.nfics. On
timescales between a, month and severa,1 centuries [La•-
gel, 1987; Bloxham et ,l., 1989], tl•e •na,in cm•triln•-
tion to this field is the one, known as the "main field",
generated by the geodynamo I)rocess which takes lfiace
within the core. The time va,ria.tions of tl•is field, the
secular va,ria. tion, ma, inly occur (m deca,de a,ml l•,l•ger
timescales, and its tempora.1 sI•ectrmn w• (•rigi•a,lly
thought to be restricted to periods longer thaa• 1 yea. r
(Curtie [1966, 1968] suggested
a. cut,,ff a,t 3.7 y•ars),
the shorter periods being attrilnm•(1 to external s(mrces.
However, it had a.lso been known for some time (a,s early
= Fisk [193•]) that clear so!a,r cycle (11 yea, rs) etthct•
the earlier spectral separation was at least partly in-
correct. These solar cycle effects were investigated and
confirmed by many authors, among them Courtillot and
Le Mou}'l
[1976a,b],
who modeled
the secular
variation
with a smooth parabolic trend and interpreted the resid-
uals • solar-related effects. This model was consistent
Col)yright 1995 l,y the Americmt (.4e•qdtysical l.l•ti(m.
Paper munl•er 95JB0(•314.
0! 48- 0227/95/95 J B-()0314
with the 1947-1967 data, but dif•culties arose with the
data of the late 1960s, leading Courtillot et al. [1978] to
use two successive parabolic trends instead of a single
one. The change of trend oc, curred in 1970 and implied
that contrary to prior belief, the main field could ex-
perience changes on timescales of 1 year or less. This
discovery has since been confirmed by many authors
(see the review by Courtillot and Le Mougl [1988] for a
historical perspective), and the sudden change of trend
is now known as the "1970 jerk" [Malin et al., 1983].
Subsequent studies have focused on the worldwide ex-
tent of the event [e.g., Chau et al., 1981; Le Mou•;l et al., 1982; McLeod, 1992] and its origin [e.g., Alldredge, 1984; Nevanlb,na, 1985; Backus et al., 1987; ,.qtewart
and Whaler, 1992]. Spherical harmonic analysis [e.g.,
Midin and Hodder', 1982; Cubbins, 1984; McLeod, 1985,
1992] are in favor of an internal origin for the jerk, al-
though these analyses do not allow separation of the
main field from those induced in the conducting mantle
by external sources.
In its present accept, ance, the jerk is idealized as a
sudden change in the slope of the secular variation de- fined as the first time derivative of the field. Alldredge
[1984] underlined the possibility that some external sig-
nal might contribute to sharpen the change. Indeed, such a possibility cannot be excluded at once by refer- ring to the previous splterical harmonic analysis since only a small contribution is required. Strong evidence has been presented against this view by Gavor, t et al.
[19861
and Gubbins
and Tomlinson
[1986],
who corre-
lated as much as possible of the observed field with in-
dexes monitoring the external activity. The removal
12,558 ALEXANDR.ESCU ET AL.: ¾VAVELET ANALYSIS OF (.4EOMAGNETIC JERKS
of the corresponding contribution produced a smoother
residual signal nevertheless displaying a very sharp jerk,
implying an event duration shorter than a year.
Alldredge [1984] also discussed the identifica. tion of
the jerk and argued that discontinuities in the second
time derivative of the field are not determined by the analysis but constitute an a priori assurnption. This prompted Backus and Hough [1985] and Backus et al. [1987] to carry out some tests using m•mh smoother fi•nctions to model the main field; they concluded tha.t the jerk model leads to no better but no worse descrip- tion of the data. In their review, Cour'tillot and Le
Mou&'! [1988] give evidence for a slight advantage in fa-
vor of the jerk model which is now generally accepted as
the working model for sudden events in the main field [Stewart, 1991]. Several other such events have been
reported in the literature in 1913 [Ducr'uix et al., 1980],
in 1978 [Gavor'et et al., 1986; Gubbins and Tomlinson,
1986] and at possibly other epochs [e.g., Golovkov et al.,
1989; Stewart, 1991; McLeod, 1992], but none have been
scrutinized with as much intensity as the 1970 event.
The present paper intends to cast a completely differ-
ent light on the subject. Admitting that sudden events
of some unknown nature and at, undefined da, tes ma,y
have occurred in the Earth's geomagnetic field, we wish
to detect and characterize these events independently of any a priori information. Wavelet analysis is suited to
this purpose since it can detect localized events without
requiring a priori assumption. One fi•rther advantage of
this analysis is its special sensitivity to localized events
which we will refer to as singularities and define a,s dis-
continuities of some c• derivative of the signal (•, the
regularity of the singul,[rity, being not necessarily an
integer). If such a singularity
is included
in the siõna.1,
wavelet analysis can detect it, give the time at which it
occurred, a,nd provide a measurement of the regularity
c•. Jerks, from now cleftned a,s a,ny singula, rity occurring
within the main field, can be studied in a more general
way'.
The next, section of this paper describes how the
wavelet, transform can be used to detect, a,nd cha,ra, c-
terize singularities in time series when both noise and
harmonic components are also present, in the dat'a. De-
tailed synthetic examples and nmnerous figures sho•fid
help the reader to evaluate the limits of the method.
The following section presents the Y monthly mean va.1-
ues analysis of the geoma,gnetic field series fi'om 12 Eu-
ropean observatories.
Theoretical Background
Detection of Singularities WitIx Wavelets
In order to make this paper self-consistent, we only
introduce the wavelet transform and recall its main
properties
with respect
to the study of abrnI)t changes
in signals
[Grossma,,n,
1986; Gro,ssmann
et al., 1987].
More recent apI>lications are given by Mallat and Hwa•,g
[1992],
and references
therein.
The reader
interested
in
the wavelet, transform from a, more genera,1 point of view
is referred
to Meyer [1990]
and Dav,
bechies
[1992].
The
wavelet
transform
appeared
as a section
of mathemati.
cal analysis
about
10 years
ago
(see
Meyer
[1990]
for
a
historical
perspective)
after the pioneering
work
of the
geophysicist
Jean
Morlet
[Goupil!aud
et al., 1984]
and
consists in expanding signals upon well-localized oscil-
lating functions called "wavelets". The major charac-
teristic
of the wavelets
is that all members
of a given
wavelet, family are generated by translating and dilat-
inga
given
initial
wavelet,,
•p
(•t)n,
dCalled
the
"analyz-
ing wavelet". The localization characterization of
singularities are best, done with the continuous wavelet
transform which is translation invariant and allows an
optimal focusing on the sharp variations present in the
signal.
We are interested
in detecting
singularities
resulting
from a discontimfity
of the at,
h derivative
of the signal,
a being eventually a noninteger positive number. How- ever, in practice, we will have to deal with "imperfect"
data, and a number of difficulties will arise because ac,-
tual data are both noisy and made not only of singular-
ities. This will generate complications in the analysis
procedure which we need to understand. It is not our
aim to study this problem in the most general case, and
we will make the assumption, realistic in geomagnetic
studies, that, the data series are the sum of a "main
signal"
including
singularities
Whose
regularities
are
t,o
be found, of a "long-period harmonic signal", and of
noise. The analyzed signal is then supposed to have the
following canonical structure
.f (t) -- fi (t - t,,)+ + c (t) + n (t),
(1)
where c (t) is the long-period harmonit.', component, n (t)
is a stochastic process representing the noise present in
the signal, and the distribution [Gel'j'hnd and Shilov,
1962]
(t-t0) t>t0 '
represents the abrupt change of interest with a regular-
ity a and localized at the time t0. For instance, the
singularity
associated
with the Heaviside
function
H
has a regularity a = 0, while those associated with the
Dirac distribution,
• (t) = (d/dr) H (t), •nd the ramp
function,
r' (t) : f H (t) dt have a regularity
a = -1
and a = 1, respectively.
A jerk (in its classical
accel,
rance),
j (t) = f r (t) dr, is such
that,
a = 2.
The formalism of the continuous wavelet transform
was first introduced
by Grossmann
and Motlet [1!)84]
and proved very powerhfi
in characterizing
the fine
structure
of multiscMed
signals
such
as turbulence
data
[Muzy
et al., 1991].
For
the present
study
we
shall
define
the wavelet transform under the form of the convolution product
wf
,,,)
- f ß ½,,
(t),
where
½, (t) = a-•½ (t/a) and a > 0 is the dilation
pa-
rameter.
Provided
the a.
nalyzing
wavelet
;b
(t) is well-
localized
around
t = 0 and has a. vanishing
integral,
the transformation
is invertible
for a large class
of sig-
nals
f (t). Owing
to its intrinsic
zooming
property,
the
ALEXANDRESCU ET AL.- WAVELET ANALYSIS OF (IEOMAGNETIC JERKS 12,559
croscope
both to detect
singularities
and to analyze
the
local
regularity
of signals. Grossmann
[1986]
gives
an
approach
to detect
sing•fiarities
with a complex
ana-
lytical
wavelet,
and indicates
that in the vincinity
of
an isolated sharp variation located at to, the lines in
the timescale halfplane (t, a) where the phase remains
constant converge to the time to when a $ 0. Sharp
variations can also be detected by using the modulus
IWI (t, a)l of the wavelet,
transform
along
these
lines
of constant, phase. An alternative approach using real
wavelets is followed by Mallat and Hwang [1992], who
characterize singularities by studying the variations of
the absolute value of the wavelet, coefficients along lines
of maxima. The method explained in the present, pa-
per is more reminiscent,
of this latter approach.
The
linearity of the wavelet, tra,nsform gives
(t, o,)
+ w,, (t, (,),
(4)
and we will first explore the ways by which the infor- mation characterizing the singularity can be recovered
from
the wavelet,
transform
W (t - •(i)+. The other
two
terms in (4) will be discussed later.
Let us consider that the analyzing wavelet can be ex-
pressed as the nth derivative of an everywhere positive,
localized,
and C •>'• function
d (t). The wavelet
trans-
form of the singularity is
(t)
=
,
= r +
:
(5)
where we used the property [ Gel)rand and Sh, ilov, 1962]
d(•+l
((•)
and assumed •,. > a + 1. Let us now suppose tha. t
1½
('•-"-•)
(t)l possesses
N, maxima
located at the times
(tm•.x,j
; j - 1,'", Nt).
(8)
The
wavelet
transform
modulus
[W [(t- t,,);] (t, a)l
possesses Nt maxima located at, the tithes
{atmax,j
+t0; j - 1,...,Nt}
(9)
which
converge
to t0 when a $ O. The maxima
of the
wavelet, transform modulus arrange themselves onto Nt
lines
{t -- atmax,j
q- t(,; j - 1,... ,Nt},
(10)
which converge toward the time t0 at which the singu-
!arity occurs. We can then define the "ridge fitnction",
rj, as the absolute value of the wavelet transform along
a given line of maxima:
(11) Clearly,
lnrj (a) - alna+lnF (• + 1)+ln I/•l+ln dm•xj. (!2)
This formula shows that when plotted in a log-log dia-
gram, the ridge fimction is a straight line whose slope equals the regularity a. This result is derived by Mal- lat and Hwang [1992] in a slightly different way. This
very distinctive feature arises because singularities are
self-similar events on all timescales.
In the following numerical computations the input signal is evenly sampled with a 1-month interval, which we shall hereafter adopt • the unit of time, and local
maxima are detected by direct comparison with the pre-
vious and next sampling points. Strictly speaking, it is
not permitted to discuss pure singularities for sampled
signals, and we must instead say that at the sampling
resolution, the signal behaves as if it had a discontinuity
at t0, although it is possible that it is continuous but h•
a sharp transition which is not visible at this finite res-
olution. We can only compute the wavelet transform at scales a ) amin, where amin must be such that the nar- rowest wavelet is properly sampled. On the other hand, the finite length of the signals limits the maximum scale am•x available. In practice, this upper boundary is con- trolled both by the limit beyond which convolutional
edge effects become intolera.b!e and by the proximity of
the different singularities present in the signals. The
sampling along the dilation axis is not governed by any
law for this kind of applications of the wavelet trans- form. It must be both fine enough to allow for an easy tracking of the lines of maxima and coarse enough to reduce the computational burden. In the present study, we exponentially sampled the dilation axis with a mul- tiplicity of 20 samples per octave.
If we want to estimate reg•fiarities smaller than a.n integer m, we need a wavelet with at least m vanishing
moments (see equation (5)). A wavelet with m vanish-
ing moments has at least m + i extrema. In order to both reduce the amo•nt of computation and improve the readM)ility of the results, we would like to minimize the number of maxima required to detect the interesting
abrupt changes in the signal. We must choose a wavelet
with as few • possible vanishing moments compatible with the maximum regularity we look for. The results
presented in this study were obtained with the analyz-
ing wavelet
•(t)-- d•exp -•
(13)
shown on Figure 1. Since it possesses three vanish-
12,560 ALEXANDlqESCU ET AL.- WAVELET ANALYSIS OF GEOMAGNETI(", JERKS
-0 5 1
''-'• .... -'2 .... o .... • .... •''
tirae (months)
Figure 1. Graph of the analyzing wavelet used in t, he
present study. This function is the third derivative of a
Gaussian (see equation (13)) and possesses three van-
ishing moments.
study of singularities with c• < 3. Its Fourier transform
(Figure 2),
(14)
possesses
extrema
at, •.• -- -l-•3/2rr and has no signif-
ica.nt energy beyond a cutoff ii'equency •,,: - 0.7 so the wavelets can be sampled at a unit time interval with- out, aliasing error for a >_ amin >_ 1.4. The choice for
the analyzing wavelet, (13) leads to simple algebraic ex-
pressions, but many other analyzing wavelets could be
used. The results obtained are insensitive to the paxtic-
u!ar choice as long as the wavelet, possesses a sufficient
number of vanishing moments [e.g., œacr'!l et aI., 1991].
Let us now look at the way this machinery works by
examining the case study of • canonical signal made up
of several singularities (Figure 3). The modulus of the
wavelet transform of this test, signal is sitown on Figure
4a. Since the wavelet coefficients vary in a wide range,
a gray scale
adapted to the whole IWf
not, enable an easy view of the lines of maxima over the
entire [amin, am•x] range. Following Ar'go,l et al. [1989],
we chose to adapt, the gray scale independently for each
horizontal
line of the IWf (t,,,.)l mp. This allows
-2
-3 ! ,
J ,,
o o. 5 1
fxequency (1/month)
Figure 2. Graph of the Fourier transform of the a,na,-
lyzing wavelet,
(see
equation
(14)) shown
in Figm'e
!.
.• •.s -,-I 0.5
0 .,.:•
I
0 200 400 600 800 1000 1200 140• -• time (months)Figure 3. Synthetic signal with various sin-
gularities. This signal was created according
t,o
s(t) -- 0.2•(t-tl) +0.1H(t-t2) +0.01r
-0.001
(t ,
- •4)+ +0.0001j (t - is) •nd possesses
sin-
gu]a, rities wi[h • - -1, 0, 1, 3/2, and 2 at
{t•, t2, t:•, t4, t,} - {2•, •, 767, •023, •279}, respet-
tively.better tracking of all lines of maxima over the whole dilation range. All wavelet transforms are displayed
cording to this setting. As predicted by the theory, t. he
lines of maxima converge toward the locations of the abrupt change when the dilation parameter decre,es
(Figure 5). The number Nt of lines of ma.xima attached
to a given singularity decre,es when its regularity in-
creases. For a Dirac singularity,
(1,•) and Nt - 4, the numl)er of extrema of the analyzing wavelet (Figure 1). For a jerk,
Wj (t, .)
(16)
and Nt = 1. Generalizing these ca,lculus to the
of noninteger •.• would involve the use of more so-
phisticated
noninteger
derivatives
of functions. We
made
a practical
investigation
of this case
and found
that the number of lines of maxima. corresponding to
a noninteger
regularity
equals
the nmnber
of such
lines
associated
with the nearest smaller integer regularity
A
r, (c•
> - 1) - N, (max
{'•,.
G Z; r,.
_<
r.•
}). Art example
is given
by the sharp
variation
loca.
ted a.t t = 1023
on
Figure
5. It is such
that a, - 1.5 and is associated
ALEXANDRESCU ET AL.- WAVELET ANALYSIS OF GEOMAGNETIC JERKS 12,561 500.0 1000.0 1500.0 ... • '. , t '1' ß I 500.0 1000.0 1500.0 500.0 1000.0 1500.0 500.0 1000.0 1 500 0
Time (months) Time (months)
Figure 4. Absolute value of the wavelet, transforms of the synthetic signals used to check our
methodology. The dilations range from alnin -- ;2 to amax : 64. Largest, values are in light
gray and smallest in heavy gray. (a) Wavelet transform of the "main" syntlletic signal sho•vn on
Figure 3 and made up of pure singularities. Notice tile symmetry of the lilies of maxima excepted
for those attached to the singularity with the non-integer regularity a: 3/2 at f4 : 1023. (b)
Wavelet transform of the "main" synthetic signal shown on Figure 3 pollt•te(t with a Gaussian
white noise with a standard deviation cr'• - 10 -'2 Notice the appearance of numerous lines of
maxima produced by the noise. (c) Wavelet, transform of the composite harmonic signal shown
on Figtire 9. (d) Wavelet transform of the syntlletic signal shown on Figtire 12 and equal to the
sum of the "main" signal •vit, h the composite harmonic signal.
6.0
I
3
4
5
/
o , 500.0 1000.0 1500.0 time (months)Figure 5. Lines of maxi•na extracted fronl the wavele!
transform (Figsire 4a,) of the synthetic signal sllow]l
Figure 3. Notice that tile ntnnber of lilies attached to
a given singularity dc('reases when the regularity i]•-
creases. Lines attaclted to t,l•e singul;trity wit, lta
integer
regularity
are nonsyntme[rical
(see
text, for de-
tails).
with two lines of maxima as in the case of tile singu- larity located at t = 767 for wl•ich ,} - 1. Tire number
of lines of maxinlet is tl•en an indi('ator tbr tl•e possi-
ble range of tlte regularity. Vnrious ridge fin•ctions are shown on Figure 6, and one cnn check tl•at the sloI)eS
are in agreeme•t •vit. l• the tl•eoretical regularities of
singnlarities l)rese•t i•t tlte syntl•etic sig•al.
Adding Noise
In t,l•is section, we ad(lress tire i•tl•tence ot'noise. Tlte
wavelet tra•mtbrm Ilr• (/,a) of tl•e noise is a stocl•as-
tic process, and ass•t•tti•tg that t.l•e i•tl•ut •toise is white
'2 the line;it-
Gaussian with zero •nea• and varian('e
ity of tl•e wavelet transloren ensures that t l•is process is
also Gmmsian with a variance
(,,) -
(I ,
8 .,
Tl•is exj,l'essiol• sJiows l,l•a.t tile w)ria. ll('e oJ' IY'n (Z,.), which is also the va, ri;l•l('e of IVf (t,o), decreases like
12,562 ALEXANDRESCU ET AL.' WAVELET ANALYSIS OF GEOMAGNETIC JERKS 0- i I • I 'l] I ' I I [ .... I 2 • 4 5 6 4 5 6 O- I [ I i I [ I i' I 2 3 4 5 6 0- -10 -10 - • I • I • I • I • I I t • I • I • I • 1 1 2 3 4 5 6 2 3 4 5 6 Log•(dilation) Log•(dilation)
l*igure 6. Log-log
plot,
s of t,
he ridge functions
associ-
ated wit, h t, he labeled lines of maxima shown on l*igure5. These curves accurat.ely fit st, raight. lines whose slopes
are t.he t.heoret, ical regularit.ies of t, he abrupt changes
present,
in t.he synthet.ic
signal
shown
in Figure 3.
a -• when the dilation a increases. Therefore, as a in-
creases,
the t,
ypical
amplit,
ude of t,
he noise
decreases
like
a -•/2 and in t, he vincinit, y of a singularit, y wit.h c• >-1/2, the signaM,
o-noise
rat,
io increa,ses
like a
EventalMly,
6.0
wl >>
..,,)
w
>>
,,,:),
where
ac
is ,• corner
dilation
corresponding
t.o
a signal- 5.0
t.o-noise
rat.io
of
the
order
of 1. The
precise
va,lue
of
t.his •' 4.0
corner
dila,t,
ion depends
of course
on t,
he variance
cr•, t.he :•
reõularit,
y and st,
rength
of the singnlarit,
y. Conversely,
•
for small
dilat,
ions,
t,
he v,xriance
will be large
and
• 3.0
<< .,.)
(t. <<
' ' -- : 2.0
We then expect,
• twofold
behavior
for t,
he lines
of max-
ima and ridge
funct,
ions
corresponding
t,o a singnlarit.y 1 O- I :l I I : I I I
wi•h a > -1/2' •hey will be essent,
i•lly controlled
by
•he noise for smM1 dilat, ions and by the det, erminist.ic
signal
for large
ones.
In t,
he case
of a singularit,
y wit.h
regularit,
y a < -1/2 (such
as a Dirac
singularity)
the
conclusion
is just the opposit,
e: noise
will be responsi-
ble for •he behavior of t.he lines of maxima and ridgefunctions when •he dilation is large, and the determin.
istic signa,1 will show tip only for small dilations. Of
course, in bot, h cases, t, het, ransit, ion bet.ween the
terminist.ic and noise-relat, ed behaviors will be all the
clearer t, hat, a is more different, from t, he critical value
c• = -1/2. Figure 4b shows the wavelet, t.ransform of
the synt, het, ic signal aft.er addit.ion of a Gaussian whit, e
noise
wit,
h rrn
2 - 10
-4 (of t,
he order
of t.he
noise
found
in
real dat,
a). •'igures
7 and 8 show
•he associat.ed
lines
of
maxima
and ridge
funct,
ions. As can be seen,
alt,
houõh
a
very large number of new lines of maxima arise, almostall of t, hese lines fail t.o reach dilat.ion value 2 '•. In addi-
tion, all corresponding new ridge functions have smaller
absolut.e
yahres
t,
han t,
hose
associat.ed
wit,
h t,
he singular-
it.ies (see, for inst.ance, ridge fimct.ion 6 on l•igure 8). In fact,, t, he main effect, of noise appears t,o be t, he distor-t, ion of t.he st, ill det.ect.able singularit, y-related lines of
maxima and ridge funct, ions. The weakest, of these can
be seriously pert.urbed, as is t, he case wit.h some of the
lines associat, ed wit.h t,he singularit, ies at, t, imes tl = 255
and t4 = 1023 (Pigtire
7) and as will also
usually
be the
case wit, h t, he weak addit, ional line of maxima we expec.,•
t.o find when the regularit.y paramet.er a is not, far be-
low an int,eger value (t, he closer a is below such a value,
the weaker is t.he addit, ional line). There will nevert, h.• less always remMn ,st, least one main line of maxima
and the corresponding ridge tuner, ion which will follow
apatt, ern t.hat, can easily be relat,ed t,o t, he t,heoret, ical
considera. t, ions seen before. •'or inst, ance, t,his pattern
is very clear for ridge fitnct, ions 3, 4 and 5 correspond-
ing t,o rv = 1, 1.5, 2. A corner
dilation
a,: can indeed
be
found, t, he noisy part, of t, he fnnct, ions having t, he ex-pected
shaky
negat,
ive slope
of about,
-1/2, while
t,
he
par• cont,
rolled
by t.he
det,
erminist.ic
component.
is only
very slight,
ly pert.urbed.
Ridge
funct.ions
1 and 2 illus-
t.rat, e t, wo sit, nat.ions when t, he scale of dilat.ions used for
•he cornput,
at,
ion of t,
he wavelet,
t,
mnsform
is not,
wide
enough
t.o clearly
det,
ect,
t,
he corner
dilat,
ions. In t,
he
case
of ridge funct,
ion 2, t,
he st,
able slope
which
is dif-
ferent,
from -1/2 indicat,
est,
ha.t
we are dealing
wit,
h t,
he
det.erminist,
ic part, of t,
he funct,
ion and t.hat,
t,
he corner
dilation
is larger t,
han 2 '• The shaky
but, close
t,o-1
3 4
[ I ] [ , , [ I [
500.0 1000.0 1500.0
time (months)
•'igure
?. Lines
of'
ma,xima
ext,
ract,ed
from
t,
he
wavelet,
transform
(Pigtire
4b) of t,
he noisy
synt,
het,
ic signal.
ALEXANDRESCU ET AL.: WAVELET ANALYSIS OF GEOMAGNETIC JERKS 12,563 0- -lO 0- 1 5 I i I • I ,4. 5 6 [ I [ I I I • I I 1 2 • 4 5 6 -10- 1 0- - _ - _ - _ _ _ -10- i 1 o- _ _ . - _ -10-- i 1 I I I I I I I I I 2 3 4 5 6 , , ] I [ I ] I I I I I I I I i I [ I [ 1 1 2 3 4 5 6 2 3 4 5 6 Log2(dilation) Log=(dilation)
Figure 8. Log-log plots of the ridge functions associ- ated with the labeled lines of maxima shown on Figure
7 extracted from the wa.velet transform (Figure 4b) of
the noisy signal. The slopes found for lines 1, 2, 3, 4,
and 5 are a - -1.18 and -0.02 for a _> 2 and a - 1.12, 1.47, and 2.0 for a >_ 23, respectively. Ridge fi•nction 6 is entirely due to noise.
slope of the ridge fitnction 1 corresponds to the situ-
ation when we observe the transition between the two deterministic and noise-related behaviors. In such a sit-
nation it will not be possible to derive a precise value for
the regularity of the singularity. From the previous con-
siderations we conclude that in practice one should not
rely on the number of lines of maxima to estimate the
regularity of a singularity. Rather, and as was already
suggested in the previous section, one should only con-
sider
the most significant
lines
of maxima,
focus
on the
behavior
of the corresponding
ridge
fimctions,
look for
clear linear portions, and find out the values of the
responding slopes. This then allows a proper estimate
of the regularity
of the singularity,
assuming
the signal
is made
of pure singularities
and noise.
This, however,
is not exactly
the case
since
long-period
harmonic
com-
ponents contribute to the signal in geomagnetic series.
We
therefore
now need
investigate
the effec.
t of adding
such
components
to the main signal.
Adding Long-Period Harmonic Components
Let us now consider the case when c (t) (recall equa-
tion (1)) is made of long-period harmonic components.
The transform of a pure sinusoidal component reads
exp - •
cos
(20)
and it, s modulus is maximum foralong any line • = co'nsi in the (t, a) plane. Equation
(21) allows for a correspondence between dilations,
and harmonic frequencies, 1/T. As a first step, we. an-
alyze a composite signal (Figure 9) made of harmonic
components with periods T = 11, 5.5, 3.7, and 1 years
corresponding to log.• aT = 5.2, 4.2, 3.6, and 1.73, re-
spectively, this choice being motivated by the geomag-
netic data we will analyze next. Also, the relative phas-
ing between the four sinusoids has been adapted to give
the composite signal the appearance of a sawtooth sig-
nal. This choice has been made in order to analyze the most singular signal possible which can be created with
the four harmonic components cited above. The wavelet
transform (Figure 4c) of this signal is an int, erference
pattern between the different transforms (20), although
complex this pattern possesses lines of maxima with a
typical fork-shaped motif in the Iw(;(t,a)[ map (Fig-
ure 10). The ridge fimctions of these lines often possess
maxima very near the aTs, although these maxima may
interfere
const,
ructively to give "plateaus"
(Figure 11).
In any case, and as could easily be expected from equa-
tion (20), all ridge fi•nctions sharply decrease beyond
the dilation aT = 2 •'•, corresponding to the largest pe-
riod present in the composite signal, a distinctively dif-
ferent, behavior from the one (linear in a log-log scale)
we previously described for the ridge fimctions associ-
ated with singularities.
0.02 0.01
o
-o. Ol -0.02 200 400 600 800 1000 1200 1400 time (months)Figure 9. Composite harmonic signal made up of four
sinusoids with periods T = 11, 5.5, 3.7, and 1 yea.r
and respective amplitudes AT -- 0.01, 0.005, 0.005, and
12,564 ALEXANDRESCU ET AL.- WAVELET ANALYSIS OF GEOMAGNETIC JERKS 6.0
•3.0
o2.0
o .5
o lO ß i i i • i lill i i lil]ll 1 500.0 1000.0 1500.0 time (months)Figure 10. Lines of ma, xima of the wavelet transform
modulus (Figure 4c) of the composit, e harmonic signa,1
(Figure 9).
The possibility of recovering information about the. singularities in the main signal when it, is perturbed by
the harmonic signal can t, hen be invest, igat, ed by analyz-
ing the superimposition of the two signals (Figure 12).
Relative amplitudes are conformed to real geomagnetic data. A quick glance at, Figure 14 in view of Figures 6
and 11 suggest, s a rather straightforward ident, ifica, tion
of the various features due t,o t, he main signM and the
harmonic signal, respectively. A similar ident, ifica, t, ion
is also suggested for t, he lines of maxima (compare Fig-
tires 5, 10, and 13). It, is like.ly t, ha.t, those whi(:h overla.p
on t, het, ypical fork-sha,pe.d rnotif are related to the ha, r-
monic signal, wherea,s those which have "deep" roots
are related to t, he main signal. The interact, ion bet, ween
t, he main signal and the harmonic signal leads t,o the
vanishing of several ma,xima lines, while some remain-
ing lines of maxima branch from a line associaf, ed wit, h
one signal t,o a, line associated wit, h the other signa.1.
Identification a, nd int, erpret, a.t, ion of the lines of maxima
in t, he combined signal must, therefore be ca,tried o•t,
with some care.
Classification of the Synthetic Ridge Functions
The previous synthetic exa, mples show tha,t the sin-
gularities, ra, ndom noises and harmonic components ca.n
• I t I • I I I I I 1 2 3 4 5 6 Log•(dilatlon) -S.O-
,..
'•.•i
-.
. -'7.5 - I I s I i' I I I I I 1 2 3 4 5 6 Log•(dilation)Figure 11. Log-log
plots of the ridge htnctions
associ-
ated with the labeled lines of maxima shown on Figure
10.
0 200 400 600 800 1000 1200 1400
Zime (months)
Figure 12. Signal made up of the sum of the main
signal
(Figure
3) with the composite
harmonic
signal
(Figure 9).
produce ridge functions whose more or less complicated
shapes depend on the relat, ive balance bet, ween these
three
kinds
of signals
forming
t,
he dat,
a (equation
(1)).
We now need t,o elaborate some criteria, t,o safely decide
whet, her or not a given ridge function is mainly created
by a singularity.
R,elying
on roles played
by the signal
components considered in t, he previous three sections,
the ridge functions can be classified into three types:
Type 1 is for ridge fimct, ions displaying a posit, ive lin-
ear trend (i.e. c• > 0) for most of the dilation range and
especially
for a > 2 '•'u. A limit,
ed small-dilation
range
can'event, nelly be controlled by t, he harmonic signal {as
illustrated on Figure 14 by the ridge fimcf, ions 9, 10, 13,
14, and 16, when no noise is present), t, he random noise
(for ridges
3, 4, and 5 in Figure 8), or more generally
by a combination of t, he two. R,idge fimct, ions of type 1
may safely be considered as mainly due to singularities.
Type 2 corresponds to ridge fitnotions having a wob-
bling pat, tern (cases 1, 4, 8, 11, and 15 in Figtire 14) and
possibly
displa,ying
a. sha,
rp decrease
for a > 2 '•'2 (c•qes
4, 8, and 11 in Figure 14), f, ypica,1 of ridge illnot, ions
caused
by lla,rnaonic
components
(see eqna,
t,
ion (20)).
6.0• 4.0- •3.0- _ 2.0--
3 5 6 7
10 13 14
500.0 1000.0 time (months) 6 1500.0Figure 13. Lines
of maxima
of t,
he wavelet
transform
modulus
(Figure
4d) of t,
he signal
made
up of the su-
perimposit,
ion of the main signal
and of t,
he composite
ALEXANDRESCU ET AL.: WAVELET ANALYSIS OF GEOMAGNETIC JERKS 12,565
o
o•
o
13 -• -s 5 s 16
-
I
[ ' I[l I i I III i :':li'•'l'["'
2.5 5.0 2.5 5.0 2.5 5.b 2.5 5.0
0 0 0
9 -s
I [ ["l t"] iii : •-s
i i i11 -s - •,
I li[l[ [ i Fi'[2
i2.5 5.0 2.5 5.0 2.5 5.0 2.5 5.0 o o o -s 6 -s
'5
I
II
2,5 5.0 2.5 5.0 2,5 5.0 2.5 5.0 ll[ri]•ll•i 2.5 5.0 Log,(dilation) o o o-5
I-5 ' ::
IIIi••11
i -5
I IllJllllJll ß•.• &O •.• $.0 •.• •.0
Log•(dilation) Log•(dilation) Log•(dilation)
Figure 14. Log-log plots of the ridge fimctions associated with the labeled lines of maxima
shown on Figure 13. Line 2 is associated wit. lt the Dira.c singularity, lines 5 and 6 correspond
to the Heaviside event,, lines 9 and 10 are for t, he ra,mp singula.rity, line 13 is related to the
singularity with a = 3/2, and line 16 is a.ssoci•d, ed with the jerk. The slopes found for these
lines
are.
(_t
- -1.29 (2 •'4 < a _<
23's),
a, - 0.11
(a _>
2), •, - 0.0$
(a.
>_
2), c• - 0.99 (a _>
2•'s),
•- 1.0!)
(a >_
2u"•),
a
, - 1.42 (a >_
22'8),
a.nd
a,- 2.01 (u >_
22'7),
respectively.
The influence of a random noise is limited to the sma.ll
dilations and rioes not, destroy the overall pattern of the ridge functions. This type of ridge functions will be principally due to the harmonic component.
Type 3 is for cases not, clearly falling in either type 1
or 2. This will be especially tl•e case for ridge functions
caused by singularities with (• •_ 0 (c•es 5 and 6 in Fig-
ure 14) or by harmonic components (case 3 in Figure
14). Ridge functions mainly due to the harmonic sig-
nal and lacking
the characteristic
decrea,se
for a > 2
because of the influence of a nearby singularity are also
encountered (cases 7 and 12 in Figure 14). Ridge func-
tions
displaying
a linear trend with a negative
slope
(i.e.,
a < 0, case 2 in Figure 14, or case 6 in Figure 8) also
fall into type 3 since they cannot, be safely attrilmt, ed
to either a noisy singularity or to pure noise (compare
c•es 1 and 6 in Figure 8).
Froin a practical point of view, detecting and a,na,lyz-
ing a singula,rity will consist in looking fbr ridge
tions
of type 1 and studying
its littear portion. As
consequence also, only singu!a, ries with ½• > 0 can
expected to be recovered.
Real Data Analysis
We now apply the wavelet a. nalysis to real geomag-
netic series. Of course, possible ma,n-made singularities
introduced by poor baseline control or poor ,correction
for change of site may Mso be detected. As we wish not
to confuse them with geophysically significant events, data series from several i•tdependent and nearby obser-
vatories are processed in pa.rallel. We therefore decided
to process the data fi'om European observatories only
(Figure 15). As the jerks in Europe are. particularly
clear on the Y (east) component of the field (which is
also the component the lea,st a,ffected by the externa,1
field) [Cour'tillot
a•,d Le MouE!,
1988; Stewart,
1991],
we shall in this pa.per focus on Y. We shall also put
a special emphasis on Cha'mbøn-la'-Før•t data since we
have ea,sy access to their fitll history.
Processing of the Chambon-la-For&C series
The data series of the ntonthly mea, n values of the
12,566 ALEXANDRESCU ET AL.- WAVELET ANALYSIS OF GEOMAGNETIC JERKS 60' riO' 30' •93Y •oo' $•o' -3000 -4000 , _
19UO 192U 1940 19bU 19'80 '•
time (years)
Figure 16. Data series of the Y component for the
Chambon-la-For6t observatory.
Figure 15. Location of the 12 geomagnetic observa-
tories whose series of monthly mean vahms of the Y component, are used in this study.
a time interval of more titan a century (from 1883 to December 1992; see Figure 163. Since the
ginning of its activities, the observa, tory moved fi-o•
the Parc St,. Maur (1883-19003 to the Val Joyeux (1,901-
19353,
and is currently
fixed at, Cha.•nbon-la-For•t
19353. The whole series h;•.s been reset, to tl•e Chaml•cm-
la-For•t reference level with great care. The lnont, hly
means analyzed here a,re a.verages of a.ll hourly •neaat
values of e•,.ch n,onth wit,|tmtt a,]ty ren•oval of'I•ertnrl)ed periods.
The wavelet •naI) (Pla.te 1, CLF) reveals five (:o•spic-
nons events of large a.•nI•lit,'ude fbr epochs 1901, 191:t,
1925, 1969, and 1978 for which jerks lta. ve previo•sly
been recognized. These jerks have been shown to be worldwide except, the o]te in 1925 which seems to
restricted to the E•aropea. n area [Gir½ et rd., 1984].
merous events of s•na.ller amplitude are visible towards the small dilations and arra,nge themselves into a pat-
tern very reminiscent of the one obtained fbr the ana. l-
ysis of the synthetic signal made up of harmonic con•- ponents (Figure 4c). This is particularly clear in the quiet period froIn 1925 to 1969 where no strong event appears and confirms the results obtained by Ix'er'ridge.
and Barmclough [1985]. Figure 17 represents the 14
lines of maxima which go beyond
a = 2 '•, and the cor-
responding ridge fhnctiolts are displayed in Figure 18
where one can recognize tlte three basic tyIfica.1 styles
discussed in the preyfinis section. Type 1, cha.racteristic.
of pure singularities (see ridge ill]tot, ions 4 and 5 in Fig-
tire 83, applies
to ridge timorions
1, 2, 4, 13, and 14 in
Figtire 18. Type 2, c}•a.racteristic of the ridge timorions
of the synthetic signal ma. de up of harmonic comI)o-
nents (Figure 113, a,pplies to ridge f•mc. tions labelled ?,,
5, 6, 9, 11, and 12 in Figtire 18. Type 3 a. pplies to the
ridge functions 7, 8, al•d 10. Therefbre the five strong
events which we previonsly described a.s being rela. ted
to published jerks a, re obvio•lsly created by singulari-
ties. The slopes of the linear pa.rts of the correspondi]tg
ridge fimctions are well-determined and fall in the in-
t,
erval [1.47,
1.65],
depending
upon t,
lie particular
ridge
fum:tion choseit. Titis iml>ort, alit restilt, (to be discussed
later) already shows that the detected singularities are
not, jerks as us•la.lly defined (i.e., with r•: 2) but, in-
stead, more singular eveiris.
Results for Other E,n'opean Observatories The monthly mean valises of the Y co•nponent of the
other 11 observatories (Figtire 153 coifsidereal in this
study were provided by the Natiol•al Geophysical Data
Center (Boulder, Colorado) olt the cm•tI,act disk (CD-
R.OM) labeled NGDC-05/1. For some observatories the
data series edited by the \Vorld Data Center present
several gaps. I,, s•('lt sit.•:,.tions tl•e •no•tthly 111e•tll val-
ues edited by tl•e obserwttory itself' (e.g., in their year-
books) were added. Gaps for which n()data conhi
obtained h'ol•t tlte ye•rl)()oks were filled i•t l)y a linear
il•terl)olatio•. No ga. I, longer tha.n (i months was ac-
cepted. Havi•g maximized both the lengtlt and con-
tinuity of the timeseries, we noticed that in some in-
stances, corrections to the inst, rmnental baselines were
still required. •Ve perfondled a, crossvalidation of the an-
nual mean values (:Omlmted from monthly means with
the annual n,ean valnes obtained from tlte •Vorld Dat, a
Center. It, appeared that in some cases, corrections for
known inst, run•enta,1 changes had been applied to an-
nual mean values but not to monthly mean values. Nu-
merical comparison of the two annual mean data sets
allowed the proper corrections to be made. When it ap-
peared
thai, some
timeseries
would
still possibly
contain
undetected changes in the base level, fi•rther informa-
tion was requested
directly
from the observatories
and
used to complete these timeseries.
The wavelet
maps of these 11 series
are displayed,
together
with the one corresponding
to Chambon-la-
Forat
(CLF) (Plate 13. The common
axis
scales
allow
for easy
comparison
of the pictures,
and one
can
read-
ily check
that whenever
a, data record
is long
enough,
strong
events
can be fbund
at the same
dates
as for
CLF. A rough
dating
of the five main events
can
be
obtained
by picking
tlte dates
along
their lines
of •nax-
ima at, the dilation
a = 2 a's, which
corresponds
t,o
the
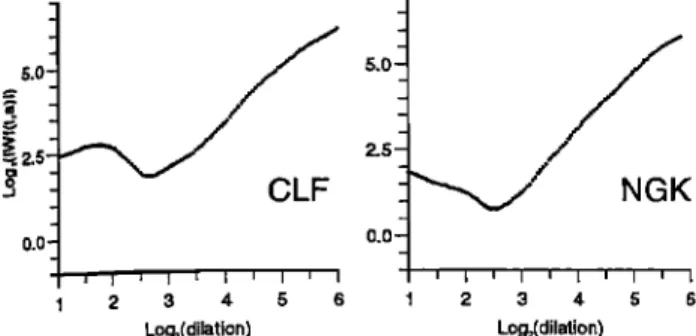
ALEXANDRESCU ET AL.' WAVELET ANALYSIS OF GEOMAGNETIC JERKS 12.567 6.0 5.0
3.0
2.0 1.0 6.0 5.0 2.0 1.0 6.0 5.0 2.0 1.0 1.0 ESK 6.0 -I WNG 6.0 PAG 5.0 5.0 4.0 4.0 3.0 3.0 2.0 ' i 2.0 i; 1.0 1900.0 1925.0 1950.0 1975.0 1925.0 RSV 6.0 5.0 1950.0 1975.0 LER 1.06.0-
!
5.0 1950.0 SOD 1975.0 4.0 4.0 3.0 3.02.0
,1
2.0
1900.0 NGK ' ' ' I 3 1.0 I 1 1.0 1925.0 1950.0 1975.0 1925.0 1950.0 1975.0 1950.0 6.0 HAD 6.0 -I FUR 1975.0 5.0 5.0 4.0 4.02.0
'
2.0 I •
I
1.0 '
n 1.0 • • ! 1900.0 1925.0 1950.0 1975.0 1925.0 1950.0 1975.0 1950.0CL
6.0
GD
6.0
-I WIT
1975.0 5.0 5.04.0 I 4.0
2.0, ,
1'
1.0
1.0
"
1900.0 1925.0 1950.0 1975.0 1925.0 1950.0 1975.0 1950.0 1975.0Time (years) Ta'ne (yeers) Ta'ne (years)
'i- '-i
Pla•e 1. Modulus
of the wavelet
transform
of the Y series
for the 12 European
observato-
ries:
Chambon-la-For&t
(CLF),
Eskdalemuir
(ESK),
Furstenfeldbruck
(FUB.)
Godhavn
(GDH),
Hartland
(HAD),
Lerwick
(LER),
Niemegk
(NGK),
eanagyurishte
(PAG),
•ude
Skor
(RSV),
12,568 ALEXANDRESCU ET AL.- WAVELET ANALYSIS OF GEOMAGNETIC JERKS 5,0-- .o 4.0- o _ 2.0-- 1.0 1
113
14 1900.0 1925.0 1950.0 1975.0time (years) CLF-Y
Figure 17. Lines of ma, xima of the wa,velet tra,nsibrrn
modulus of the Chambon-la,-For•t series shown on Plat, e
1, CLF. Only the lines running beyond
a - 2 • are dis-
played.
transition
between
the pa,rt
of the ridge
timorion
domi-
nated
by the external
signa,1
and
f,
he one
c,
ontrolled
by
the
abrupt
cha.
nges.
Such
a criterion
gives
the
following
average
dates:
1901.3
(1), 1913.5
(2), 1925.7•0.72
(4),
1969.3
• 0.38 (12), and 1978.0
• 0.13 (11) where
the
va,lue
is for one st,
anda,rd
deviation
and the integers
parentheses
indica,
te the nmnber
of observatories
to derive these figures.
The 1901
event
detect,
ed at CLF ca,nnot
be clearly
seen at any other observatory beta,use of the shortness
of t,
he da,
ta series. Only the la,
te edge
of an energy
packet,
can be seen
in the w•velet,
ma.p
of the Niemeg•
series around 1900-1910 and for dil•t, ions 24 < a < 2 (Plate 1, NGK).
The 1913 event is clearly fmmd in the CL• and NGI(
wa,velet maps a,nd corresponds t,o a, t, rmma, ted one in the
B,SV wavelet map (Figure IR,SV). The ridge fimctions for this event, are shown in Figure 19 and clearly are
type 1. The linea, r beh•[vior of the ridge fimction for
NGK is excellent,
beyond
a - 22'• and gives
a slope
r• - 1.66. This linear trend is less peri•ct for the CLF ridge fimction which aI)pears more affected by the ex-
2.5 5.0 2.5 5.0 9 0 •0 0 I I I I 2.5 5.0 2.5 5.0 I I I I 2.5 5.0 2.5 5.0 •0 0 i 2.5 5.0 2.5 5.0 Log,•(dilation) Log,(dilation) 5 5 0 0 • • • i • • • • i • • i'• S'l" • • • • i • • 2.5 5.0 2.5 5.0 5 5 0 0 2.5 5.0 2.5 5.0 5 5 2,5 5.0 2.5 5.0 Log•(dilation) Log.,(dilation)