HAL Id: inserm-00452525
https://www.hal.inserm.fr/inserm-00452525
Submitted on 11 May 2010HAL is a multi-disciplinary open access archive for the deposit and dissemination of sci-entific research documents, whether they are pub-lished or not. The documents may come from teaching and research institutions in France or abroad, or from public or private research centers.
L’archive ouverte pluridisciplinaire HAL, est destinée au dépôt et à la diffusion de documents scientifiques de niveau recherche, publiés ou non, émanant des établissements d’enseignement et de recherche français ou étrangers, des laboratoires publics ou privés.
Impact of Mouse Model on Pre-Clinical Dosimetry in
Targeted Radionuclide Therapy
Samir Boutaleb, Jean-Pierre Pouget, Cecilia Hindorf, André Pèlegrin, Jacques
Barbet, Pierre-Olivier Kotzki, Manuel Bardiès
To cite this version:
Samir Boutaleb, Jean-Pierre Pouget, Cecilia Hindorf, André Pèlegrin, Jacques Barbet, et al.. Im-pact of Mouse Model on Pre-Clinical Dosimetry in Targeted Radionuclide Therapy. Proceed-ings of the IEEE, Institute of Electrical and Electronics Engineers, 2009, 97 (12), pp.2076-2085. �10.1109/JPROC.2009.2026921�. �inserm-00452525�
Impact of Mouse Model on Pre-Clinical Dosimetry in Targeted Radionuclide Therapy
Samir Boutaleb1,2, Jean-Pierre Pouget1,3, Cecilia Hindorf4, André Pèlegrin1, Jacques Barbet2, Pierre-Olivier Kotzki1 and Manuel Bardiès2,4
1 IRCM, Institut de Recherche en Cancérologie de Montpellier; INSERM, U896; Université Montpellier1; CRLC Val d’Aurelle Paul Lamarque, Montpellier, F-34298, France; 2 Institut de Recherche Thérapeutique, Centre de Recherche en Cancérologie Nantes/Angers U892 ; Nantes, F-44093, France
3 IRSN, Fontenay aux roses, F-92260 France
4 Ecole Nationale Vétérinaire, Nantes, F-44307 France
This work was supported by the “Comité de l’Hérault de la Ligue Nationale de Lutte Contre
Abstract
Introduction: Small animal dosimetry serves as an important link in establishing a relationship between absorbed dose and biological effect during pre-clinical targeted radionuclide therapy. Dosimetric approaches reported to date are based on models aiming at representing the animals used during pre-clinical experiments. However, anatomical variations between models may generate differences in the dosimetric results. Our goal was to assess the impact of the mouse model on the absorbed dose per cumulated activity (S value, in Gy per Bq.s).
Methodology: Two datasets were considered. The first one was developed in our laboratory and is a voxel-based model of a 30g female nude mouse. Images were segmented manually to identify more than 30 organs and sub-organs. The second dataset originates from the DIGIMOUSE project. In that model, a 28g normal male nude mouse was used to generate the segmented structures of 9 regions in the head and 12 major organs.
A software developed in our laboratory allowed us to read each 3D mouse atlas slice by slice, to crop the mouse volume to remove background air voxels, and to write the geometry description as an input file for the Monte-Carlo code MCNPX using “repeated structure representation”. A linear interpolation scales the voxel size as a function of the total body mass.
Results: The comparison of various voxel-based mouse dosimetric models shows that even when scaled to the same total-body mass, models from different mouse breed or gender demonstrate very different organ masses, volumes, and therefore S values.
Conclusions: Computation of the S values for pre-clinical studies depends strongly on the definition of the mouse model. Our computational model is a step in the direction of a more realistic description of the geometry in pre-clinical dosimetry.
Keywords: Dosimetry, Monte-Carlo simulation, Small Animal, Targeted
INTRODUCTION
Targeted radionuclide therapy (TRT) is a cancer treatment modality in which a biologic vector conveys a radioactive isotope to the neighborhood of cancer targets, thus concentrating radiations with the ultimate goal of selectively irradiating tumor cells [1]. The vector can be the nuclide itself, as is the case in the treatment of differentiated thyroid cancer with 131-iodine. The vector can be a monoclonal antibody targeting antigens specific to cancer cells (thus defining radioimmunotherapy), a metabolite or a peptide. The radionuclide must preserve the targeting specificity by emitting short range radiations. Beta emitters are usually used for this purpose, even though the potential of alpha or Auger emitters is being considered [2]. Targeted radionuclide therapy has demonstrated its potential in the therapy of radiosensitive non-Hodgkins B-lymphoma [3]-[4], melanoma [5] or neuroendocrine tumors [6].
Small animal dosimetry serves as an important link in establishing a relationship between absorbed dose and biological effect (toxicity or efficacy) during pre-clinical targeted radionuclide therapy.
The absorbed dose can be derived according to the MIRD formalism [7]:
€
D (k←h )= ˜ A h⋅ S(k←h )
where
€
D (k←h ) is the mean absorbed dose in gray (Gy) to the target k from radiation
emitted by the source h,
€
˜
A h is the cumulated activity in becquerel-seconds (Bq.s) in the source region h and
€
S(k←h ) is the mean absorbed dose in gray per becquerel-second (Gy/Bq.s) to the target
k per unit cumulated activity in the source h (or S value).
As can be seen from the above equation, absorbed dose calculation requires both the cumulated activity and the S value to be determined.
The cumulated activity is usually determined from measurements of activity in organs/tissues at different time points after injection of a radiopharmaceutical. Animals are sacrificed and dissected and the organ/tissue is weighed and measured for activity thus yielding the mean/standard deviation of activity concentration at various time points. The selected animals are usually of the same age and strain for better homogeneity of the results. The cumulated activity is calculated as the time integral of the activity as a function of time after the injection.
Computational phantoms based on a realistic anatomy are needed to quantify organ average absorbed doses [8]. Several authors have proposed murine S values, using stylized phantoms (mathematical models) [9]-[12] and more recently anatomical voxel-based models [13]-[15]. This is an important step since, contrary to the situation in clinical dosimetry, the range of the ß particles involved in TRT is of the same order of magnitude as the dimensions of the small animal organs and tissues of interest. S values should therefore not be calculated under the assumption that ß radiation is non-penetrating (the absorbed fraction equals 1). An explicit model of radiation transport has to be considered for most organ/tissues of interest in murine dosimetry. In addition, even in situations where the activity distribution is homogeneous within source organs, the absorbed dose distribution is likely to be heterogeneous because of the finite range of the beta particle, thus warranting a voxel-based absorbed dose calculation.
Since cumulated activities are obtained by averaging measurements obtained from several animals, it is usual to consider S values obtained from a reference mouse or rat model, rather than on the specific animal that has been used for the experiment. Still, several arguments questioning the relevance of the murine model have been raised including:
- Different strains of mice yield animals of different sizes and shapes. Organ geometries might be affected, thus producing different S values. It is
therefore important to use S values that have been developed for the animal strain considered in the study, or to be able to adjust S values computed for a given animal model to a more relevant one.
- Tumor models cannot be explicitly integrated within a “reference” mouse model. Tumor dosimetry must therefore be considered separately.
More recently, quantitative imaging has paved the way for longitudinal studies [16], allowing the pharmacokinetics to be determined for each individual animal. The accuracy of such an approach remains to be ascertained. Operational issues such as the ability to sequentially anesthetize the same animal safely, or to fuse images obtained at different time points with accuracy on par with the spatial resolution of the imaging devices have to be addressed [17]. The radiation burden resulting from the sequential use of microCT is generally not lethal, but the absorbed dose levels may be sufficient to induce deterministic effects that could confound the biological outcome of the experiment [18]. Still, it must be considered that animal-specific pharmacokinetics are or will be available within the near future from micro imaging devices (micro-PET/CT or micro-SPECT/CT). In that context, the relevance of model-based dosimetry may have to be reconsidered: If cumulated activities can be obtained for a given animal, then on principle the absorbed dose should be determined for the animal itself rather than for a model, unless it can be proven that using a model does not impact the dosimetric results markedly.
Absorbed dose calculations can be performed using different approaches. Monte-Carlo codes can be used to follow radiation transport and score energy deposition. When compared to less refined approaches such as Dose Point Kernel convolutions, Monte-Carlo approaches have the advantage of being able to correctly account for the heterogeneous materials (soft tissue, bone, lung, air) present within animal bodies. The price to pay (independently of the inherent complexity of most Monte-Carlo packages available to the scientific community) is
that Monte-Carlo-based calculations usually require intensive computing capabilities, thus restricting the adoption of the approach to a limited number of laboratories.
The main goal of this work was therefore to assess the impact of anatomical variation on murine S values. Two murine dosimetric models developed in our laboratory were considered. Our models were scaled to other models presented in the literature, so that S values could be compared for different mouse models of the same total body-weight.
MATERIALS AND METHODS
Model definition
This work exploited two 3D segmented datasets created according to the following protocol: A mouse was embedded into a frozen block which was then mounted on the moving table of a cryo-microtome and sectioned into 100 µm slices. High-resolution digital photographs were taken of each section. The first dataset was developed by Bitar et al. in our laboratory [13]. It is based on a 30 g Naval Medical Research Institute (NMRI) female athymic nude mouse. Manual image segmentation led to the identification of 30 regions (organs and sub-organs). Original data was stored in the tiff format, with each pixel index number representing an organ or sub-organ (bladder wall, bladder content, left and right limb bones, brain, colon, heart, left and right kidney medulla, left and right kidneys cortex, liver, left and right lungs, bone marrow in femurs and legs, left and right ovaries, pancreas, skull, small intestine, spleen, spinal cord, stomach wall, stomach contents, left and right suprarenal glands, thyroid, uterus, vertebrae, fat, and carcass). Additionally, tumors have to be inserted into this geometry to represent particular pre-clinical conditions [19].
The second dataset originates from the Digimouse project [20] and is based on a 28 g normal nude male mouse. The 3D atlas, initially designed for brain imaging, is composed of 9
brain regions and 12 other organs (whole brain, external cerebrum, cerebellum, olfactory bulbs, striatum, medulla, massetter muscles, eyes, lachrymal glands, heart, lungs, liver, stomach, spleen, pancreas, adrenal glands, kidneys, testes, bladder, skeleton and skin). The complete dataset is available on http://neuroimage.usc.edu/Digimouse.html.
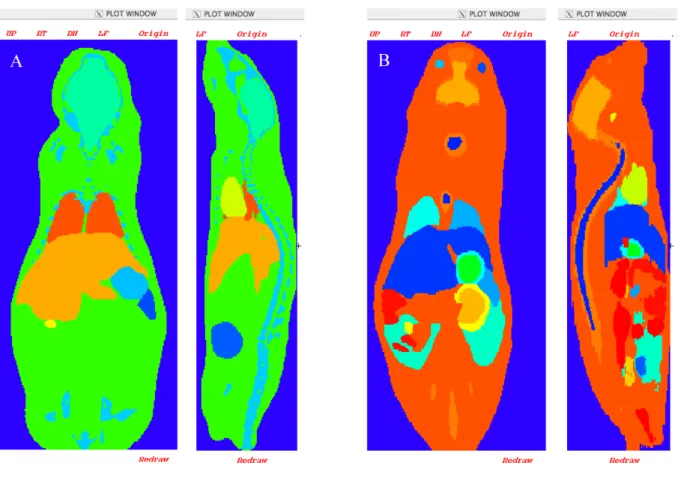
Fig. 1 presents an axial and a sagital view of the two murine models considered in this study: The Digimouse male-model (Fig. 1A) and the Bitar et al. female-model (Fig. 1B).
<Figure 1>
In this study, our results were compared with data published previously by Stabin et
al. [14] and Larsson et al. [15]. The model considered by Stabin et al. is a transgenic mouse
(body mass 27g), imaged using a dedicated small-animal CT scanner (256 x 256 x 256 matrix with voxel size 0.2 mm). Identified organs were segmented from the CT slices (kidneys, liver, lungs, spleen, heart, stomach, intestines, skeleton, testes, and bladder). The second study used the Moby phantom [21], based on a segmented C57BL/6 mouse (body mass 33g). 3D magnetic resonance microscopy (MRM) was used to create non-uniform rational b-spline (NURBS) representing the organ shapes. A matrix of 128 x 128 x 432 elements with a voxel size of 0.25 mm was generated. Organ masses for that anatomical atlas were calculated by Taschereau et al. [22] in order to derive absorbed doses for use within the context of 18-fluorine compounds used in PET imaging experiments.
Our two mouse datasets were down-sampled to match the scale of the other models [14], [15]. The female phantom was stored in a matrix of 220 x 450 x 111 voxels of 0.222 x 0.222 x 0.2 mm3. The nude male atlas was stored using 190 x 496 x 104 matrix elements, with a voxel size of 0.2 mm. Tissue densities and chemical composition were taken from ICRU report 44 [23], except for the bladder wall, bladder content, colon, small intestine, stomach
wall and stomach contents, which were obtained from Woodard et al. [24]. Table 1 summarizes the characteristics of the models considered in this study and Table 2 provides the density references used for each model.
<Table 1>
<Table 2>
MCNPX Monte-Carlo simulations
The previous work published by Bitar et al. was performed using the MCNP4c2 Monte-Carlo code [26]. However, more recent versions of MCNP and MCNPX 2.5 [27] have implemented new features, such as scoring and source sampling using a repeated structures representation that increases computing performance for voxel-based geometries. In order to check the consistency of the results produced by the two versions of the code, we first computed S values with the two codes while keeping the geometrical model and isotope data constant.
We calculated S values from absorbed energy distributions obtained with the Monte-Carlo N-Particle MCNPX transport code. All simulations were run on a MacBookPro (Apple) 2.16 GHz Intel Core 2 Duo with 3 GB RAM. A variance reduction technique was used and all particles transported from a region of higher importance (organ regions) to a region of lower importance (background air voxels) underwent a geometry splitting with Russian roulette [26]. Preliminary tests insured that implementing variance reduction did not modify the end results. Each mouse organ was simulated as a radiation source, assuming a uniform activity distribution in each. Radionuclide energy spectra were taken from ICRP 38 [28]. The number of histories was chosen so as to keep the statistical uncertainties below 3%.
Variations between different mouse models
The models considered in this study are based on different mouse strains, but have similar masses, viz.: 30 g for the female athymic nude mouse, 28 g for the normal nude male mouse, 27 g for the model proposed by Stabin et al. and 33 g for MOBY (Table 1). In order to reduce the influence of the global volume of each model studied, we decided to scale the various models to the same total mass.
For that purpose, an interactive editing tool was developed specifically: “model generator”. The software’s main goals are the fast and automatic generation of an input file for the Monte-Carlo code (MCNP or MCNPX) used to simulate radiation transport and score energy deposition. The tool reads the 3D atlas slice by slice and crops around the mouse volume to remove background air voxels. A label associates each voxel to a defined tissue type, with a density value and a material description. The whole body mass is entered into the model generator. Voxel dimensions are then scaled linearly to create a new dataset corresponding to the total body mass required. The model generator allows indexing and counting of organ voxels. Organ masses are obtained by multiplying the number of voxels associated with the tissue type by tissue density and voxel volume. The model generator ultimately creates the MCNPX input files from the atlas data.
To make a comparison with the results of studies by Stabin et al. and Larsson et al. the absorbed fractions for 100-keV photons originating from the liver, and 1-MeV electrons originating from the lungs, were calculated for our 2 models (the male nude mouse from Digimouse and the female nude mouse from Bitar et al.) :
1. Male-model and female-model scaled to 27g (Table 3) and compared to the results presented by Stabin et al.
2. Male-model and female-model scaled to 33g, and compared to the results presented by Larsson et al (Table 4).
3. In order to compare the results obtained from our 2 models, 131I S values were calculated for the female-model scaled to 30g and compared to the results presented by Bitar et al. (Table 5). Additionally, S values for 131I were generated from the original Digimouse model (28 g) and compared to the results obtained from the same male-model scaled at 30g (Table 6).
All comparisons were made on a subset of organs identified in all models: liver, skeleton, stomach, kidneys, lungs, heart, spleen, pancreas, bladder, testes (for males [14], [15], [20]), ovaries (for female [13]) and the remainder of the body.
<Table 3>
<Table 4>
RESULTS
Comparison of S values from MCNP4c2 Versus MCNPX
Our approach using the model generator was compared to previously published result, with the same voxel-based model [19] but different MCNP code versions. As an example, Table 7 shows the S values of three source/target organ combinations (kidneys, lungs and liver) for 131-iodine. The differences in the S values (Gy/Bq.s) were less than ± 2%. Additionally, the gain in terms of computing speed was greater than 50% as compared to original MCNP4c2 runtimes. Since both simulations were run on the same hardware/operating system, this computing efficiency increase can be attributed to the
implementation of variance reduction techniques and algorithmic improvements introduced in recent MCNP versions [29].
<Table 7>
Impact of mouse weight
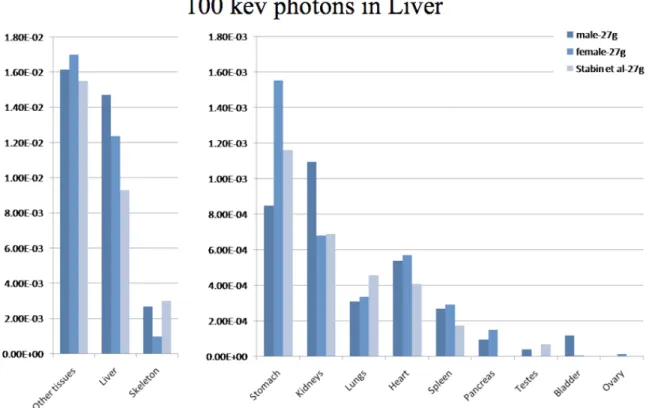
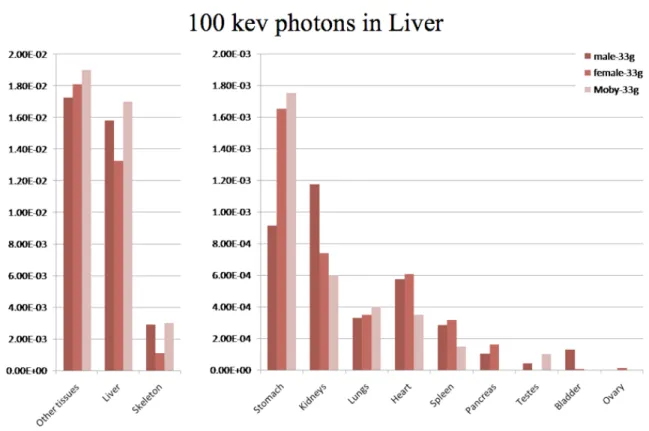
Fig. 2 and 3 present the absorbed fractions (AFs) obtained by Monte-Carlo modeling for 100 keV photon sources located in the liver for the dosimetric mouse models considered in the study:
Our two models (female-model proposed by Bitar et al. and male-model from Digimouse) were scaled to 27g using our model generator in order to match the total weight of the mouse model proposed by Stabin et al., and then scaled to 33g in order to match the total weight of the mouse model proposed by Larsson et al. As can be seen from tables 2 and 3, the scaling process did not entirely compensate for the differences in organ weights observed with different mouse strains or gender. This translates into varying AFs, even for models of an equivalent total mass. The self-absorbed fractions (liver to liver) were significantly different (1.47E-2, 1.24E-2 and 9.32E-3) for the 27g models (Fig 1) and closer (1.58E-2, 1.33E-2 and 1.7E-2) for the 33g models (Fig 2), and generally followed liver mass variations. Cross-absorbed fractions also varied markedly between models, except for some combinations where target organ masses were close (liver to kidneys for Bitar’s and Stabin’s models in Fig. 2, liver to heart for Digimouse and Bitar’s model in Fig. 2 and 3).
<Figure 2>
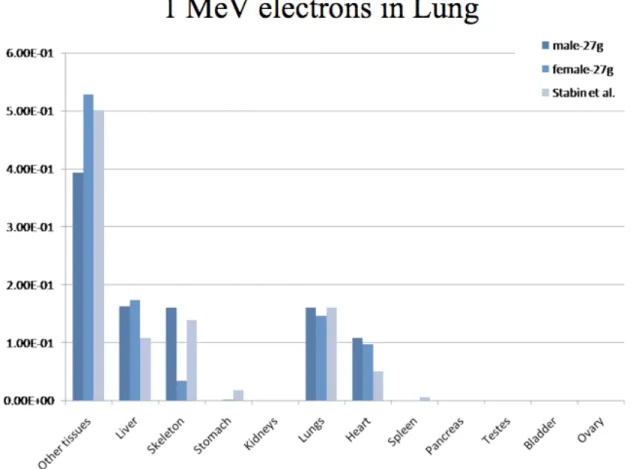
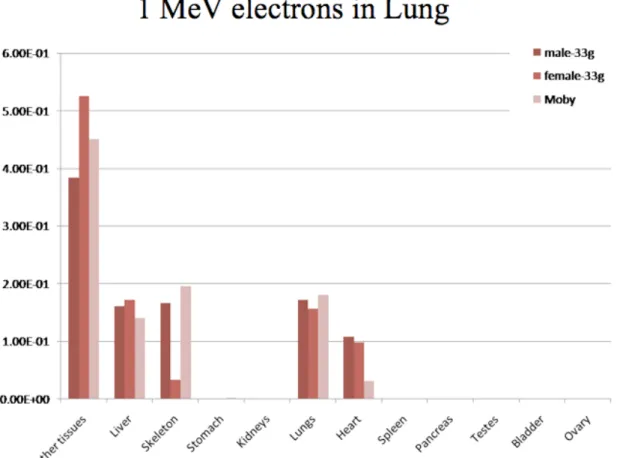
Fig. 4 and 5 represent the absorbed fractions obtained by Monte-Carlo simulation for 1 MeV electron sources located in the lungs for the dosimetric mouse models considered in this study. Values lower than 1E-4 were set to zero on the graph. Self-absorbed fractions were usually similar between models, a fact that can be explained by the smaller range of electrons in tissues. Cross-absorbed fractions varied between models (for example in the case of lung to heart, or lung to skeleton), a fact that can be explained by the different methods used to segment datasets. Additionally, it must be stressed that the ribs and sternum (i.e. skeletal bones near the lungs) were not segmented in the model of Bitar et al..
<Figure 4>
<Figure 5>
Table 5 shows the ratios of the S values generated by two models of the same strain (nude mouse) with the same whole body mass, post-scaling. The Digimouse voxel-based model was scaled using the model generator from 28g to 30g in order to match the female-model total body mass. The differences in organ masses before scaling were important (0.134g vs. 0.123g for lungs, 2.64g vs. 1.83g for liver and 0.652g vs. 0.754g for kidneys), and the transformation from a 28g to a 30g model did not compensate for the original differences. The resulting differences in terms of S values were very pronounced (between 7.47 and 43.13%). Indeed, organ size and shapes do differ between the two models, as can be seen from the visualization of the phantoms in Fig. 1 (A and B).
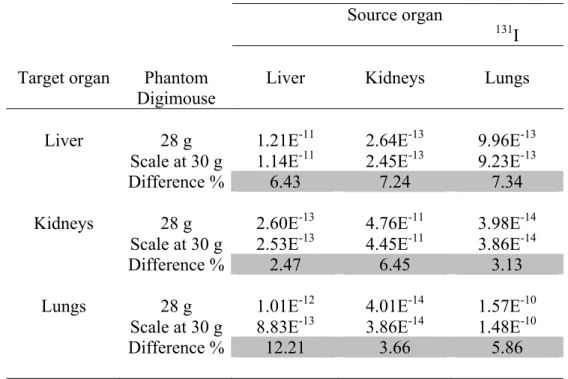
Table 6 compares 131-Iodine S values from the original male mouse model (28 g) against S values for the same model scaled to 30 g. The total-body mass scaled model demonstrates different organ masses, volumes, and shapes.
<Table 5>
<Table 6>
DISCUSSION
The model-based mouse dosimetry literature has been recently extended by the presentation of three voxel-based models representing different mouse strains (Stabin et al. [14], Bitar et al. [13] and Larsson et al. [15]). In this work, we also introduced a male nude mouse dosimetric model based on the Digimouse atlas [20].
Since it has been shown previously that varying mouse sizes may lead to important S values variations [12] we developed a mouse model generator that scales a given model to a predetermined total mass, and generates a MCNPX input file in order to reduce computation times by eliminating segmentation stage. However, it appears that the linear total-body mass scaling does not correctly model the variations in organ size, shape and location. Consequently absorbed fractions or S values obtained from the various scaled models can be very different.
In addition to differences in strain or gender, the production of the voxel representation of the various models was not equivalent: Stabin’s model was obtained from microCT slices of a living animal, segmented with standard image processing tools available on a commercial workstation. No reference to the original animal strain was given in the article. The transgenic nature of the mouse considered in Stabin’s study may explain the
unusually low weight of the liver (0.78g). MOBY’s original dataset was obtained from images of a living animal (using MRI), whereas our two dosimetric models were obtained by manual segmentation of cryosections of a dead animal. Imaging and segmentation methodologies, combined with differences in original strains and gender probably all contribute to the observed variations in organ shape and mass, even for total-body mass scaled models. Interestingly, even very similar models (Digimouse and Bitar’s model) with similar original total-body weights (28g and 30g) still demonstrate quite different organ masses.
This raises several questions regarding the relevance of “reference models” for mouse dosimetry.
If the purpose of a given study is to compare the dosimetry of different isotopes (for example high vs. low energy beta emitters), then the use of a similar geometry – hence a reference mouse model – to perform the comparison is probably wise.
In all other situations, the dosimetric model should match as closely as possible the geometric characteristics of the mouse strain of interest for the study. A linear transformation such as that conducted in our study may not be sufficient to “adapt” a single model to different mouse strains.
Some further issues should be investigated. First, animals selected for a given pre-clinical experiment are usually chosen from amongst mice of the same age and strain. The study of the variation in organ masses and shape in a similar animal batch is underway in order to determine if a “representative” mouse from the experimental batch may be used as a reference for dosimetric studies. This might lead to a range of “representative” mouse models, a possibility that can be considered due to current computation capabilities and the finite number of animal strains used in pre-clinical experiments. Another area to explore is the possibility of adapting our model generator to give a correct interpolation between mice from
the same strain but differing in age, or even between mice from different strains. This would require implementing more advanced registration methods than linear interpolation. As an alternative, adapting NURBS-based phantoms, like MOBY for example, is certainly worth consideration.
Mouse-specific dosimetry is yet another possibility to explore. In that situation, mouse specific biokinetics obtained from sequential quantitative imaging would be used to derive absorbed dose estimates for every animal under investigation. As was seen in the introduction of this article, real mouse-specific dosimetry still represents a scientific challenge, for many reasons. However, as far as the absorbed dose calculation alone is concerned, the use of state of the art Monte-Carlo codes such as those used in our study, that couple sound and reliable radiation transport physics with dedicated algorithms to increase computation speed in a voxel-based geometry is becoming a viable option. Computation times required to perform whole-body absorbed dose calculations are now of the order of hours using commercially available computers, a value that can easily be reduced by the use of computer clusters that are remarkably efficient for “embarrassingly parallel problems” such as those involved in absorbed dose calculations.
CONCLUSION
In a previous publication, we introduced a voxel-based dosimetric model of a female nude mouse [13]. In the current article, we present a nude male mouse dosimetric model. A software tool was developed to facilitate the creation of additional murine dosimetric models based on our two original datasets by scaling the total-body mass. However, comparison between our models and those presented by other authors demonstrates that even total-body mass scaled models exhibit different organ masses, volumes, and shapes. This obviously leads to variations in calculated S values. Additional work is in progress to determine if, within the
same strain and for animals of the same age, geometric variations between samples for the same experimental batch are small enough to warrant the generation of a representative mouse dosimetric model, for a given type of pre-clinical experiment. A possible alternative would be to use image-based mouse geometry and pharmacokinetics to derive mouse-specific absorbed dose calculations. This certainly is feasible from a computing perspective. Still, mouse-specific dosimetry needs to be validated as a viable option for pre-clinical experiments.
AKNOWLEDGMENT
References
[1] J.F. Chatal and C.A. Hoefnagel, “Radionuclide therapy,” Lancet, vol. 354, Sep. 1999, pp. 931-935.
[2] J. Pouget, L. Santoro, L. Raymond, N. Chouin, M. Bardiès, C. Bascoul-Mollevi, H. Huguet, D. Azria, P. Kotzki, M. Pèlegrin, E. Vivès, and A. Pèlegrin, “Cell Membrane is a More Sensitive Target than Cytoplasm to Dense Ionization Produced by Auger Electrons,” Radiat. Res, vol. 170, Aug. 2008, pp. 192-200.
[3] R.L. Capizzi, “Targeted radio-immunotherapy with Bexxar produces durable remissions in patients with late stage low grade non-Hodgkin's lymphomas,” Trans Am Clin
Climatol Assoc, vol. 115, 2004, pp. 255-72.
[4] R.M. Macklis, “Radioimmunotherapy as a therapeutic option for Non-Hodgkin's lymphoma,” Semin Radiat Oncol, vol. 17, Jul. 2007, pp. 176-83.
[5] Y. Miao and T.P. Quinn, “Peptide-targeted radionuclide therapy for melanoma,” Crit Rev
Oncol Hematol, vol. 67, Sep. 2008, pp. 213-28.
[6] V.J. Lewington, “Targeted radionuclide therapy for neuroendocrine tumours,” Endocr
Relat Cancer, vol. 10, Dec. 2003, pp. 497-501.
[7] R. Loevinger, T.F. Budinger, and E.E. Watson, Mird Primer for Absorbed Dose
Calculations.
[8] H. Zaidi and X.G. Xu, “Computational anthropomorphic models of the human anatomy: the path to realistic Monte Carlo modeling in radiological sciences,” Annual Review of
Biomedical Engineering, vol. 9, 2007, pp. 471-500.
[9] T.E. Hui, D.R. Fisher, J.A. Kuhn, L.E. Williams, C. Nourigat, C.C. Badger, B.G. Beatty, and J.D. Beatty, “A mouse model for calculating cross-organ beta doses from yttrium-90-labeled immunoconjugates,” Cancer, vol. 73, Feb. 1994, pp. 951-7.
[10] A.A. Flynn, A.J. Green, R.B. Pedley, G.M. Boxer, R. Boden, and R.H. Begent, “A mouse model for calculating the absorbed beta-particle dose from (131)I- and (90)Y-labeled immunoconjugates, including a method for dealing with heterogeneity in kidney and tumor,” Radiat Res, vol. 156, Jul. 2001, pp. 28-35.
[11] K.S. Kolbert, T. Watson, C. Matei, S. Xu, J.A. Koutcher, and G. Sgouros, “Murine S factors for liver, spleen, and kidney,” J Nucl Med, vol. 44, May. 2003, pp. 784-91. [12] C. Hindorf, M. Ljungberg, and S. Strand, “Evaluation of parameters influencing S values
in mouse dosimetry,” J. Nucl. Med, vol. 45, Nov. 2004, pp. 1960-5.
[13] A. Bitar, A. Lisbona, P. Thedrez, C. Sai Maurel, D. Le Forestier, J. Barbet, and M. Bardies, “A voxel-based mouse for internal dose calculations using Monte Carlo simulations (MCNP),” Phys Med Biol, vol. 52, Feb. 2007, pp. 1013-25.
[14] M.G. Stabin, T.E. Peterson, G.E. Holburn, and M.A. Emmons, “Voxel-based mouse and rat models for internal dose calculations,” J. Nucl. Med, vol. 47, Apr. 2006, pp. 655-9. [15] E. Larsson, S. Strand, M. Ljungberg, and B. Jönsson, “Mouse S-factors based on Monte
Carlo simulations in the anatomical realistic Moby phantom for internal dosimetry,”
Cancer Biother. Radiopharm, vol. 22, Jun. 2007, pp. 438-42.
[16] M.P. Tornai, R.J. Jaszczak, T.G. Turkington, and R.E. Coleman, “Small-animal PET: advent of a new era of PET research,” J. Nucl. Med, vol. 40, Jul. 1999, pp. 1176-1179. [17] I.J. Hildebrandt, H. Su, and W.A. Weber, “Anesthesia and other considerations for in
vivo imaging of small animals,” ILAR J, vol. 49, 2008, pp. 17-26.
[18] S.K. Carlson, K.L. Classic, C.E. Bender, and S.J. Russell, “Small animal absorbed radiation dose from serial micro-computed tomography imaging,” Molecular Imaging
and Biology: MIB: The Official Publication of the Academy of Molecular Imaging, vol.
[19] A. Bitar, A. Lisbona, and M. Bardiès, “S-factor calculations for mouse models using Monte-Carlo simulations,” Q J Nucl Med Mol Imaging, vol. 51, Dec. 2007, pp. 343-51. [20] B. Dogdas, D. Stout, A.F. Chatziioannou, and R.M. Leahy, “Digimouse: a 3D whole
body mouse atlas from CT and cryosection data,” Physics in Medicine and Biology, vol. 52, 2007, pp. 577-587.
[21] W.P. Segars, B.M.W. Tsui, E.C. Frey, G.A. Johnson, and S.S. Berr, “Development of a 4-D digital mouse phantom for molecular imaging research,” Mol Imaging Biol, vol. 6, Jun. 2004, pp. 149-59.
[22] R. Taschereau and A.F. Chatziioannou, “Monte Carlo simulations of absorbed dose in a mouse phantom from 18-fluorine compounds,” Med. Phys., vol. 34, Mar. 2007, pp. 1026-1036.
[23] ICRU Report 44: Tissue Substitutes in Radiation Dosimetry and Measurement, Bethesda, MD: 1989.
[24] H.Q. Woodard and D.R. White, “The composition of body tissues,” Br J Radiol, vol. 59, Dec. 1986, pp. 1209-18.
[25] I.G. Zubal, C.R. Harrell, E.O. Smith, Z. Rattner, G. Gindi, and P.B. Hoffer, “Computerized three-dimensional segmented human anatomy,” Med. Phys., vol. 21, Feb. 1994, pp. 299-302.
[26] J. F. Briesmeister, “MCNP - A General Monte Carlo N-Particle Transport Code --- Version 4C,” Los Alamos, NM: Los Alamos National Laboratory Report LA-13709-M, 2000.
[27] J.S. Hendricks, G.W. McKinney, L.S. Waters, T.L. Roberts, H.W. Egdorf, J.P. Finch, H.R. Trellue, E.J. Pitcher, D.R. Mayo, and M.T. Swinhoe, “MCNPX extensions version 2.5. 0,” Los Alamos, NM: Los Alamos National Laboratory Report LA-UR-04-0570, 2004.
[28] “Radionuclide transformations. Energy and intensity of emissions. Report of a Task Group of Committee 2 of the International Commission on Radiological Protection on data used in ICRP Publication 30,” Ann ICRP, vol. 11-13, 1983, pp. 1-1250.
[29] S. Chiavassa, M. Bardies, D. Franck, J. Jourdain, and J. Chatal, “Computer Time (CPU) comparison of several input file formats considering different versions of MCNPX in case of personalised voxel-based Dosimetry,” presented at the proceedings of the Advanced Mathematical and Computational Tools in Metrology and testing (AMCTM), Caparica, Portugal Jun. 2005.
Figure 1. Axial and sagital views of (A) Digimouse scaled at 30 g, and (B) original (30 g) Bitar et al. model (B) using MCNP viewer tool.
Table 1. Characteristics of the models considered in this study.
Reference Bitar et al. [13] Digimouse [20] Stabin et al. [14] Larsson et al. [15]
Mouse strain Female Nude Male nude Transgenic C57BL/6
Mouse weight 30-g 28-g 27-g 33-g
Matrix size 220 x 450 x 111 190 x 496 x 104 256 x 256 x 256 128 x 128 x 432 Voxel size (mm) 0.222x0.222x0.2 0.2x0.2x0.2 0.2x0.2x0.2 0.25x0.25x0.25
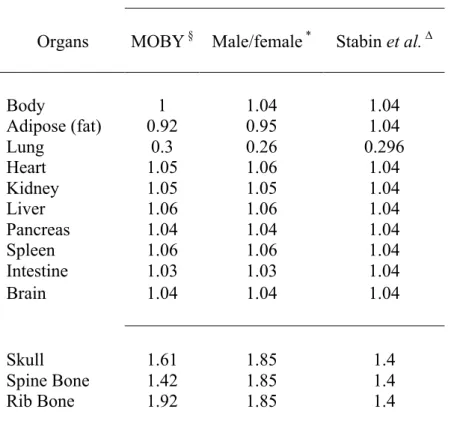
Table 2. Density of mouse tissue (g/cm3): § Data from log Moby; * Data from ICRU44; ∆ Data from Zubal et al. [25].
Density tissue (g/cm3) of models
Organs MOBY § Male/female * Stabin et al. ∆
Body 1 1.04 1.04 Adipose (fat) 0.92 0.95 1.04 Lung 0.3 0.26 0.296 Heart 1.05 1.06 1.04 Kidney 1.05 1.05 1.04 Liver 1.06 1.06 1.04 Pancreas 1.04 1.04 1.04 Spleen 1.06 1.06 1.04 Intestine 1.03 1.03 1.04 Brain 1.04 1.04 1.04 Skull 1.61 1.85 1.4 Spine Bone 1.42 1.85 1.4 Rib Bone 1.92 1.85 1.4
Table 3. Scaled masses of the male and female mouse models considered in the study. The total mouse masses is set to 27g, i.e. that of Stabin’s model.
Organ mass (g) for Phantoms at 27-g Scaled male Scaled female Stabin et al. [14] (Nude normal) (Nude NMRI) (Transgenic) Organ Liver 2.373 1.596 0.780 Stomach 0.264 0.382 0.298 Kidneys 0.586 0.338 0.334 Lungs 0.121 0.107 0.125 Heart 0.264 0.246 0.143 Spleen 0.164 0.189 0.022 Testes 0.176 / 0.141
Table 4. Scaled masses of the male and female mouse models considered in the study. The total body masses are set to 33g, i.e. that of the model used by Larsson et al. [15] (Moby).
Organ mass (g) for Phantom at 33g Scaled male Scaled female Moby [13] (Nude normal) (Nude NMRI) (C57BL/6)
Organ Liver 2.901 1.951 2.69 Stomach 0.323 0.466 / Kidneys 0.717 0.413 0.415 Lungs 0.148 0.131 0.13 Heart 0.323 0.300 0.12 Spleen 0.201 0.231 0.13 Testes 0.215 / 0.4
Table 5. S values (Gy/Bq.s) for 131I, generated for the original model proposed by Bitar
et al. and for Digimouse scaled to 30g.
Source organ
131I
Target organ Phantom Liver Kidneys Lungs
at 30-g
Liver Bitar et al. 1.60E-11 3.41E-13 1.53E-12 Digimouse 1.14E-11 2.45E-13 9.23E-13 Difference % 29.10 28.13 39.76
Kidneys Bitar et al. 3.42E-13 7.51E-11 4.95E-14 Digimouse 2.53E-13 4.45E-11 3.86E-14 Difference % 25.99 40.73 21.11
Lungs Bitar et al. 1.55E-12 5.05E-14 1.59E-10 Digimouse 8.83E-13 3.86E-14 1.48E-10 Difference % 43.13 23.62 7.47
Table 6 S values (Gy/Bq.s) for 131I, generated for the original Digimouse model 28 g and the same scaled to 30g.
Source organ
131I Target organ Phantom Liver Kidneys Lungs
Digimouse
Liver 28 g 1.21E-11 2.64E-13 9.96E-13 Scale at 30 g 1.14E-11 2.45E-13 9.23E-13 Difference % 6.43 7.24 7.34 Kidneys 28 g 2.60E-13 4.76E-11 3.98E-14
Scale at 30 g 2.53E-13 4.45E-11 3.86E-14 Difference % 2.47 6.45 3.13 Lungs 28 g 1.01E-12 4.01E-14 1.57E-10
Scale at 30 g 8.83E-13 3.86E-14 1.48E-10 Difference % 12.21 3.66 5.86
Table 7. Comparison of 131I S values (Gy/Bq.s) obtained by MCNP4c2 and MCNPX 2.5 for the Nude NMRI model.
Source organ
131I
Target organ MCNP Liver Kidneys Lungs
version
Liver MCNP4c2 1.60E-11 3.40E-13 1.56E-12 MCNPX 1.60E-11 3.41E-13 1.53E-12 Difference % -0.18 -0.07 1.77
Kidneys MCNP4c2 3.41E-13 7.48E-11 4.93E-14 MCNPX 3.42E-13 7.51E-11 4.95E-14 Difference % -0.34 -0.43 -0.50
Lungs MCNP4c2 1.58E-12 4.96E-14 1.58E-10 MCNPX 1.55E-12 5.05E-14 1.59E-10 Difference % 1.73 -1.91 -0.93
Figure 2. Comparison of absorbed fractions from 100-keV photons originating from the liver, as calculated by the dosimetry model of Stabin et al. and models of this work: male mouse (Digimouse) and female scaled to 27-g.
Figure 3. Comparison of absorbed fractions from 100-keV photons originating from the liver, as calculated by the dosimetry model of Larsson et al. (Moby) and models of this work: male mouse (Digimouse) and female scaled to 33-g.
Figure 4. Comparison of absorbed fractions from 1-MeV electrons originating from the lung, as calculated by the dosimetry model of Stabin et al. and models of this work: male mouse (Digimouse) and female scaled to 27-g.
Figure 5. Comparison of absorbed fractions from 1-MeV electrons originating from the lung, as calculated by the dosimetry model of Larsson et al. (Moby) and models of this work: male mouse (Digimouse) and female scaled to 33-g.