DOI 10.1007/s00421-013-2783-8 ORIGINAL ARTICLE
Hypoxia refines plasticity of mitochondrial respiration
to repeated muscle work
Dominique Desplanches · Myriam Amami · Sylvie Dupré‑Aucouturier · Paola Valdivieso · Silvia Schmutz · Matthias Mueller ·
Hans Hoppeler · Roland Kreis · Martin Flück
Received: 27 July 2013 / Accepted: 25 November 2013 / Published online: 11 December 2013 © The Author(s) 2013. This article is published with open access at Springerlink.com
vastus lateralis muscle, collected pre and post a single
exercise bout, and training, were assessed for levels of tran-scripts and proteins being associated with mitochondrial metabolism.
Results Hypoxia specifically lowered the training-induced
expression of markers of respiratory complex II and IV (i.e. SDHA and isoform 1 of COX-4; COX4I1) and preserved fibre cross-sectional area. Concomitantly, trends (p < 0.10) were found for a hypoxia-specific reduction in the basal oxygen consumption rate, and improvements in oxygen repletion, and aerobic performance in hypoxia. Repeated exercise in hypoxia promoted the biogenesis of subsar-colemmal mitochondria and this was co-related to expres-sion of isoform 2 of COX-4 with higher oxygen affinity after single exercise, de-oxygenation time and myoglobin content (r ≥ 0.75). Conversely, expression in COX4I1 with training correlated negatively with changes of subsarcolem-mal mitochondria (r < −0.82).
Conclusion Hypoxia-modulated adjustments of aerobic
performance with repeated muscle work are reflected by expressional adaptations within the respiratory chain and modified muscle oxygen metabolism.
Keywords Exercise · Oxygen · Metabolism · Plasticity · Cytochrome c · Gene
Abbreviations
ATP5A1 Mitochondrial ATP synthase subunit alpha BOCR Basal oxygen consumption rate
COX1 Cytochrome c oxidase subunit 1
COX4I1 Isoform 1 of cytochrome c oxidase subunit 4 COX4I2 Isoform 2 of cytochrome c oxidase subunit 4 CS Citrate synthase
CSA Cross-sectional area DT De-oxygenation time Abstract
Purpose We explored whether altered expression of
fac-tors tuning mitochondrial metabolism contributes to mus-cular adaptations with endurance training in the condi-tion of lowered ambient oxygen concentracondi-tion (hypoxia) and whether these adaptations relate to oxygen transfer as reflected by subsarcolemmal mitochondria and oxygen metabolism in muscle.
Methods Male volunteers completed 30 bicycle exercise
sessions in normoxia or normobaric hypoxia (4,000 m above sea level) at 65 % of the respective peak aerobic power output. Myoglobin content, basal oxygen con-sumption, and re-oxygenation rates upon reperfusion after 8 min of arterial occlusion were measured in vastus mus-cles by magnetic resonance spectroscopy. Biopsies from
Communicated by Carsten Lundby. D. Desplanches · S. Dupré-Aucouturier
Centre de Génétique et de Physiologie Moléculaire et Cellulaire, CNRS UMR 5534, Université Lyon 1, Villeurbanne, France M. Amami · M. Flück
Institute for Biomedical Research into Human Movement and Health, Manchester Metropolitan University, Manchester, UK
P. Valdivieso · M. Flück (*)
Laboratory for Muscle Plasticity, Department of Orthopaedics, Balgrist University Hospital, University of Zurich, Forchstrasse 340, 8008 Zurich, Switzerland
e-mail: mflueck@research.balgrist.ch S. Schmutz · M. Mueller · H. Hoppeler
Institute of Anatomy, University of Bern, Bern, Switzerland R. Kreis
Department of Clinical Research, University of Bern, Bern, Switzerland
GLUT4 Facilitative glucose transporter 4 HADH 3-Hydroxyacyl-CoA dehydrogenase HADHA An isoform of 3-hydroxyacyl-CoA
dehydrogenase
HIF1A Subunit alpha of hypoxia-inducible factor 1 HIF1B Subunit beta of hypoxia-inducible factor 1 LCAD Long-chain-specific acyl-CoA dehydrogenase LDH A Isoform A of lactate dehydrogenase
LDHB Isoform B of lactate dehydrogenase LDHC Isoform C of lactate dehydrogenase [Mb] Myoglobin content
NDUFA9 NADH dehydrogenase (ubiquinone) 1 alpha subcomplex subunit 9
ORT Oxygen repletion time
PDHA2 Subunit A of pyruvate dehydrogenase E1 component
PDK1 Pyruvate dehydrogenase kinase isoenzyme 1
Pmax Peak aerobic power output
SaO2 Arterial oxygen saturation SDH Succinate dehydrogenase
TFAM Mitochondrial transcription factor A UCP3 Uncoupling protein 3
UQCRC1 Subunit 1 of cytochrome b-c1 complex
VO2max Maximal oxygen uptake Introduction
Repeated endurance work (i.e. training) increases the capacity for aerobic ATP production in skeletal muscle through an elevation in the volume density of mitochon-dria in untrained subjects (Hoppeler et al. 1985). This local adaptation is specifically modified by the ambient concen-tration of oxygen during the workout. With bicycle-type endurance training under lowered oxygenation (hypoxia; Desplanches et al. 1993; Schmutz et al. 2010; Vogt et al.
2001), this is reflected by larger increases in the volume density of subsarcolemmal mitochondria compared to those residing between myofibrils. Concomitantly, we identify specific improvements in maximal oxygen uptake (VO2max), aerobic power, and fatigue resistance with a sin-gle bout of exercise in hypoxia after endurance training in hypoxia compared to normoxia (Hoppeler and Desplanches
1992; Ponsot et al. 2006; Zoll et al. 2006).
Subsarcolemmal mitochondria demonstrate shorter dif-fusion distances to capillaries than intermyofibrillar mito-chondria (Kayar et al. 1988) and are thought to enhance the availability of oxygen for mitochondrial respiration. Accordingly, an increased volume density of the subsar-colemmal subpopulation of mitochondria, or an increased capillary-to-fibre ratio (Desplanches et al. 1993), would offer a distinct metabolic advantage for muscle work-ing aerobically when the oxygen supply to the muscle is
diminished, as occurs during hypoxaemia. The benefit of this adaptation is illustrated for the flight muscle of bare-headed geese, which migrate over the Himalayas (Scott et al. 2009).
Today, the relevance of an increased volume density in subsarcolemmal mitochondria for respiration in skeletal muscle and the molecular factors underpinning the hypoxia-specific biogenesis of subsarcolemmal mitochondria is not well understood (Elustondo et al. 2013). For instance, sub-sarcolemmal mitochondria and their distribution respective to capillaries are largely independent of the level of coarse factors associated with aerobic metabolism, such as citrate synthase, 3-hydroxyacyl-CoA dehydrogenase, and the myo-cellular oxygen carrier myoglobin (Kayar et al. 1988). As well, the general increase of mitochondrial gene transcripts in recruited muscle during recovery from exercise cannot explain the specific increase in subsarcolemmal mitochon-dria with endurance training in hypoxia (Fluck 2006; Perry et al. 2010; Pilegaard et al. 2000; Schmutz et al. 2010; Wag-ner 2012). Candidate factors involved in the hypoxia-specific improvement of local aerobic capacity with endurance train-ing include those that operate at critical biochemical steps of mitochondrial respiration under lowered muscle oxygena-tion with intense exercise in hypoxia (Fig. 1b; Flueck 2009; Richardson et al. 1995). This situation is indicated for the oxygen-sensitive cytochrome c oxidase. For this respira-tory chain component, a switch in expression from isoform
Fig. 1 Experimental design and assessed parameters. a Scheme
depicting the outline of the experiments. For details see the “Meth-ods” section. Subjects experienced an entry test during which anthro-pometry and oxygen metabolism in m. vastus lateralis at rest, and aerobic performance in hypoxia or normoxia were assessed, and a resting muscle biopsy was collected from vastus lateralis. A week later subjects carried out an endurance exercise test at the respective training condition (i.e. warm-up followed by 30-min bicycle exercise at 65 % of the respective Pmax) during which biopsies were collected 24 h after the exercise bout. Subjects then entered an endurance-train-ing protocol with 30 exercise sessions of 30-min on a stationary bicy-cle at 65 % Pmax in normoxia or normobaric hypoxia equivalent to 4,000 m above sea level. This was followed by a post-training biopsy and an exit test essentially repeating the entry test. b Scheme depict-ing the localization of assessed factors of mitochondrial metabolism in muscle fibres. Continuous arrows indicate the flow of metabolic processes. Boxes highlighted by black filling with text in white font reflect the two respiratory complexes where hypoxia-dependent regu-lation is identified. Protein and transcript species being assessed are indicated with underlined font and in italics, respectively. AcCoA acetyl coenzyme A, B-OX beta oxidation, CO I–CO V complex I to complex V of the mitochondrial respiration chain. Further names are defined in the list of abbreviations. c dMb signals from 2 independent receive coils as determined by 1H MRS in function of time and as consequence of applying a blood pressure cuff placed on the thigh in a one subject before the start of exercise. Circles and the connecting grey line represent data points filtered as a moving average of 3 origi-nal fitted points. The black line is the result of fitting this sigorigi-nal with a model for a delayed linear increasing signal, followed by a plateau and an exponential recovery upon release of the air cuff
exit
exercise
test
est
training
normoxia
hypoxia
exit
entry
entry
test
exercise
biopsy 1.50 1.25 1.00 0.75 0.50 0.25 0.00 -0.25 -0.50 15 14 13 12 11 10 9 8 7 6 5 4 3 2 1 0 time [min] 1.50 1.25 1.00 0.75 0.50 0.25 0.00 -0.25 -0.50 15 14 13 12 11 10 9 8 7 6 5 4 3 2 1 0 time [min]A
B
C
one of subunit 4 (COX4I1) towards isoform two (COX4I2) with higher affinity for oxygen is observed in culture upon exposure to ambient hypoxia (Fukuda et al. 2007). Possi-bly, the adjustments comprise altered coupling of oxidative phosphorylation and ATP synthesis in mitochondria through modified expression of UCP3, as this is shown to affect the efficiency of muscle work (Mogensen et al. 2006). Mito-chondrial adjustments to repeated exercise in hypoxia may also connect to metabolic reactions, which improve the gen-eration of high-energy phosphates at a reduced reliance on oxygen (reviewed in Green et al. 2009). This may comprise an increased capacity of the citrate cycle as indicated by ele-vated activity of citrate synthase after endurance training in hypoxia (Desplanches et al. 1993). As well, mitochondrial metabolism may be increasingly fuelled by pyruvate arising from the conversion of glucose after its contraction-induced import in muscle fibres (Fluckey et al. 1999), and through the conversion of lactate by the mitochondria-associated isoform C of lactate dehydrogenase (Andrade and McMullen 2006; Elustondo et al. 2013; Horowitz et al. 2005; Zoll et al. 2006).
To further the understanding of hypoxia-modulated muscle adaptation, we assessed whether adjustments in subsarcolemmal mitochondria and muscle oxygenation in the knee extensor m. vastus lateralis with bicycle-type endurance training would be associated. In vivo informa-tion about muscle oxygenainforma-tion, including basal oxygen consumption rate, perfusion and myoglobin content, was obtained by 1H MR spectroscopy via the quantification of
the deoxymyoglobin (dMb) signal during and following arterial occlusion (reviewed in Carlier et al. 2006; Baum-gartner et al. 2005; Richardson et al. 2001; Tevald et al.
2009). Furthermore, we hypothesized that hypoxia-specific level adjustments of selected gene transcripts after a single bout of bicycle-type endurance exercise and their respective proteins after training would manifest in the recruited mus-cle, m. vastus lateralis, and demonstrate correlative rela-tionships to changes in cellular and functional variables of mitochondrial respiration. A time point 24 h after one bout of endurance exercise was selected to monitor hypoxia-spe-cific adaptations of transcript expression because the switch in COX4 isoform expression occurs 24 h after a hypoxic stimulus in culture (Fukuda et al. 2007) and because this reflected the situation when subjects would carry out a next bout of exercise during their daily training.
Methods
Experimental design
Twelve young, healthy male volunteers consented to par-ticipate in this study after being fully informed about the possible risks. Following an entry test during which
anthropometry and oxygen metabolism at rest in vastus
lat-eralis were assessed, a muscle biopsy was collected from
vastus lateralis muscle after 3 days without vigorous
physi-cal activity (Fig. 1a). Subsequently subjects were assigned to either of two groups, training in normoxia or hypoxia (n = 6 each). They performed VO2max tests to assess aerobic
performance in hypoxia or normoxia. After 7 days of rest they carried out an endurance exercise test composed of a single bout of endurance exercise at the respective training condition, i.e. normoxia or normobaric hypoxia equivalent to 4,000 m above sea level. Further biopsies were collected 24 h after the exercise bout and subjects then began within the next 7 days a training protocol in hypoxia or normoxia at 65 % of Pmax in hypoxia or normoxia, respectively. This
was followed by a post-training biopsy and the repetition of the VO2max tests in normoxia or hypoxia. The study pro-tocol has been approved by the ethics committee of the Canton of Bern (Switzerland) and has been performed in accordance with the ethical standards laid down in the 1964 Declaration of Helsinki. Extracts of the data (anthropom-etry, exercise performance and the consequences of single exercise and training on selected muscle morphometric parameters (volume density of mitochondria and capillar-ity) have been previously reported (Schmutz et al. 2006,
2010). In this study, an additional piece of biopsy material was processed for further molecular characterization. This comprised transcript profiling of an array of gene tran-scripts involved in regulation of mitochondrial metabolism prior and post the single bout of exercise and the meas-ure of changes in protein levels in immunoblots or activ-ity in enzymatic assays along with morphometric estima-tion of cellular variables pre- and post-endurance training (Fig. 1b).
Anthropometry
Anthropometric parameters (age, height, body mass and body fat percentage) were determined at the beginning of the study and after 6 weeks of training in hypoxia. Body fat percentage was determined by a seven-point skin-fold measurement using a calibrated calliper (GPM, Zurich, Switzerland).
1H-MRS based measures of muscle oxygen metabolism The features of the 1H-MRS methodology and its
evalu-ation were described in detail in (Kreis et al. 2001) and (Baumgartner et al. 2005). In the present work, the dMb signal was acquired from the thigh, rather than the calf. In short, pulse and acquire spectra (110 ms repetition time, semi-selective excitation pulse) were acquired on a 1.5 T MR scanner (Signa, General Electric, Milwaukee, USA) using two small independent surface receive coils (7.5 cm
diameter) reproducibly placed in a semi-rigid coil holder such as to be most sensitive to vastus medialis muscle in mid-thigh and 3 cm more distally to vastus lateralis mus-cle. The exact position of the coil relative to the muscle was dependent on the size of the volunteer’s thigh. The coil was placed on the same location in the pre- and post-training acquisition using external anatomical markers and controlled with internal anatomical markers. The dMb signal was induced by inflating a standard blood pressure cuff placed on the thigh as far proximal as possible to 220 mmHg to ensure complete arterial occlusion (Fig. 1c). Inflation of the cuff and its release were synchronized to the MR acquisition using an automatically paced air pres-sure and release system. Total acquisition time was 15 min 18 s. First, a baseline signal of dMb (56 s) and water (1 shot with pre-delay for full signal of 5 s) were recorded before the cuff was automatically inflated and kept inflated for 8 min. After deflation of the cuff, signal acquisi-tion continued to monitor signal disappearance for 6 min 13 s. Further fully recovered reference signals from water were intermittently recorded just before pressure release and at the end of the recovery. Automatic data processing was done with the manufacturer’s spectroscopy package (SAGE) and using the fitting program TDFDfit (Slotboom et al. 1998). Quantitation of the dMb signal was based on the water signal recorded from the same volume as the dMb signal and an assumed water content. The follow-ing parameters were extracted: [Mb], myoglobin content in mmol/kg; BOCR, basal oxygen consumption rate (ml O2/kg); DT, de-oxygenation time − the time in minutes
to reach complete de-oxygenation of Mb; ORT, oxygen repletion time − a characteristic time in seconds for oxy-gen repletion upon release of arterial occlusion (inverse of exponential rate constant).
VO2max tests
Maximal oxygen uptake and peak aerobic power output in normoxia or hypoxia was assessed with ergospirometry on a stationary bike (Ergoline 800S, Ergoline GmbH, Bitz, Germany) as described (Schmutz et al. 2010).
Endurance exercise test
A single bout of endurance exercise consisting of a two-step protocol on the Ergoline 800S ergometer in the respective oxygen condition was carried out as fol-lows. After a warm-up period of 10 min at a low intensity (40 % Pmax), the subjects cycled for 30 min at 65 % Pmax in the respective oxygenation condition during train-ing. Arterial oxygen saturation and lactate concentration at the fingertip were assessed as described previously (Schmutz et al. 2010).
Endurance training
Subjects completed a protocol of 30 endurance exercise sessions of 30 min on a stationary bicycle (Kettler, Ense-Parsit, Germany) in the assigned condition, i.e. normoxia at 560 m above sea level or normobaric hypoxia at a simu-lated altitude of 4,000 m above sea level, at 65 % of cor-responding Pmax in normoxia and hypoxia, respectively. Intensity of the individual exercise bouts was controlled and adjusted based on daily heart rate and weekly lactate measures. For the hypoxia and normoxia group the subjects completed 89 and 92 % of the 30 possible training sessions, respectively.
Tissue handling
Biopsies were collected and stored in liquid nitrogen as described previously (Schmutz et al. 2010). Frozen speci-mens were transported, if necessary, in dry ice in insulated boxes (Carbagas, Liebefeld, Switzerland).
Transcript profiling
Total RNA was isolated, reverse transcribed and subjected to polymerase chain reaction using SYBR Green-based chemistry or custom microarray analysis as reported and deposited under accession codes GSE 13623 and GSE 2479, respectively, at GEO (Schmutz et al. 2010). Raw values were normalized to 28S RNA. The expression level of 15 gene transcripts associated with mitochon-drial metabolism (COX1, COX4I1, COX4I2; HADHA, HADHB, LCAD, UCP3), lactate and pyruvate metabolism (LDHA, LDHC, PDHA2, PDK1) regulation of mitochon-drial transcript expression (TFAM, HIF1A, HIF1B) and glucose uptake (GLUT4) were measured. The COX4I2 measures were carried out with QuantiTect primer assay Hs_COX4I2_1 SG (Qiagen).
Enzymatic assays
Muscle homogenates were prepared in 0.3 M phosphate buffer containing 0.05 % bovine serum albumin (pH 7.7) and assayed spectrophotometrically for the activity of HADH (EC 1.1.1.35), LDH (EC 1.1.1.27) and citrate syn-thase (CS; EC 4.1.3.7) as described (Desplanches et al.
1987). Immunoblots
The protein expression levels of each of the five respira-tory complexes in mitochondria, i.e. NDUFA9 (complex I), SDHA (complex II), UQCRC1 (complex III), COX4I1 and COX4I2 (complex IV), complex V (ATP5A1), and
GLUT4 were assessed in immunoblots using a standard protocol with a paired design. In each lane 20 μg of protein was loaded, essentially as described before (Flueck et al.
2011; Giraud et al. 2005). In brief, muscle homogenates in phosphate buffer were diluted in SDS-loading buffer at 1 mg/ml, denatured for 5 min at 95 °C and proteins sepa-rated via 10 % SDS-PAGE and western blotted onto nitro-cellulose membrane (Protean, Amersham). Nitronitro-cellulose membranes were stained with Ponceau S to verify equal loading in all lanes and visualize the band corresponding to actin. Subsequently immunodetection was carried out for the six mitochondrial proteins simultaneously using a commercial mix of monoclonal antibodies (Anti-OxPhos Complex Kit, Molecular Probes/Invitrogen Ltd, Pais-ley, UK), COX4I2 (clone 1F2, purified immunoglobulin, SIGMA #WH0084701M1), UCP3 (Millipore, #AB3046) and GLUT4 (Millipore, #07-1404). Signal detection was carried out with enhanced chemoluminescence (Femto kit, Pierce) and quantified with a Chemidoc system run-ning under Quantity One software (Bio-Rad, Life Science Research, Hercules, CA, USA). The signal intensity of the respective band was estimated with the ‘volume rectangu-lar tool’ and corrected for background of a band of equal height and size (area) in an empty sample lane. Back-ground-corrected data were normalized to actin and then normalized to the mean values of the samples before train-ing for the respective gel. The values therefore reflect rela-tive expression levels per total muscle protein.
Morphometry
Variables of muscle composition such as fibre cross-sec-tional area (CSA) (in μm2), capillaries per fibre,
capil-laries per unit fibre area (mm−2), and volume densities
of organelles in muscle fibres (%), i.e. densities of inter-myofibrillar mitochondria, subsarcolemmal mitochon-dria, total mitochonmitochon-dria, intramuscular lipid, sarcoplasm) were assessed in muscle biopsies as described previously (Schmutz et al. 2010). The CSA of muscle fibres was assessed with modifications as described in Durieux et al. (2009). Twelve-micrometer-thick cryosections were pre-pared from muscle biopsies and subjected to fibre typing using mouse anti-type II MHC (Sigma Chemical, Buchs, Switzerland), and horseradish peroxidase-coupled second-ary anti-mouse antibody (Cappel, ICN Biomedicals). The immunohistochemical signal was digitally recorded using an Olympus IX50 microscope with digital camera DP72 (Olympus Schweiz AG) being operated with the CellSens Dimension software. Three random fields were recorded at a 10× magnification for each section. Image processing of microscopic fields was performed using Adobe Photoshop CC (Adobe Systems Incorporated). Fibres were assigned to the respective fibre type based on the immunohistochemical
staining (i.e. type I for non-stained fibres and type II for the stained fibres). Subsequently, the circumference of muscle fibres that met the criteria of being presented without sig-nificant signs of distortion or folding (e.g. circularity fac-tor > 0.7) was assessed with the lasso tool and the CSA and distribution of type I and type II fibres was imputed. The scale of each image was calibrated by a horizontal bar on the image as inserted by the software and adjusting with pixel-length. On average, 56 type I and 60 type II muscle fibres were counted per muscle biopsy and time point of training. Image analyses were performed by two co-authors (PV and MF).
Statistics
Interaction effects were assessed with a repeated-measures ANOVA for the repeated factors ‘exercise’ (i.e. pre/post) or training (i.e. pre/post) and the between-factor ‘co-stimulus’ (i.e. normoxia/hypoxia) (Statistica 10.0, Statsoft). Changes post vs. pre exercise and endurance training, respectively, were subsequently assessed with a post hoc test of Fisher. Towards this end, data were normalized to the mean values of the respective training group (i.e. hypoxia and normoxia) prior to training. Relationships between molecular, cellular and functional parameters were assessed with Pearson cor-relations. A cut-off of |r| ≥ 0.70 and p < 0.05 was applied. For factors where normal distribution could be rejected, a Spearman ranks correlation was applied.
Results
Participant characteristics
The anthropometric and exercise characteristics of the participants are given in Table 1. No differences were noted for any of these values between the participants of the normoxia and hypoxia group before training. The per-centage of type I fibres did not differ between the nor-moxia (46.4 ± 2.6 %) and hypoxia (44.2 ± 4.4 %) group (p = 0.33).
Molecular effects of single bout of exercise in hypoxia Subjects performed an endurance exercise test under nor-moxia or hypoxia at an intensity matched for the same respective maximal aerobic power to assess the acute adap-tive response to training. Exercise significantly lowered arterial oxygen saturation and increased serum lactate in both, the normoxia and hypoxia, training group (Table 2). Both the drop in arterial oxygen saturation and venous lac-tate concentration was accentuated in the hypoxia-training group emphasizing the high metabolic strain imposed
during single bout of exercise in hypoxia. Both forms of training improved VO2max and Pmax, but not whole body composition, and this was pronounced for the test condition corresponding to training stimulus (Table 1).
Figure 2 shows the changes in transcripts in vastus
lat-eralis 24 h after a single bout of exercise in normoxia or
hypoxia. Transcript expression of isoform 2 of cytochrome
Table 1 Subject characteristics: summary of the anthropometric and performance measures of the subjects of the normoxia and
hypoxia-train-ing group
P values of two-tailed t test are presented Age
(years)
Height (cm) BMI (m2/kg) Fat (%) Weight (kg) Normoxia Hypoxia VO2max (ml O2/min/kg) Pmax (W) VO2max (ml O2/min/kg) Pmax (W) Normoxia training group
Pre Mean 29.0 179.7 24.6 15.0 78.9 43.4 298.2 33.7 240.8 SE 2.6 2.4 2.1 4.4 5.6 9.5 52.8 9.2 44.3 Post Mean 24.5 15.2 78.7 47.5 333.7 37.0 254.8 SE 4.8 10.4 13.1 10.1 58.4 9.9 40.4 Δ 0 % 1 % 0 % 9 % 12 % 10 % 6 % t test 0.636 0.608 0.752 0.008 0.018 0.001 0.007 Hypoxia-training group Pre Mean 25.8 169.4 23.5 14.4 67.8 43.6 282.4 36.7 220.0 SE 2.2 2.2 1.3 2.9 5.4 3.1 21.3 1.5 14.4 Post Mean 23.2 15.5 67.0 51.1 300.4 39.7 241.2 SE 1.4 3.9 5.4 3.8 22.2 2.5 15.0 Δ −1 % 8 % −1 % 17 % 6 % 8 % 10 % t test 0.160 0.592 0.163 0.006 0.005 0.091 0.001 Interaction effect 0.467 0.650 0.493 0.226 0.014 0.879 0.096
Table 2 Characteristics of the exercise stimulus
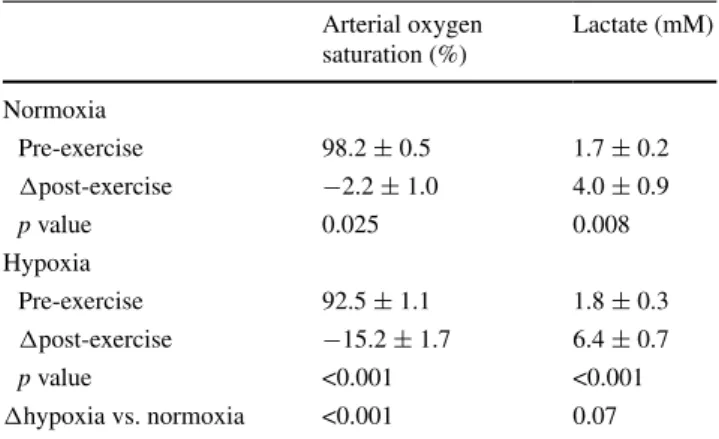
Subjects exercised on a bicycle ergometer for 30 min at 65 % Pmax after 10 min of a warm-up at 40 % Pmax in normoxia or hypoxia with an inspired oxygen fraction of 21 or 12 % at 560 m above sea level (the latter being equivalent to 4,000 m above sea level). Arterial oxy-gen saturation and venous lactate under the respective oxyoxy-genation was assessed at the fingertip at rest and after the endurance exercise test. p values of two-tailed t test are presented
Arterial oxygen saturation (%) Lactate (mM) Normoxia Pre-exercise 98.2 ± 0.5 1.7 ± 0.2 Δpost-exercise −2.2 ± 1.0 4.0 ± 0.9 p value 0.025 0.008 Hypoxia Pre-exercise 92.5 ± 1.1 1.8 ± 0.3 Δpost-exercise −15.2 ± 1.7 6.4 ± 0.7 p value <0.001 <0.001 Δhypoxia vs. normoxia <0.001 0.07
Fig. 2 Hypoxia-specific transcript expression after the exercise
bout. Bar graph visualizing the mean fold changes + standard error (SE) of 13 selected gene transcripts in vastus lateralis muscle of the untrained men 24 h into recovery from the bout of endurance exer-cise in normoxia or hypoxia, respectively, vs. pre-exerexer-cise levels. #p < 0.05 for the interaction effect between the repeated factor pre/ post-exercise × co-stimulus (normoxia/hypoxia, repeated ANOVA, n = 5–6). *p < 0.05 and +0.05 ≤ p < 0.10 for post vs. pre exercise differences (post hoc test of Fisher)
c oxidase subunit 4 (i.e. COX4I2), but none of the 14 other selected gene transcripts, demonstrated an interaction between ‘exercise (pre/24 h post)’ and ‘co-stimulus (nor-moxia/hypoxia)’; this interaction was visible as an increase in COX4I2 transcript levels 24 h after exercise in hypoxia but not in normoxia (Fig. 2).
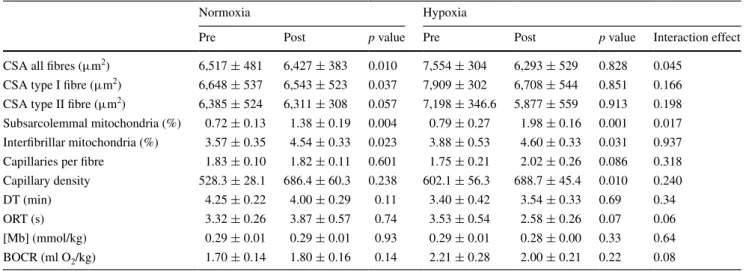
Hypoxia-related muscle adjustments with training
Subjects repeated the bicycle-type exercise under the respective co-stimulus, i.e. normoxia or hypoxia, 30 times during the following 6 weeks. Hypoxia enhanced the endurance training-induced increase in subsarcolemmal mitochondrial density in vastus lateralis muscle (Table 3). An interaction effect (p = 0.045) between training (pre/ post) × co-stimulus (normoxia/hypoxia) on CSA of all muscle fibres was identified. The effect was explained by a reduction in CSA of type I (p = 0.037) and a trend for a reduction in the CSA of type II muscle fibres (p = 0.057) in the normoxia group with training (Table 3).
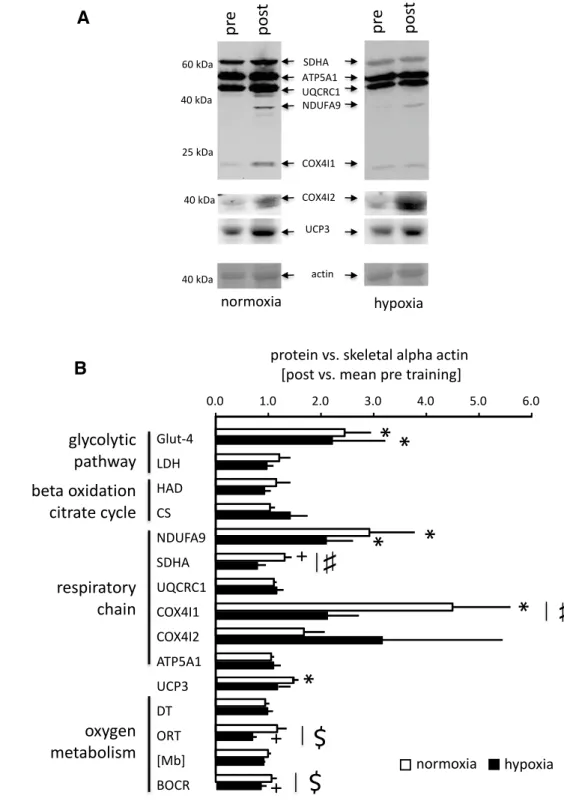
Biochemical analysis of biopsy samples revealed a num-ber of changes in protein expression levels and enzyme activities in the vastus lateralis muscle after endurance training in both normoxia and hypoxia (Fig. 3). Interac-tions between training and oxygen levels were evident for SDHA (p = 0.043) and COX4I1 (p = 0.045) protein. No such interaction was found for any of the other proteins or activities of mitochondrial enzymes (Fig. 3). Fold changes in COX4I1 protein were higher after training in normoxia than hypoxia and fold changes in SDHA protein tended to be selectively elevated after training in normoxia.
Trends for interactions were noted for ‘oxygen repletion time’ (ORT; p = 0.07) and ‘basal oxygen consumption rate’
(BOCR; p = 0.07) in vastus muscles (Fig. 3b). ORT and BOCR tended to be reduced after training in hypoxia. Association of muscle adjustments to single and repeated endurance exercise with mitochondrial plasticity
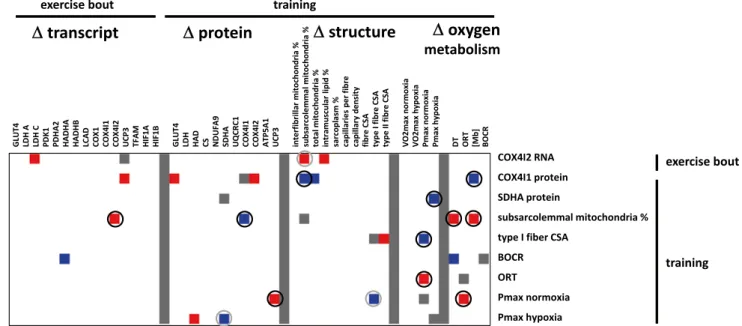
A number of correlations were observed for muscle-related variables of aerobic metabolism, which demonstrated hypoxia-specific changes with endurance exercise/training (Fig. 4).
The major observations were that the training-induced changes in subsarcolemmal mitochondria volume density in
vastus lateralis muscle with endurance training were
posi-tively correlated with level alterations in the COX4I2 tran-script 24 h after the single bout of endurance exercise and the de-oxygenation time and myoglobin content after training (r ≥ 0.75). Conversely, level alterations in COX4I1 protein after training were negatively correlated with training-induced changes in subsarcolemmal mitochondria volume density. Level alterations in the COX4I2 transcript 24 h after single endurance exercise were positively correlated with those of LDHC, PDHA2, HADHA and peak aerobic performance in hypoxia after endurance training. Conversely, the latter changes in peak aerobic performance in hypoxia after training were negatively correlated with those in SDHA protein.
The training-induced alterations of SDHA (r = 0.70), and maximal aerobic performance in normoxia (r = 0.72) were correlated with the delta in arterial oxygen saturation after the first endurance exercise in the respective train-ing condition. Traintrain-ing-induced changes in CS (r = 0.73) and COX4I2 (r = 0.83) protein were correlated to the delta in serum lactate after the first endurance exercise in the respective training condition.
Table 3 Hypoxia-specific training-effects in skeletal muscle
Median ± SE of selected endurance training-induced adjustments in vastus lateralis muscle and interaction effect with the co-stimulus (i.e. nor-moxia or hypoxia; repeated ANOVA with post hoc test of Fisher). The values reproduce previously published material in tabular form (Schmutz et al. 2010)
Normoxia Hypoxia
Pre Post p value Pre Post p value Interaction effect
CSA all fibres (μm2) 6,517 ± 481 6,427 ± 383 0.010 7,554 ± 304 6,293 ± 529 0.828 0.045 CSA type I fibre (μm2) 6,648 ± 537 6,543 ± 523 0.037 7,909 ± 302 6,708 ± 544 0.851 0.166 CSA type II fibre (μm2) 6,385 ± 524 6,311 ± 308 0.057 7,198 ± 346.6 5,877 ± 559 0.913 0.198 Subsarcolemmal mitochondria (%) 0.72 ± 0.13 1.38 ± 0.19 0.004 0.79 ± 0.27 1.98 ± 0.16 0.001 0.017 Interfibrillar mitochondria (%) 3.57 ± 0.35 4.54 ± 0.33 0.023 3.88 ± 0.53 4.60 ± 0.33 0.031 0.937 Capillaries per fibre 1.83 ± 0.10 1.82 ± 0.11 0.601 1.75 ± 0.21 2.02 ± 0.26 0.086 0.318 Capillary density 528.3 ± 28.1 686.4 ± 60.3 0.238 602.1 ± 56.3 688.7 ± 45.4 0.010 0.240
DT (min) 4.25 ± 0.22 4.00 ± 0.29 0.11 3.40 ± 0.42 3.54 ± 0.33 0.69 0.34
ORT (s) 3.32 ± 0.26 3.87 ± 0.57 0.74 3.53 ± 0.54 2.58 ± 0.26 0.07 0.06
[Mb] (mmol/kg) 0.29 ± 0.01 0.29 ± 0.01 0.93 0.29 ± 0.01 0.28 ± 0.00 0.33 0.64
Discussion
Mitochondrial metabolism in skeletal muscle undergoes distinct quantitative improvements with repeated muscle work (endurance training). For instance, mitochondrial volume density and markers of mitochondrial metabolism in knee extensor muscle are typically elevated in previ-ously untrained subjects by 20 % after 30 intense bicycle
exercise sessions over 4–6 weeks (Bakkman et al. 2007; Hoppeler et al. 1985). The appearance of deoxymyoglobin is indicative for a drop in muscle oxygen tension with the onset of intense muscle work from 24 to 8 Torr, which is further accentuated when the fraction of inspired oxygen is 12 % (Flueck 2009; Richardson et al. 1995, 2001). It has been argued that the repeated reduction in oxygen tension in exercised muscle during training sessions with periods
Fig. 3 Hypoxia-modulated
adaptations in muscle protein and oxygen metabolism to endurance training. a Examples of immunoblots for mitochon-drial proteins in vastus lateralis muscle of a subject pre- and post-endurance training in normoxia and hypoxia, respec-tively. The abbreviated name and molecular weight of the detected proteins are indicated. The Ponceau S stained mem-brane before immunoblotting is shown below each blot to visu-alize protein loading based on the stained band corresponding to actin. b Bar graph visualizing the mean fold changes + SE of protein (activity) levels in m. vastus lateralis after 6 weeks of endurance training in normoxia (n = 6) or hypoxia (n = 5) training. #p < 0.05 and $0.05 ≤ p < 0.10, respectively, for the interaction between the ‘pre/post-exercise’ × ‘co-stimulus’ (repeated ANOVA). * and + denote p < 0.05 for values post vs. pre training (post hoc test of Fisher)
A
of recovery to normal oxygen tensions is an important part of the stimulus that drives muscle adaptations to endur-ance training (reviewed in Flueck 2009; Wagner 2012). The increased volume density of subsarcolemmal mitochondria, with an intrinsically lower rate of oxygen consumption than central (also being called intramyofibrillar) mitochon-dria (Adhihetty et al. 2003), in response to endurance train-ing in hypoxia has been suggested to reflect an improved efficiency of cellular respiratory processes (reviewed by Desplanches et al. 1993; Schmutz et al. 2010; Vogt et al.
2001).
To test the molecular regulation of muscle respiration, we deployed an established endurance-training regime under the added co-stimulus of hypoxia. Adjustments of mitochondria-associated transcript and protein expression were probed and assessed for linear relationships to cel-lular and functional variables of oxygen metabolism. The choice of the 24-h time point to assess transcript expres-sion after bicycle exercise was based on the established switch in COX4 isoform expression after 24 h of hypoxia exposure in culture (Fukuda et al. 2007), the responsive-ness of transcript expression at this time point (Busso and Fluck 2013), and the fact that at this time point the next training session would normally take place. Our study identified hypoxia-specific regulation of the COX4I2 transcript after a single bout of exercise and found that the exercise-induced changes in this transcript also corre-lated to exercise-induced changes in the transcript for the
mitochondria-associated isoform C of lactate dehydroge-nase, LDHC, and training-induced changes in volume den-sity of subsarcolemmal mitochondria (Fig. 4). Interestingly, the fold change of the encoded protein, COX4I2, after endurance training was correlated to the delta in serum lactate after the first endurance exercise in the respective training condition (r = 0.83). Conversely, no other assessed gene transcript demonstrated hypoxia-specific regulation post exercise. Our findings suggest that COX4I2 transcript up-regulation is a marker of hypoxia-induced mitochon-drial plasticity.
To the best of our understanding, this is the first report commenting on the relation between hypoxia training-induced alterations in gene expression at the protein level with muscle composition and oxygen metabolism in men. We identify that hypoxia-specific effects on metabolic muscle plasticity are also reflected by interaction effects between the co-stimulus and training on levels of SDHA and COX4I1 protein and myoglobin-based variables of oxygen metabolism, ORT and BOCR (Fig. 3b). ORT is thought to reflect perfusion, whereby a shortened ORT is indicative of a faster perfusion (Slotboom et al. 1998). The trend for a hypoxia-specific reduction in ORT with 6 weeks of endurance training (Fig. 3b) is thus suggestive for improvements in muscle perfusion after hypoxia train-ing. This is consistent with the increased capillary den-sity and trend (p = 0.086) for an increase in the number of capillaries per fibre of vastus lateralis in the subjects
Fig. 4 Interrelationships for hypoxia-specific adjustments with
exer-cise. Matrix visualising the correlations between factors demonstrat-ing hypoxia-specific regulation with sdemonstrat-ingle endurance exercise and training. Fold changes which significance exceeded the threshold of |r| > 0.7 and p < 0.05 are shown in colour coding (red up, blue down).
White colour refers to values below the threshold for significance (|r| < 0.70). Grey symbolises suppressed values. Correlations that are deemed of interest are circled. Double represented relationships are once circled in grey (colour figure online)
with endurance training in hypoxia while both measures of capillarity were not altered with endurance training in normoxia (Table 3). The interaction regarding basal oxygen consumption rate (BOCR) is further support for hypoxia-specific changes in oxygen muscle metabolism induced by endurance training. To our understanding, these data are the first to document a drop in BOCR with training in hypoxia. We interpret these observations as support for the hypoth-esis that the efficiency of respiratory processes in skeletal muscle is particularly improved with a ‘living-low training-high’ paradigm.
Our findings identify that the employed endurance-train-ing protocol in normoxia produced a reduction in the CSA of type I muscle fibres and increased UCP3 levels, which did not occur in hypoxia (Fig. 3b; Table 3). UCP3 con-tent has been reported to demonstrate a negative associa-tion with work efficiency work (Mogensen et al. 2006). In contrast with the former findings, we identify positive and negative correlations, respectively, between the changes of UCP3 and CSA of type I muscle fibres with Pmax with endurance training (Fig. 4). These observations suggest that adjustments in UCP3 levels, ORT, and type I fibre size are associated with the processes that set the scope of improve-ment in peak aerobic performance (Pmax) with endurance training.
Interestingly, we identify that the endurance training-induced fold change in volume density of subsarcolemmal mitochondrial was positively correlated to changes in myo-globin content (i.e. r = 0.74). This contrasts the observa-tion that the distribuobserva-tion of subsarcolemmal mitochondria with respect to capillaries is largely independent from the level of myoglobin (Kayar et al. 1988). It has been reported that myoglobin concentration (termed content herein) is increased after one-legged endurance training in hypobaric conditions (Terrados et al. 1990). In our study, however, myoglobin content was not affected by endurance training in vastus muscles (Fig. 3b). Our study was not designed to explore the difference between the one-legged exercise of the latter study by Terrados et al. (1990) and our two-leg-ged protocol. However, we assume that a less pronounced reduction in muscle oxygenation with one-legged exer-cise at simulated 2,300 m above sea level compared to our two-legged protocol during which exercise was performed at simulated 4,000 m above sea level would be a possible explanation for the observed difference. In this regard, the reciprocal, linear relationships between fold changes of COX4I1 (Fig. 4) and the other mitochondrial mark-ers (ATP5A1 and UQCRC1, not shown) and myoglobin content (r < −0.70) is of special interest: it relates to the reported hypoxia sensitivity of adaptations to exercise at altitude where the best aerobically trained gain the least in maximal oxygen uptake (Angermann et al. 2006; Mollard et al. 2007).
A puzzling observation of our study was that the increase in SDHA protein with endurance training in nor-moxia (Fig. 4a) was blunted with endurance training in hypoxia (Fig. 3b) and correlated negatively with the fold changes in Pmax (Fig. 4). SDH has been shown before to be associated with changes in subsarcolemmal mitochondria with endurance training (Chilibeck et al. 1998, 2002) and as an element of the Krebs cycle and respiratory complex II (Fig. 1b), SDHA, is a critical element in mitochondrial metabolism. Our findings are of interest with regard to the recognized contribution of respiratory complex II to reac-tive oxygen species production and the decrease in reacreac-tive oxygen species with the down-regulation of SDH activ-ity of complex II in hypoxia-adapted flies (Ali et al. 2012; Quinlan et al. 2012). This is of interest given that SDHA, was the only protein which level alteration with endur-ance training correlated with the decline in arterial oxygen saturation during the Single bout of exercise (r = 0.70; Table 2). Our observations therefore raise the hypothesis that the down-regulation of myocellular SDHA after endur-ance training in hypoxia reflects a possible uncoupling of the Krebs cycle from adaptive changes in the respiration chain, which may minimize the production of reactive oxy-gen species.
Based on work in culture (Fukuda et al. 2007), it has been proposed that hypoxia promotes a switch in isoform expression for subunit 4 of the oxygen-sensitive complex IV of mitochondrial respiration towards isoform 2 (i.e. COX4I2) with elevated affinity for oxygen after exercise in hypoxia. This has been shown to manifest 24-h after expo-sure to hypoxia by increased expression of transcript and protein of COX4I2 when the related COX4I1 protein, being encoded on a different gene, is degraded (Fukuda et al.
2007). This view is comforted by our observation on the hypoxia-specific increase in transcript levels for COX4I2 24 h after the exercise bout (Fig. 2). This latter finding is compatible with our observations in intact human skel-etal muscle, for which we identify a selective increase in COX4I1 protein after training in normoxia (Fig. 3b), which correlated negatively with changes in volume density of subsarcolemmal mitochondria (Fig. 4). By contrast, and as pointed out before the change in COX4I2 transcript post-exercise correlated positively with the changes in volume density of subsarcolemmal mitochondria with training (Fig. 4). However, we did not find an increase in COX4I2 protein in vastus lateralis muscle after endurance training in hypoxia (Fig. 3b). Retrospective power analysis identi-fied that the effect of hypoxia on the endurance-training effect would have been resolved at a number of 12 bio-logical replicas (or subjects) for COX4I2 protein. We interpret these observations to reflect a burst in mitochon-drial biogenesis post-endurance exercise which connects the increase in COX4I2 mRNA after endurance exercise
in hypoxia to the addition of new mitochondria under the sarcolemma with 30 repetitions of the exercise stimulus (Adhihetty et al. 2003). In conjunction we identified a lin-ear correspondence between changes in the volume den-sity of subsarcolemmal mitochondria and de-oxygenation time (DT) and myoglobin content ([Mb], r > 0.70). The observed associations support the proposition on a role of the subsarcolemmal population of mitochondria in the extraction of myocellular oxygen (Kayar et al. 1988).
A number of limitations apply to our study. Foremost this relates to the low number of biological replicas of our study, which was due to ethical considerations and labour-intensive work for an invasive study with human volun-teers. Therefore, certain correlations may also be suspected to represent a statistical type I error. However, many of the identified correlations are predicted (for example, type I fibre CSA: type II fibre CSA) and the displayed correla-tions with |r| values >0.7 indicate a large effect size. As well it is possible that due to the selection of a 24-h time point after the single exercise bout, certain transcript level alterations that occur earlier may be missed (Pilegaard et al. 2003). Then we identify that we have no data on mus-cle oxygenation during the single bout of exercise. Musmus-cle oxygenation has been assessed in idealized situations of single-leg exercise based on the dMb signal (Richardson et al. 1995, 2001) but this was no option because of the dif-ficulty of performing strong two-legged exercise in a MR scanner and recording the low SNR signal of dMb dynami-cally at the same time. However, we do find correlations between parameters of oxygen transients in skeletal muscle as quantified at rest by 1H-MRS prior and post-endurance
training (i.e. BOCR, DT, [Mb], ORT), with muscle capil-larity, mean muscle fibre area and arterial oxygen satura-tion post exercise (data shown). These relasatura-tionships estab-lish that cardiovascular parameters of oxygen flux during dynamic exercise are matched to the functional capacity for oxygen uptake in peripheral skeletal muscle. The findings support the relevance of our approach to assess the rela-tionship between muscle reactions (i.e. gene expression) and training-induced alterations in muscle respiration from changes in muscle oxygenation at rest.
Conclusion
The findings support the notion that endurance exercise in hypoxia promotes the biogenesis of the subsarcolem-mal pool of mitochondria via a switch in the expression of cytochrome c oxidase subunit 4 isoforms and an uncou-pling between the Krebs cycle and the respiratory chain at the level of SDH. These observations and the trend of effect on basal oxygen consumption rate are of specific interest given the spurt of interest for hypoxia-training paradigms to
combat metabolic diseases (Wiesner et al. 2010). 1H-MRS
of deoxymyoglobin is suggested as tool to resolve local improvements in oxygen metabolism with endurance train-ing in hypoxia.
Acknowledgments The support of the Swiss National Science
Foundation (grant numbers 31-65276.01 and 31-53788.98) and the University of Bern is gratefully acknowledged. Special thanks are addressed to Dr. Hans Degens for helpful suggestions during the edit-ing process and Ms Karin Zwygart for her dedicated support duredit-ing the MRS measurements.
Open Access This article is distributed under the terms of the
Crea-tive Commons Attribution License which permits any use, distribu-tion, and reproduction in any medium, provided the original author(s) and the source are credited.
References
Adhihetty PJ, Irrcher I, Joseph AM, Ljubicic V, Hood DA (2003) Plasticity of skeletal muscle mitochondria in response to contrac-tile activity. Exp Physiol 88:99–107
Ali SS, Hsiao M, Zhao HW, Dugan LL, Haddad GG, Zhou D (2012) Hypoxia-adaptation involves mitochondrial metabolic depression and decreased ROS leakage. PLoS ONE 7:e36801
Andrade FH, McMullen CA (2006) Lactate is a metabolic substrate that sustains extraocular muscle function. Pflugers Arch 452:102–108 Angermann M, Hoppeler H, Wittwer M, Däpp C, Howald H, Vogt M
(2006) Effect of acute hypoxia on maximal oxygen uptake and maximal performance during leg and upper-body exercise in Nor-dic combined skiers. Int J Sports Med 27:301–306
Bakkman L, Sahlin K, Holmberg HC, Tonkonogi M (2007) Quanti-tative and qualiQuanti-tative adaptation of human skeletal muscle mito-chondria to hypoxic compared with normoxic training at the same relative work rate. Acta Physiol (Oxf) 190:243–251 Baumgartner I, Thoeny HC, Kummer O, Roefke C, Skjelsvik C,
Boesch C, Kreis R (2005) Leg ischemia: assessment with MR angiography and spectroscopy. Radiology 234:833–841
Busso T, Fluck M (2013) A mixed-effects model of the dynamic response of muscle gene transcript expression to endurance exer-cise. Eur J Appl Physiol 113:1279–1290
Carlier PG, Bertoldi D, Baligand C, Wary C, Fromes Y (2006) Mus-cle blood flow and oxygenation measured by NMR imaging and spectroscopy. NMR Biomed 19:954–967
Chilibeck PD, Bell GJ, Socha T, Martin T (1998) The effect of aerobic exercise training on the distribution of succinate dehydrogenase activity throughout muscle fibres. Can J Appl Physiol 23:74–86 Chilibeck PD, Syrotuik DG, Bell GJ (2002) The effect of concurrent
endurance and strength training on quantitative estimates of sub-sarcolemmal and intermyofibrillar mitochondria. Int J Sports Med 23:33–39
Desplanches D, Mayet MH, Sempore B, Flandrois R (1987) Struc-tural and functional responses to prolonged hindlimb suspension in rat muscle. J Appl Physiol 63:558–563
Desplanches D, Hoppeler H, Linossier MT, Denis C, Claassen H, Dormois D, Lacour JR, Geyssant A (1993) Effects of training in normoxia and normobaric hypoxia on human muscle ultrastruc-ture. Pflugers Arch 425:263–267
Durieux AC, D'Antona G, Desplanches D, Freyssenet D, Klossner S, Bottinelli R, Flück M (2009) Focal adhesion kinase is a load-dependent governor of the slow contractile and oxidative muscle phenotype. J Physiol 587(Pt 14): 3703–3717
Elustondo PA, White AE, Hughes ME, Brebner K, Pavlov E, Kane DA (2013) Physical and functional association of lactate dehy-drogenase (LDH) with skeletal muscle mitochondria. J Biol Chem 288:25309–25317
Fluck M (2006) Functional, structural and molecular plasticity of mammalian skeletal muscle in response to exercise stimuli. J Exp Biol 209:2239–2248
Fluckey JD, Ploug D, Galbo H (1999) Mechanisms associated with hypoxia- and contraction-mediated glucose transport in muscle are fibre-dependent. Acta Physiol Scand 167:83–87
Flueck M (2009) Plasticity of the muscle proteome to exercise at alti-tude. High Alt Med Biol 10:183–193
Flueck M, Eyeang-Bekale N, Heraud A, Girard A, Gimpl M, Seynnes OR, Rittweger J, Niebauer J, Mueller E, Narici M (2011) Load-sensitive adhesion factor expression in the elderly with skiing: relation to fiber type and muscle strength. Scand J Med Sci Sports 21(Suppl 1):29–38
Fukuda R, Zhang H, Kim JW, Shimoda L, Dang CV, Semenza GL (2007) HIF-1 regulates cytochrome oxidase subunits to optimize efficiency of respiration in hypoxic cells. Cell 129:111–122 Giraud MN, Fluck M, Zuppinger C, Suter TM (2005) Expressional
reprogramming of survival pathways in rat cardiocytes by neu-regulin-1beta. J Appl Physiol 99:313–322
Green H, Burnett M, Smith I, Tupling S, Ranney D (2009) Failure of hypoxia to exaggerate the metabolic stress in working muscle fol-lowing short-term training. Am J Physiol 297:R593–R604 Hoppeler H, Desplanches D (1992) Muscle structural modifications in
hypoxia. Int J Sports Med 13(Suppl 1):S166–S168
Hoppeler H, Howald H, Conley K, Lindstedt SL, Claassen H, Vock P, Weibel ER (1985) Endurance training in humans: aerobic capac-ity and structure of skeletal muscle. J Appl Physiol 59:320–327 Horowitz JF, Kaufman AE, Fox AK, Harber MP (2005) Energy
deficit without reducing dietary carbohydrate alters resting car-bohydrate oxidation and fatty acid availability. J Appl Physiol 98:1612–1618
Kayar SR, Hoppeler H, Essen-Gustavsson B, Schwerzmann K (1988) The similarity of mitochondrial distribution in equine skeletal muscles of differing oxidative capacity. J Exp Biol 137:253–263 Kreis R, Bruegger K, Skjelsvik C, Zwicky S, Ith M, Jung B,
Baum-gartner I, Boesch C (2001) Quantitative (1)H magnetic resonance spectroscopy of myoglobin de- and reoxygenation in skeletal muscle: reproducibility and effects of location and disease. Magn Reson Med 46:240–248
Mogensen M, Bagger M, Pedersen PK, Fernstrom M, Sahlin K (2006) Cycling efficiency in humans is related to low UCP3 content and to type I fibres but not to mitochondrial efficiency. J Physiol 571:669–681
Mollard P, Woorons X, Letournel M, Lamberto C, Favret F, Pichon A, Beaudry M, Richalet JP (2007) Determinants of maximal oxy-gen uptake in moderate acute hypoxia in endurance athletes. Eur J Appl Physiol 100:663–673
Perry CG, Lally J, Holloway GP, Heigenhauser GJ, Bonen A, Spriet LL (2010) Repeated transient mRNA bursts precede increases in transcriptional and mitochondrial proteins during training in human skeletal muscle. J Physiol 588:4795–4810
Pilegaard H, Ordway GA, Saltin B, Neufer PD (2000) Transcriptional regulation of gene expression in human skeletal muscle during recovery from exercise. Am J Physiol 279:E806–E814
Pilegaard H, Saltin B, Neufer PD (2003) Exercise induces transient transcriptional activation of the PGC-1alpha gene in human skel-etal muscle. J Physiol 546:851–858
Ponsot E, Dufour SP, Zoll J, Doutrelau S, N’Guessan B, Geny B, Hoppeler H, Lampert E, Mettauer B, Ventura-Clapier R, Richard R (2006) Exercise training in normobaric hypoxia in endurance runners. II. Improvement of mitochondrial properties in skeletal muscle. J Appl Physiol 100:1249–1257
Quinlan CL, Orr AL, Perevoshchikova IV, Treberg JR, Ackrell BA, Brand MD (2012) Mitochondrial complex II can generate reac-tive oxygen species at high rates in both the forward and reverse reactions. J Biol Chem 287:27255–27264
Richardson RS, Noyszewski EA, Kendrick KF, Leigh JS, Wagner PD (1995) Myoglobin O2 desaturation during exercise. Evidence of limited O2 transport. J Clin Invest 96:1916–1926
Richardson RS, Newcomer SC, Noyszewski EA (2001) Skeletal muscle intracellular PO2 assessed by myoglobin desaturation: response to graded exercise. J Appl Physiol 91:2679–2685 Schmutz S, Dapp C, Wittwer M, Vogt M, Hoppeler H, Fluck M
(2006) Endurance training modulates the muscular transcriptome response to acute exercise. Pflugers Arch 451:678–687
Schmutz S, Dapp C, Wittwer M, Durieux AC, Mueller M, Weinstein F, Vogt M, Hoppeler H, Flueck M (2010) A hypoxia complement differentiates the muscle response to endurance exercise. Exp Physiol 95:13
Scott GR, Egginton S, Richards JG, Milsom WK (2009) Evolution of muscle phenotype for extreme high altitude flight in the bar-headed goose. Proc Biol Sci 276:3645–3653
Slotboom J, Boesch C, Kreis R (1998) Versatile frequency domain fitting using time domain models and prior knowledge. Magn Reson Med 39:899–911
Terrados N, Jansson E, Sylvén C, Kaijser L (1990) Is hypoxia a stim-ulus for synthesis of oxidative enzymes and myoglobin? J Appl Physiol 68:2369–2372
Tevald MA, Lanza IR, Befroy DE, Kent-Braun JA (2009) Intramyo-cellular oxygenation during ischemic muscle contractions in vivo. Eur J Appl Physiol 106:333–343
Vogt M, Puntschart A, Geiser J, Zuleger C, Billeter R, Hoppeler H (2001) Molecular adaptations in human skeletal muscle to endur-ance training under simulated hypoxic conditions. J Appl Physiol 91:173–182
Wagner PD (2012) Muscle intracellular oxygenation during exercise: optimization for oxygen transport, metabolism, and adaptive change. Eur J Appl Physiol 112:1–8
Wiesner S, Haufe S, Engeli S, Mutschler H, Haas U, Luft FC, Jordan J (2010) Influences of normobaric hypoxia training on physical fitness and metabolic risk markers in overweight to obese sub-jects. Obesity (Silver Spring) 18:116–120
Zoll J, Ponsot E, Dufour S, Doutreleau S, Ventura-Clapier R, Vogt M, Hoppeler H, Richard R, Fluck M (2006) Exercise training in nor-mobaric hypoxia in endurance runners. III. Muscular adjustments of selected gene transcripts. J Appl Physiol 100:1258–1266