1 3
Eur Food Res Technol (2014) 238:1063–1066 DOI 10.1007/s00217-014-2240-x
ShORT COmmunICaTIOn
Evaluation of chocolate as a source of dietary copper
Thomas Weber · Marc SoliozReceived: 4 February 2014 / Revised: 14 april 2014 / accepted: 28 april 2014 / Published online: 10 may 2014 © Springer-Verlag Berlin heidelberg 2014
day recommended for grown-up, healthy adults [1]. Copper intake beyond the DRI should probably be of no concern for healthy adults. according to a recent study, a copper intake of up to 8 mg/day for 6 months did not appear to have any adverse effects in healthy individuals [2]. There are, however, conditions in which excessive copper intake may pose a risk, such as for individuals with Wilson dis-ease, a genetic defect in copper secretion [24].
There is considerable debate of whether the DRI levels are sufficient and in fact, recommendations for adults in the united Kingdom, the European Community, and australia/ new Zealand are higher and range from 1.1 to 1.2 mg/day. The required copper intake may vary a great deal depend-ing on the source of the copper and the nutritional context, both of which can affect the bioavailability (bioaccessibil-ity) of the copper [3]. The focus in establishing nutritional guidelines for copper and maximal tolerable copper levels in drinking water has traditionally been placed on
toxic-ity rather than essentiality. Currently, there is concern that some populations may be copper deficient and this prob-lem may be exacerbated in special circumstances, such as in disease or following bariatric surgery, which is dramati-cally on the rise [4–8].
The copper content of food varies over a wide range. It is lowest in fats and oils, dairy products, sugar, tuna, and lettuce (<0.4 μg/g). higher copper levels are present in leg-umes, mushrooms, chocolate, nuts, and seeds (>2.4 μg/g). The best sources of copper are beef liver and oysters, which typically contain 70–200 μg/g of copper [9, 10]. With the increasing awareness in nutrition, particularly in the West-ern world, people frequently turn to IntWest-ernet sites for infor-mation on nutritional aspects. as a good nutritional source of copper, chocolate is often being recommended (e.g.,
http://www.healthaliciousness.com/articles/high-copper-foods.php). On the other hand, liver and oysters are absent
Abstract Chocolate has frequently been proposed to be
a valuable source of dietary copper, but data on the copper content of major contemporary chocolate brands are scarce. The copper content of 22 brands of chocolate, many of which are sold worldwide, is thus presented here. a reliable hot ashing procedure to determine the copper content of chocolate by inductively coupled plasma atomic emission spectroscopy is also described. It was found that the copper contents of the chocolates analyzed here varied in the range of 1.85 ± 0.10 to 16.50 ± 1.29 μg/g. There was a linear correlation of the copper content of chocolate to its cocoa content with a correlation coefficient R2 of 0.89, showing
that the copper was largely contributed to the chocolate by the cocoa. The value of chocolate as a source of dietary copper is discussed.
Keywords Chocolate · Copper content · nutrition ·
Deficiency
Introduction
Copper is an essential micronutrient and functions as a cofactor in over 30 enzymes in humans. The latest dietary reference intakes (DRI) for copper range form 0.5 g/day for infants to 1.3 mg/day for lactating women, with 0.9 mg/
T. Weber · m. Solioz (*)
Department Clinical Research, university of Bern, murtenstrasse 35, 3010 Berne, Switzerland
e-mail: [email protected] m. Solioz
Department of Plant Physiology and Biotechnology, Tomsk State university, Prospect Lenina 36, 634050 Tomsk, Russian Federation
1064 Eur Food Res Technol (2014) 238:1063–1066
1 3
in many recommendations for copper-rich foods, probably due to the lack of tradition of eating these foods in some countries.
Due to a lack of data on the copper content of contem-porary chocolates, we here determined the copper content of 22 major brands of chocolate by dry ashing and induc-tively coupled plasma atomic emission spectroscopy (ICP– aES). It was found that the copper content linearly corre-lated with the cocoa content. Thus, cocoa-rich chocolates should be recommended if chocolate is to serve as a source of dietary copper.
Materials and methods
Different brands of chocolate were bought in local shops and supermarkets in Berne, Switzerland, and stored at room temperature. The cocoa content was taken either from the product label or was inquired at the manufacturer. For copper measurements, samples of 1–1.5 g of chocolate were ashed in a kiln at 400 °C for 3 h and at 600 °C for 14 h. Fused silica crucibles (99.7 % al2O3, alsint, Faust
Laborbedarf aG, Schaffhausen, Switzerland) rather than ceramic crucibles had to be used. Extensive experiments in our laboratory had shown that standard ceramic crucibles were unsuitable as they absorbed variable amounts of cop-per, depending on the history of the crucibles. after cooling of the ashed samples, the residues were dissolved in 1 ml of 67 % hnO3 for 1 h under agitation. after addition of 1 ml of 30 % h2O2 and further incubation for 1 h at room
temperature, the sample was brought to a final volume of 6 ml with water. This resulted in a clear solution without insoluble residues. Copper concentrations were meas-ured by ICP–aES, using a Jobin–Yvon JY 24 instrument (hORIBa Jobin–Yvon Gmbh, munich, Germany) at a wavelength of 324.754 nm and using Gauss integration for 0.5 min. The lower limit of detection for copper was five parts per billion.
Results
a number of published methods were assessed in their reliability to measure copper in chocolate. It was found that published wet ashing procedures in mixtures of con-centrated hnO3 and h2O2, or dry ashing at 500 °C gave
poor reproducibility across chocolates with widely dif-fering cocoa and fat contents [11, 12]. These published methods had been evaluated with standard reference mate-rials, which were based on bovine liver or rice flour sam-ple matrices. however, these matrices are a poor reference material for chocolate, which is rich in fats highly resistant to wet oxidation. So, these published methods necessitate
filtration or centrifugation of the samples. The dry ashing procedure described here resulted in clear, residue-free samples, which gave reproducible copper values across all samples.
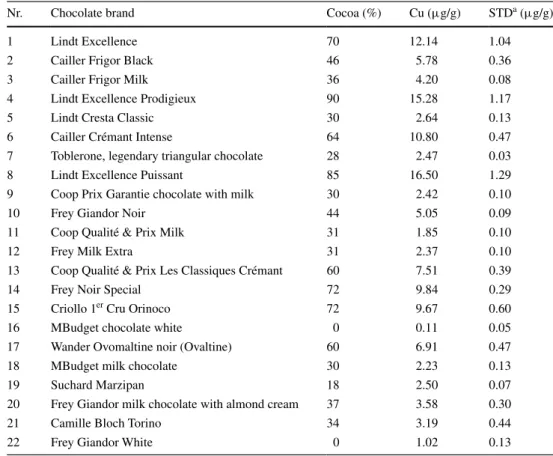
Table 1 shows the copper contents of 22 brands of choc-olate. many of the brands are marketed worldwide, while a few are products specific to the Swiss market. The low-est copper contents were found in two brands of white chocolate, which are not chocolates in the strict sense of the word, since they do not contain cocoa. They had cop-per contents of 0.11 ± 0.05 and 1.02 ± 0.13 μg/g. For the cocoa-containing chocolate brands, the copper values ranged from 1.85 ± 0.10 to 16.50 ± 1.29 μg/g. Interest-ingly, there was a very good, linear correlation between the cocoa content and the copper content of chocolate brands (R2 = 0.89), without any dramatic outliers (Fig. 1). This
suggests that the copper content of chocolate originates largely from the cocoa. This is also supported by the two white “chocolates”, which did not contain cocoa and exhib-ited the lowest copper contents. Thus, the value of choco-late as a source of dietary copper directly depends on the cocoa content: Chocolates with a high cocoa content are a better source of dietary copper than those with a low content.
Discussion
The copper content of chocolate has not systematically been addressed in the scientific literature. although a num-ber of reports deal with the copper content of chocolate and other cocoa products such as chocolate drinks, cakes, etc., chocolate brands and cocoa contents were not given [8, 9,
12–16]. We thus saw a need to assess the copper content of specific chocolate brands and relate them to the cocoa content.
We here determined the copper content of 22 differ-ent chocolates, many of which find worldwide distribu-tion today. There was a linear correladistribu-tion between the cocoa content of these chocolates and the copper content, which ranged from 1.85 ± 0.10 μg/g of a chocolate con-taining 31 % cocoa to 16.50 ± 1.29 μg/g of a chocolate with 85 % cocoa. This clearly suggests that the copper is contributed by the cocoa. Indeed, cocoa beans are high in copper. The copper content of fermented cocoa beans from Ghana was reported to range from 88 to 173 µg/g, depend-ing on the length of pod storage [17]. how storage could affect the copper content is hard to perceive and may reflect a methodological problem. The copper content of cocoa powder from local markets in Greece, Pakistan, and Brazil ranged from 27 to 52 μg/g [12, 18, 19]. hernandez et al. [20] analyzed the copper, zinc, manganese, iron, and mag-nesium content of primary chocolate mass from different
1065 Eur Food Res Technol (2014) 238:1063–1066
1 3
manufacturers and found copper to vary between 11 and 27 μg/g. They concluded that the metal contents depended on both, the origin of the cocoa beans and the grinding and milling process, necessary to obtain a smooth choco-late texture. Grinding and milling involves heavy equip-ment and extended contact times of the cocoa mass with various metal alloys. This can of course lead to enrich-ment of the cocoa with metal ions. Raw cocoa beans from
plantations in nigeria had a copper contents ranging from 104 to 642 µg/g [21]. according to the authors, the higher copper contents were due to the use of copper sulfate for disease prevention on these plantations. Clearly, cocoa in various forms has an intrinsically high copper content. It would be interesting to know how this relates to cocoa spe-cies, origin, and growth conditions. however, in today’s global markets, it has become impossible to track the origin and species of the cocoa beans and chocolate producers are unwilling or probably even unable to provide correspond-ing information.
a majority of chocolates on the market have a cocoa content in the range of 30–60 % and thus an average copper content of around 4 μg/g. a typical 100 g bar of choco-late thus contains 400 μg of copper and would contribute 44 % of the daily DRI for adults. On the other hand, 50 g of chocolate high in cocoa would contribute 100 % of the DRI for copper. In contrast to the copper content, the caloric value of chocolate does not differ much between brands and is around 5 kcal/g (21 kJ/g). If chocolate is considered as a copper source, preference should clearly be given to brands with a high cocoa and thus a high copper content to minimize fat and energy intake.
according to an analysis of the eating habits of the elderly in the uSa in 2000, chocolate contributed only 12 % to the individual copper consumption [22]. This implies the consumption of 5–40 g/day of chocolate,
Table 1 Copper and cocoa
content of different chocolate brands
a STD, standard deviation based on at least three measurements
nr. Chocolate brand Cocoa (%) Cu (μg/g) STDa (μg/g)
1 Lindt Excellence 70 12.14 1.04
2 Cailler Frigor Black 46 5.78 0.36
3 Cailler Frigor milk 36 4.20 0.08
4 Lindt Excellence Prodigieux 90 15.28 1.17
5 Lindt Cresta Classic 30 2.64 0.13
6 Cailler Crémant Intense 64 10.80 0.47
7 Toblerone, legendary triangular chocolate 28 2.47 0.03
8 Lindt Excellence Puissant 85 16.50 1.29
9 Coop Prix Garantie chocolate with milk 30 2.42 0.10
10 Frey Giandor noir 44 5.05 0.09
11 Coop Qualité & Prix milk 31 1.85 0.10
12 Frey milk Extra 31 2.37 0.10
13 Coop Qualité & Prix Les Classiques Crémant 60 7.51 0.39
14 Frey noir Special 72 9.84 0.29
15 Criollo 1er Cru Orinoco 72 9.67 0.60
16 mBudget chocolate white 0 0.11 0.05
17 Wander Ovomaltine noir (Ovaltine) 60 6.91 0.47
18 mBudget milk chocolate 30 2.23 0.13
19 Suchard marzipan 18 2.50 0.07
20 Frey Giandor milk chocolate with almond cream 37 3.58 0.30
21 Camille Bloch Torino 34 3.19 0.44
22 Frey Giandor White 0 1.02 0.13
R² = 0.8929 0 5 10 15 20 0 20 40 60 80 100 Copper content [µg/g] Cocoa content [%]
Fig. 1 Relationship of copper content and cocoa content of
choco-late. The copper content of 22 brands of chocolate was plotted against the cocoa content. The error bars show the standard deviations of at least three independent measurements. The linear regression exhib-ited a correlation of R2 = 0.89
1066 Eur Food Res Technol (2014) 238:1063–1066
1 3
depending on the cocoa content. Chocolate is clearly a good source of copper, and cocoa powder has successfully been used to combat copper deficiency associated with tube feeding in Japan [23]. nevertheless, better sources for extra copper would be beef liver or oysters, of which 5–15 g would suffice to provide the DRI and would be accompa-nied by a lower fat and energy intake.
Chocolate contains several biologically active con-stituents such as methylxanthines, biogenic amines, and cannabinoid-like fatty acids, all of which are potentially addictive substances. Indeed, excessive craving for choco-late is a well-known phenomenon [25]. In addition, choco-late has also been advocated as an antioxidant nutrient for cardiovascular health [26]. These aspects are beyond the realm of this discussion, but it should be noted that, aside of its value as a copper source, chocolate remains a highly interesting and enigmatic component of the human diet and clearly deserves further research.
Acknowledgments This work was supported by Grant
CR32I3E-136073 from the Swiss national Science Foundation and a Russian Federation Government Grant to leading scientists.
Conflict of interest none.
Compliance with Ethics Requirements This article does not
con-tain any studies with human or animal subjects.
References
1. national Research Council (2001) Dietary reference intakes for vitamin a, vitamin K, arsenic, boron, chromium, copper, iodine, iron, manganese, molybdenum, nickel, silicon, vanadium, and zinc. The national academies Press, Washington
2. Rojas-Sobarzo L, Olivares m, Brito a, Suazo m, araya m, Pizarro F (2013) Copper supplementation at 8 mg neither affects circulating lipids nor liver function in apparently healthy Chilean men. Biol Trace Elem Res 156:1–4
3. Khouzam RB, Pohl P, Lobinski R (2011) Bioaccessibility of essential elements from white cheese, bread, fruit and vegetables. Talanta 86:425–428
4. Gletsu-miller n, Wright Bn (2013) mineral malnutrition follow-ing bariatric surgery. adv nutr 4:506–517
5. Klevay Lm (2011) Is the Western diet adequate in copper? J Trace Elem med Biol 25:204–212
6. Stern BR (2010) Essentiality and toxicity in copper health risk assessment: overview, update and regulatory considerations. J Toxicol Environ health a 73:114–127
7. Roman VB, Ribas BL, ngo J, Gurinovic m, novakovic R, Cave-laars a et al (2011) Projected prevalence of inadequate nutrient intakes in Europe. ann nutr metab 59:84–95
8. Joo S-J, Betts nm (1996) Copper intakes and consumption pat-terns of chocolate foods as sources of copper for individuals in
the 1987–88 nationwide food consumption survey. nutr Res 16:41–52
9. Pennington JaT, Schoen Sa, Salmon GD, Young B, Johnson RD, marts RW (1995) Composition of core foods in the u.S. food supply, 1982–1991. J Food Compost anal 8:171–217
10. Lindow CW, Elvehjem Ca, Peterson Wh (1929) The copper con-tent of plant and animal foods. J Biol Chem 82:465–471 11. Güldas m (2008) Comparison of digestion methods and trace
ele-ments determination in chocolates with pistachio using atomic absorption spectrometry. J Food nutr Res 47:92–99
12. dos Santos WnL, da Silva EGP, Fernandes mS, araujo RGO, Costa aCS, Vale mGR et al (2005) Determination of copper in powdered chocolate samples by slurry-sampling flame atomic-absorption spectrometry. anal Bioanal Chem 382:1099–1102 13. Ferreira hS, Santos aC, Portugal La, Costa aC, miro m,
Fer-reira SL (2008) Pre-concentration procedure for determination of copper and zinc in food samples by sequential multi-element flame atomic absorption spectrometry. Talanta 77:73–76
14. Knezevic G (1980) Schwermetalle in Lebensmitteln. Über den Kupfergehalt in Rohkakao, Kakao-, halb- und -Fertigprodukten. Zucker- Süssw Wirtsch 33:75–77
15. Lee CK, Low KS (1985) Determination of cadmium, lead, cop-per and arsenic in raw cocoa, semifinished and finished chocolate products. Pertanika 8:243–248
16. Güldas m, Dagdelen aF, Biricik GF (2008) Determination and comparison of some trace elements in different chocolate types produced in Turkey. J Food agric Environ 6:90–94
17. afoakwa EO, Quao J, Takrama J, Budu aS, Saalia FK (2013) Chemical composition and physical quality characteristics of Ghanaian cocoa beans as affected by pulp pre-conditioning and fermentation. J Food Sci Technol 50:1097–1105
18. anthemidis an, Pliatsika VG (2005) On-line slurry formation and nebulization for inductively coupled plasma atomic emission spectrometry. multi-element analysis of cocoa and coffee powder samples. J anal atom Spectrom 20:1280–1286
19. ahmed I, Zaidi SSh, Khan Za (1989) The determination of major, minor and trace elements in tea, tea liquor, instant coffee and cocoa samples. Pak J Sci Ind Res 32:513–516
20. hernandez C, Bermond a, Ducauze CJ (1994) Discrimination de masses de cacao par l’utilisation de données chimiométriques: détermination de leur origine géographique et de leur traiement technologique à partir des teneurs en cations métalliques. analu-sis 22:15–22
21. adeyeye EI, arogundade La, asaolu SS, Olaofe O (2006) Fun-gicide-derived copper content in soil and vegetation component, Owena cocoa (Theobroma cacao L.) plantations in nigeria. Bangladesh J Sci Ind Res 41:129–140
22. ma J, Betts nm (2000) Zinc and copper intakes and their major food sources for older adults in the 1994–96 continuing survey of food intakes by individuals (CSFII). J nutr 130:2838–2843 23. Tokuda Y, Kashima m, Kayo m, nakazato n, Stein Gh (2006)
Cocoa supplementation for copper deficiency associated with tube feeding nutrition. Intern med 45:1079–1085
24. Johncilla m, mitchell Ka (2011) Pathology of the liver in copper overload. Semin Liver Dis 31:239–244
25. Bruinsma K, Taren DL (1999) Chocolate: food or drug? J am Diet assoc 99:1249–1256
26. Klevay Lm (2012) Copper in chocolate may improve health. Clin nutr 31:149