S1
Supplementary Information
Energy Band-Gap Engineering of Conjugated Microporous Polymers via
Acidity-Dependent In-situ Cyclization
Jiyoung Lee,† Onur Buyukcakir, †, Tae-woo Kwon,† Ali Coskun*, ‡
† Graduate School of Energy, Environment, Water, and Sustainability (EEWS), Korea Advanced
Institute of Science and Technology (KAIST), Daejeon 34141, Republic of Korea
‡ Department of Chemistry, University of Fribourg, Fribourg 1700, Switzerland
Email: [email protected]
Materials and Methods Table of Contents
Section – 1 General materials and methods information
Section – 2 Synthetic procedures
Section – 3 Fourier Transform infrared spectroscopy (FT-IR) analysis
Section – 4 Powder X-ray diffraction (PXRD) analysis
Section – 5 X-ray Photoelectron Spectroscopy (XPS) analysis
Section – 6 Thermogravimetric analysis (TGA)
Section – 7 Electrochemical measurement
Section – 8 Solid-state UV/Vis adsorption analysis
Section – 9 BET surface area analysis
S2
S-1 General materials and methods 1.1 Materials
All reagents and solvents, unless otherwise noted, were purchased from Sigma Aldrich Chemical Co. and used as received. The 1,5,9-triamine-triphenylene (TATP) was prepared from 2,3-dichloronitrobenzene using a previous literature report.1 All reference compounds were synthesized
according to a modified procedure from literature.2
1.2 Methods
Fourier transform infrared spectroscopy (FT-IR) analysis was recorded on Shimadzu IRTracer-100 with ATR mode. The 1H NMR spectra were obtained using Bruker DMX 300 MHz under ambient
conditions. Solid-state CP/MAS 13C NMR spectra were attained using Bruker Avance 400MHz NMR
instrument. Particle size distribution analysis was recorded by using Dynamic light scattering with Sympatec HELOS on BR mode.The powder X-ray diffraction (PXRD) patterns of CMP series were collected on a Rigaku SmartLab (X-ray generator: 9kW, Detector: D/tex Ultra 250) using CuKα radiation from 5o to 60o with rate of 4o/min. X-ray photoelectron spectroscopy (XPS) analysis was
carried out with a multipurpose XPS (Sigma Probe, Thermo VG Scientific, X-ray Source: monochromatic Al (K-alpha)). Fourier transform Raman spectroscopy (FT-Raman) was performed with Bruker RFS 100/S with near IR laser (1064nm). Thermogravimetric analysis (TGA) was measured with Shimadzu DTG-60A by increasing temperature up to 800oC with a rate of 10oC/min
under air atmosphere. Optical properties were attained by solid-state UV-Vis spectroscopy using Jasco V-570 on a diffuse reflectance spectrometer in the range of 200 nm to 2200 nm wavelength and optical band gaps were calculated by Tauc’s plot.3 Electrical measurements were performed at 25oC in air on
slurry casted cCMP and ucCMP film between 60-um width Cu electrodes by a two-probe method using MS-Tech8000. High-resolution mass spectra (HR-MS) were obtained on Bruker Daltonik micrOTOF-Q Ⅱ. Elemental analysis (C,H,N) was performed with Thermo Finnigan FlashEA 1112. Argon absorption and desorption isotherms were measured with a Micrometrics Triflex system at 87 K and all the samples were degassed at 120oC for 12 h for activation. The partial pressure range for the
calculation of Brunauer–Emmett–Teller (BET) specific surface areas of samples were obtained from the corresponding Rouquerol plots, where the V(1-P/P0) is continuously increasing along with P/P0.
The pore size distribution and textural information were determined using Nonlocal Density Functional Theory (NLDFT) method from using argon isotherms. The temperature for gas uptake experiments were controlled by isothermal cooling machine provided by Micromeritics.
S3
S-2 Synthetic procedures
2.1 General procedure for the synthesis of ucCMP and cCMP
A 5mL ampule (height (mm) = 84 and diameter (mm) = 16.5) was charged with 1,5,9-triamine-triphenylene (TATP) (60 mg, 0.220 mmol), terephthalaldehyde (TPA) (44.2 mg, 0.329 mmol) in the mixture of 1.5 mL of N,N-dimethylformamide (DMF) /1,4-dioxane (10:1 v/v) and 3M aqueous acid catalyst (0.5 equiv. relative to TATP). The tube was flash-frozen at 77 K (liquid N2 bath) and then
degassed by three freeze-pump-thaw cycles. The flame-sealed tube was moved into the pre-heated oven at 100 oC for 3 days. The mixture was cooled to room temperature and the solid was collected by
filtration and washed with tetrahydrofuran and deionized water several times. The solid was dried under vacuum for 12 hours to afford the final product.
Synthesis of un-cyclized CMP (ucCMP)
The ucCMP was obtained by following the general procedure by using 3M acetic acid as a catalyst. Yield: 69 mg (75 %) for C30H18N3. Anal. Calcd. for C30H18N3: C% (85.69) H% (4.31) N% (9.99)
Found: C% (85.21) H% (4.36) N% (9.12); FT-IR (KBr, cm-1): 2966, 2890, 1611, 1571, 1440, 1398,
1321, 1276, 1051, 1008, 825, 705, 613.
Synthesis of cyclized CMP (cCMP)
The cCMP was obtained by following general procedure by using 3M triflic acid as a catalyst. Yield: 83 mg (91 %) for C30H12N3. Anal. Calcd. for C30H12N3: C% (86.94) H% (2.92) N% (10.14) Found: C%
(82.38) H% (3.75) N% (8.48); FT-IR (KBr, cm-1): 1610, 1578, 1440, 1325, 1276, 1134, 1062, 1008,
S4
2.2 Synthesis of model compounds
2.2.1 Model compound, un-cyclized CMP (m-ucCMP).
A mixture of 1,5,9-triamine-triphenylene (100 mg, 0.366 mmol) and benzaldehyde (0.252 mL, 2.46 mmol) in tetrahydrofuran (9.4 mL) with acetic acid (0.7 mL) was stirred at 70oC. The progress of the
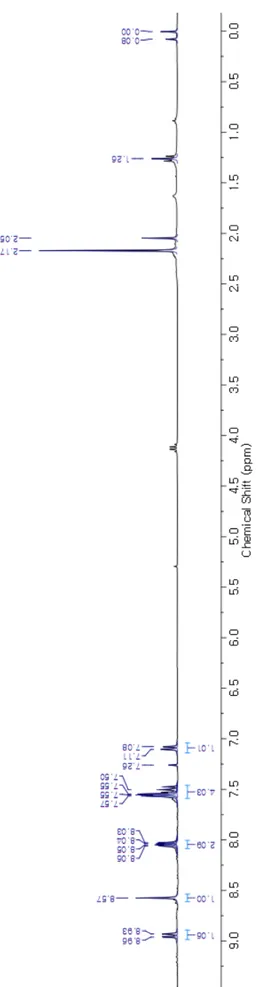
reaction was monitored by TLC. After completion of the reaction, THF was removed under reduced pressure and the resulting solid was triturated in hexanes. The solid was isolated by filtration and dried in vacuo to give the crude product, which was further purified by column chromatography packed with silica gel (Eluent: DCM/Hexane (2:1 v/v)) to afford the m-ucCMP as a yellow solid. Yield: 122 mg (62 %) for C39H27N3.1H NMR (300 MHz, CDCl3, 298 K) δ = 8.95 (dd, J = 8.4, 1.2 Hz, 1H), 8.57 (s,
1H), 8.08 – 8.01 (m, 2H), 7.57 – 7.47 (m, 4H), 7.09 (d, J = 6.4 Hz, 1H) ppm; 13C NMR (125 MHz,
CDCl3 : TFA-d1 (10 :1 v/v), 298 K) δ = 125.23, 127.29, 130.39, 131.05, 131.79, 133.76, 134.29, 135.08,
163.76 ppm; HR-MS (ESI) m/z Calcd for C39H26N3 [M]+ 536.2122, Found 536.2129; FT-IR (KBr, cm -1): 2920, 2848, 1608, 1575, 1448, 1398, 1328, 1259, 1012, 819, 750, 698.
S5 2.2.1.1 1H NMR Spectrum of m-ucCMP F igu re S1 . 1 H N M R ( 300M H z, C D C l3 , 298K ) spe ct rum of m -uc C M P .
S6
2.2.2 Model compound for cyclized CMP (m-cCMP)
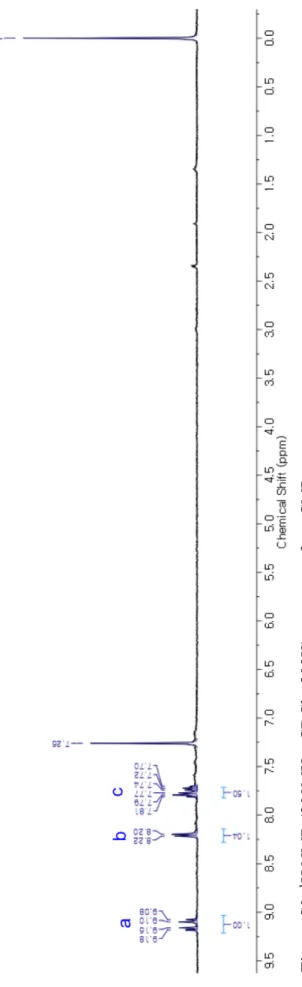
A mixture of 1,5,9-triamine-triphenylene (100 mg, 0.366 mmol) and benzaldehyde (0.252 mL, 2.46 mmol) in DMF (1.316 mL) in the presence of Triflic acid (0.0132 mL) was stirred at 100oC. The
progress of the reaction was monitored by TLC. After completion of the reaction, the reaction mixture was diluted with H2O and then extracted with CHCl3 (3 x 50 mL) three times. The organic layer was
dried by using anhydrous Na2SO4 and concentrated under reduced pressure to give the crude product,
which was further purified by column chromatography packed with silica gel (Eluent: CHCl3) to afford
the m-cCMP as a yellow solid. Yield: 103 mg (53%) for C39H21N3. 1H NMR (300 MHz, CDCl3, 298
K) δ = 9.32 – 9.10 (m, 1H), 8.26 – 8.11 (m, 1H), 7.75 (dt, J = 21.4, 7.1 Hz, 2H) ppm; 13C NMR (125
MHz, CDCl3 : TFA-d1 (10 :1 v/v), 298 K) δ = 120.94, 124.21, 127.37, 129.32, 130.09, 131.40, 134.44,
135.53, 139.08, 165.19 ppm; HR-MS (ESI) m/z Calcd for C39H22N3+ [M+H]+ 532.1809, Found
532.1812; FT-IR (KBr, cm-1): 1608, 1575, 1436, 1325, 1307, 1180, 1138, 1058, 1020, 891, 827, 702,
S7 2.2.2.1 1H NMR Spectrum of m-cCMP F igu re S2 . 1 H N M R ( 300M H z, C D C l3 , 298K ) spe ct rum of m -cC M P .
S8
2.2.3 13C-CPMAS NMR spectra of ucCMP and cCMP, and 13C NMR spectra of their
corresponding model compounds
Figure S3. (a) 13C-CPMAS NMR spectrum of ucCMP (top) and 13C NMR spectrum of m-cCMP (bottom)
S9
2.2.4 Particle size distribution analysis
2.2.4.1 Dynamic light scattering analysis for cCMP and ucCMP
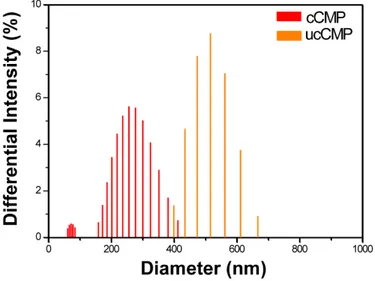
Figure S4. Particle size distribution of cCMP (red bar) and ucCMP (orange bar). The samples were
prepared in ethanol by sonicating for 2 hours. The smaller particle diameter of cCMP compared to ucCMP points to the fact that strong acids lead to the formation of smaller sized polymers, which may originate from the lower solubility of planarized TATP core upon cyclization in the presence of strong acids.
S10
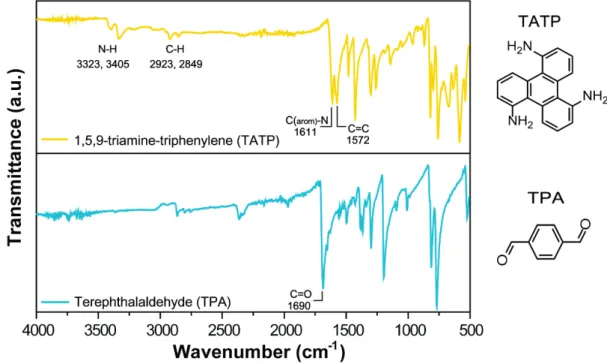
S-3 FT-IR Spectroscopy Analysis 3.1 FT-IR Spectra of the monomers
S11
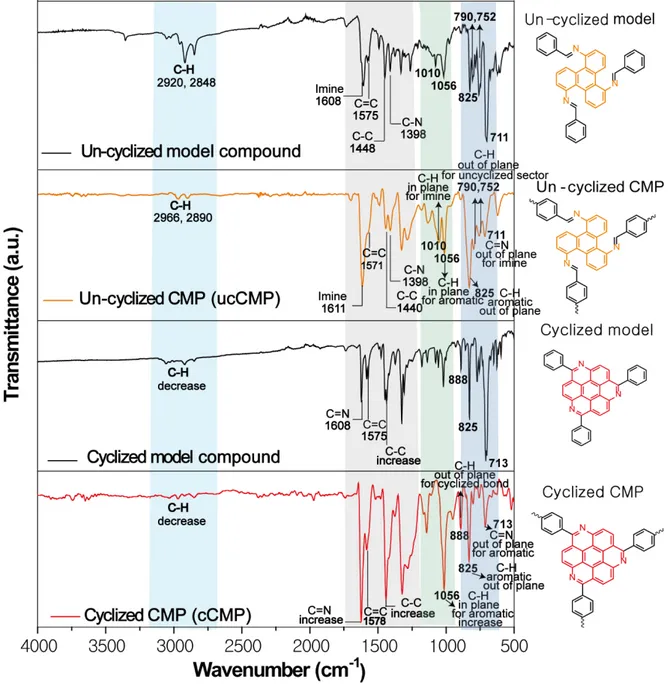
3.2 FT-IR Spectra of ucCMP, cCMP, m-ucCMP, and m-cCMP
Figure S6. FT-IR spectra of ucCMP (orange curve), cCMP (red curve), and their model compounds
S12
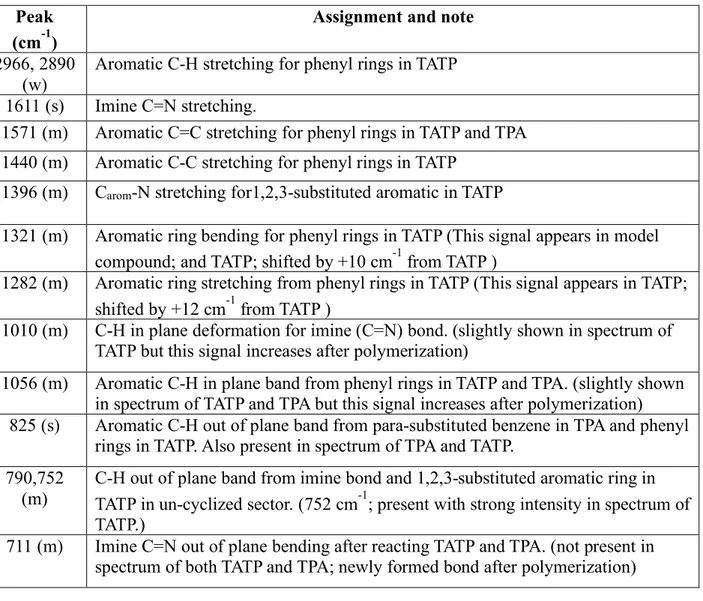
Table S1. Peak assignment for the FT-IR spectrum of ucCMP. Notes and discussion are provided to correlate the spectra of starting material and model compound of ucCMP
Peak (cm-1)
Assignment and note
2966, 2890 (w)
Aromatic C-H stretching for phenyl rings in TATP 1611 (s) Imine C=N stretching.
1571 (m) Aromatic C=C stretching for phenyl rings in TATP and TPA 1440 (m) Aromatic C-C stretching for phenyl rings in TATP
1396 (m) Carom-N stretching for1,2,3-substituted aromatic in TATP
1321 (m) Aromatic ring bending for phenyl rings in TATP (This signal appears in model compound; and TATP; shifted by +10 cm-1 from TATP )
1282 (m) Aromatic ring stretching from phenyl rings in TATP (This signal appears in TATP; shifted by +12 cm-1 from TATP )
1010 (m) C-H in plane deformation for imine (C=N) bond. (slightly shown in spectrum of TATP but this signal increases after polymerization)
1056 (m) Aromatic C-H in plane band from phenyl rings in TATP and TPA. (slightly shown in spectrum of TATP and TPA but this signal increases after polymerization)
825 (s) Aromatic C-H out of plane band from para-substituted benzene in TPA and phenyl rings in TATP. Also present in spectrum of TPA and TATP.
790,752 (m)
C-H out of plane band from imine bond and 1,2,3-substituted aromatic ring in TATP in un-cyclized sector. (752 cm-1; present with strong intensity in spectrum of TATP.)
711 (m) Imine C=N out of plane bending after reacting TATP and TPA. (not present in spectrum of both TATP and TPA; newly formed bond after polymerization)
S13
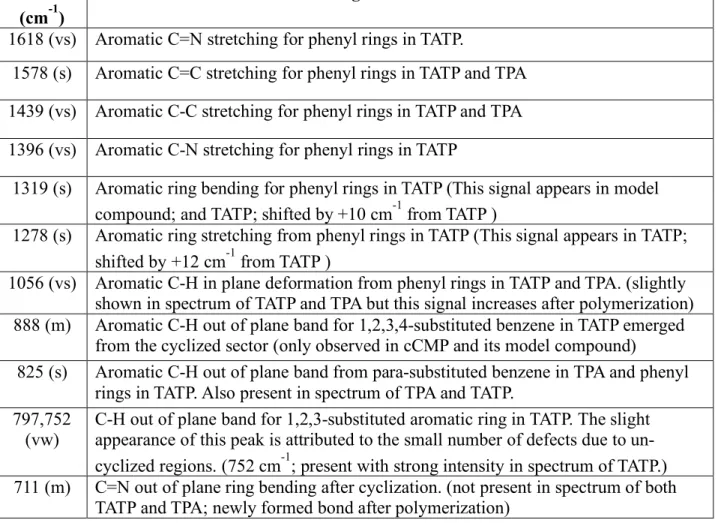
Table S2. Peak assignment for the FT-IR spectrum of cCMP. Notes and discussion are provided to correlate the spectra of starting material and model compound of cCMP
Peak (cm-1)
Assignment and note
1618 (vs) Aromatic C=N stretching for phenyl rings in TATP.
1578 (s) Aromatic C=C stretching for phenyl rings in TATP and TPA 1439 (vs) Aromatic C-C stretching for phenyl rings in TATP and TPA 1396 (vs) Aromatic C-N stretching for phenyl rings in TATP
1319 (s) Aromatic ring bending for phenyl rings in TATP (This signal appears in model compound; and TATP; shifted by +10 cm-1 from TATP )
1278 (s) Aromatic ring stretching from phenyl rings in TATP (This signal appears in TATP; shifted by +12 cm-1 from TATP )
1056 (vs) Aromatic C-H in plane deformation from phenyl rings in TATP and TPA. (slightly shown in spectrum of TATP and TPA but this signal increases after polymerization) 888 (m) Aromatic C-H out of plane band for 1,2,3,4-substituted benzene in TATP emerged
from the cyclized sector (only observed in cCMP and its model compound)
825 (s) Aromatic C-H out of plane band from para-substituted benzene in TPA and phenyl rings in TATP. Also present in spectrum of TPA and TATP.
797,752
(vw) C-H out of plane band for 1,2,3-substituted aromatic ring in TATP. The slight appearance of this peak is attributed to the small number of defects due to un-cyclized regions. (752 cm-1; present with strong intensity in spectrum of TATP.) 711 (m) C=N out of plane ring bending after cyclization. (not present in spectrum of both
S14
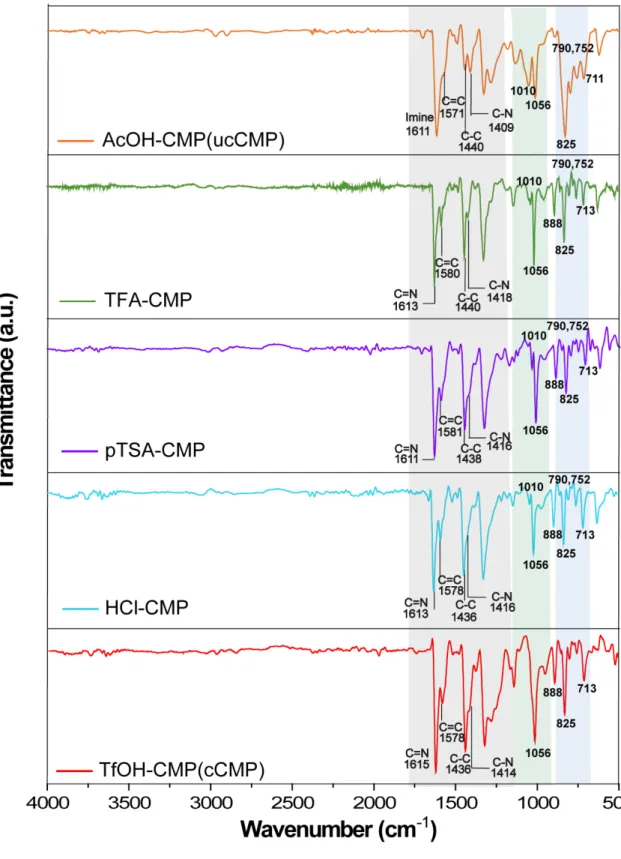
3.3 FT-IR Spectra of AcOH-, TFA-, pTSA-, HCl-, and TfOH-CMP
S15
S-4 Powder X-ray diffraction (PXRD)
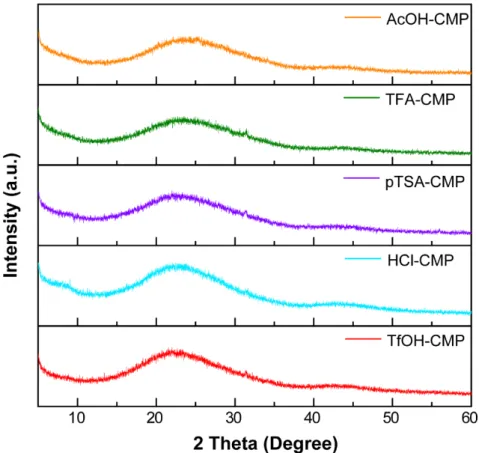
4.1 PXRD profiles of AcOH-, TFA-, pTSA-, HCl-, and TfOH-CMP
Figure S8. PXRD profiles of the series of CMPs in the 2 theta range of 5o to 60o, indicating amorphous
S16
S-5 X-ray Photoelectron Spectroscopy (XPS)
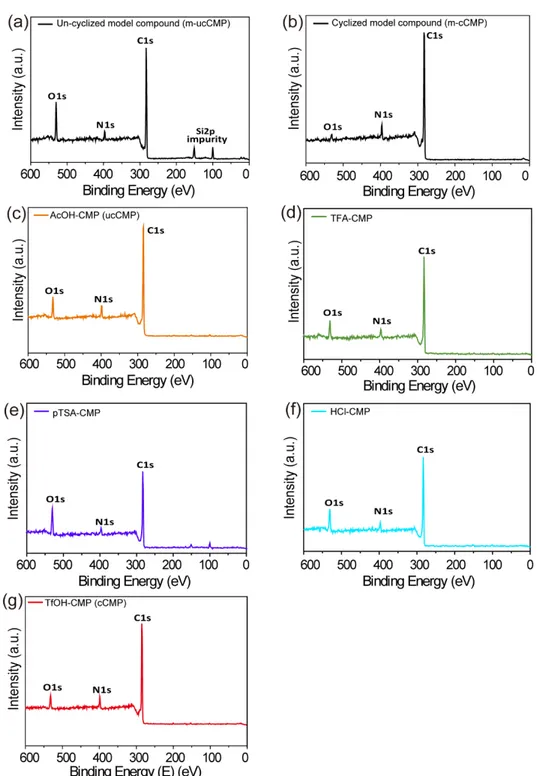
5.1 XPS survey scan of m-ucCMP, m-cCMP, and the series of CMPs
Figure S9. (a-g) XPS survey scan for (a) m-ucCMP, (b) m-cCMP, (c) AcOH-CMP (ucCMP), (d)
TFA-CMP, (e) pTSA-TFA-CMP, (f) HCl-TFA-CMP, and (g) TfOH-CMP (cCMP). The Si 2p and relatively high oxygen content in (a) are caused by residual silica gel (SiO2) from column chromatography. The
presence of oxygen can be ascribed to the moisture and/or atmospheric air on copper support/the surface of compounds and/or trapped within the internal pores.
S17
5.2 The deconvoluted X-ray photoelectron spectra of m-ucCMP, m-cCMP, and the series of CMPs
n Model compound of ucCMP (m-ucCMP)
n Model compound of cCMP (m-cCMP)
Figure S10. (a-b) (a) The C1s spectrum and (b) N1s spectrum for m-ucCMP. The slight amount of
oxidized C and N can be attributed to the presence of moisture and/or atmospheric CO2/O2 adsorbed
onto surface and/or trapped within the internal pores.
Figure S11. (a-b) (a) The C1s spectrum and (b) N1s spectrum for m-cCMP. The slight amount of
oxidized C and N can be attributed to the presence of moisture and/or atmospheric CO2/O2 adsorbed
S18 n AcOH-CMP (ucCMP)
n TFA-CMP
Figure S12. (a-b) (a) The C1s spectrum and (b) N1s spectrum for AcOH-CMP (ucCMP). The slight
amount of oxidized C and N can be attributed to the presence of moisture and/or atmospheric CO2/O2
adsorbed onto surface and/or trapped within the internal pores.
Figure S13. (a-b) (a) The C1s spectrum and (b) N1s spectrum for TFA-CMP. The slight amount of
oxidized C and N can be attributed to the presence of moisture and/or atmospheric CO2/O2 adsorbed
S19 n pTSA-CMP
n HCl-CMP
Figure S14. (a-b) (a) The C1s spectrum and (b) N1s spectrum for pTSA-CMP. The slight amount of
oxidized C and N can be attributed to the presence of moisture and/or atmospheric CO2/O2 adsorbed
onto surface and/or trapped within the internal pores.
Figure S15. (a-b) (a) The C1s spectrum and (b) N1s spectrum for HCl-CMP. The slight amount of
oxidized C and N can be attributed to the presence of moisture and/or atmospheric CO2/O2 adsorbed
S20 n TfOH-CMP (cCMP)
Figure S16. (a-b) (a) The C1s spectrum and (b) N1s spectrum for TfOH-CMP (cCMP). The slight
amount of oxidized C and N can be attributed to the presence of moisture and/or atmospheric CO2/O2
S21
S-6 Thermogravimetric Analysis (TGA)
6.1 Thermogravimetric analyses of AcOH-, TFA-, pTSA-, HCl-, and TfOH- CMP
Figure S17. Thermogravimetric analyses for a series of CMPs under air atmosphere. The weight loss
up to the temperature of 200oC was attributed to the residual solvents and/or moisture trapped within
the internal pores. The TfOH-CMP showed the highest thermal stability among the series of CMPs, thus providing the fact of the increased covalent C−C bonds upon the in-situ cyclization.
S22
S-7 Electrochemical measurement 7.1 Sample preparation
The mixture containing CMP (90 wt%) and 6% sodium carboxymethyl cellulose (CMC) aqueous solution (10 wt%) was prepared as a slurry. This slurry was casted onto Cu electrode and dried in a vacuum oven at 70 oC for 12 h.
7.2. Electric conductivity of ucCMP and cCMP
Figure S18. Electric conductivity of ucCMP (orange curve) and cCMP (red curve) on 60 𝛍𝐦 width Cu gap electrode. The ucCMP and cCMP displayed an almost linear I-V profile in air at 25 oC, whereas
the gap itself is silent irrespective of voltage bias. The electric current of cCMP is higher than that of ucCMP over the whole voltage range, indicating the extended π-conjugation upon cyclization. The measured current is rather difficult to compare with those of other reported porous organic polymers because of using different metal electrodes and gap width between electrodes.
S23
S-8 UV/Vis absorption studies 8.1 optical band gap calculation
The optical band gap (Eg) of CMPs were calculated by the Tauc plot.3
(αhν)(/* = 𝐴 (ℎ𝜈 − 𝐸 2)
α = absorption value measured by UV/Vis spectroscopy, h = Plank constant
ν = frequency, A = transition probability constant, r = constant depend on transition type We assumed that the transition probability is 1 where r = 1/2 to calculate direct band gap. The equation is translated into simple version as shown below.
(αhν)L = ℎ𝜈 − 𝐸 2
(αhν)L set as the Y axis while ℎ𝜈 as the X axis and then a linear line was extrapolated, the Eg was
calculated by intersect between the linear line and (αhν)L = 0.
Figure S19. (a) The full UV/Vis absorption spectra for a series of CMPs in the range of 250 to 1250
S24
S-9 BET surface area and pore size distribution analysis 9.1 Rouquerol plots of CMPs
Figure S19. (a-d) Calculated Rouquerol plots of a series of CMPs. Inset: expanded P/P0 region from
0.0 – 0.16. (a) TfOH-CMP, (b) HCl-CMP, (c) pTSA-CMP, and (d) TFA-CMP. The pressure ranges for the BET surface area calculations were selected in the range, where the term V(1-P/P0)
S25
9.2 BET linear plots of CMPs
Figure S8. BET linear plots of cCMP obtained from argon adsorption isotherms at 77K where the
pressure range were chosen from their Rouquerol plot. (a) TfOH-CMP (P/P0 = 0.01 – 0.14), (a)
HCl-CMP (P/P0 = 0.01 – 0.15), (a) pTSA-CMP (P/P0 = 0.01 – 0.11), and (a) TFA-CMP (P/P0 = 0.01 –
0.15)
Figure S20. BET linear plots of a series of CMPs obtained from Ar adsorption isotherms at 87 K,
where the pressure range was chosen from their Rouquerol plots. (a) TfOH-CMP (P/P0 = 0.01 – 0.14),
(a) HCl-CMP (P/P0 = 0.01 – 0.15), (a) pTSA-CMP (P/P0 = 0.01 – 0.11), and (a) TFA-CMP (P/P0 =
S26
9.3 Pore size distribution of CMPs
Figure S21. (a-b) The pore-size distribution with respect to (a) the differential pore volume and (b)
S27
Further explanation on the effect of in-situ cyclization on optical band gap
In order to validate the effect of the cyclization on the optical band gap, we additionally carried out post-cyclization reaction for ucCMP (post-ucCMP) with the strong acids by following the modified literature procedure.1The chemical structures of the post-ucCMP were successfully verified by using FT-IR spectroscopy. The FT-IR spectrum of post-cyclized ucCMP were in good agreement with those of cCMP and showed increased intensity of C=N (1611 cm-1) and C-C (1440 cm-1) stretching bands as well as relatively
stronger aromatic C-H in plane (1056 cm-1) and aromatic C-H out of plane (825 cm-1) deformation
compared to those of ucCMP (Figure S22). Importantly, the C-H out of plane band (888 cm-1) for
1,2,3,4-substituted benzene originated from the cyclized bond was found in the post-cyclized ucCMP. These consistency of IR characteristic bands between postcyclized ucCMP and cCMP supported the structural change of cCMP from imine to aromatic C=N bond upon in-situ cyclization, thus proving the fact that strong acids lead to higher degree of cyclization.
We further performed Raman analyses of post-ucCMP to show the difference in the ID/IG value
compared to those of ucCMP and cCMP to effectively reveal the C-C bond formation upon in-situ cyclization. The intensity ratio of D and G bands (ID/IG) was found to be 0.670 for post-ucCMP,
showing the increased number of sp2-hybridized carbon atoms upon cylication compared to that of
S28
Figure S22. FT-IR spectra of ucCMP (orange curve), Post-cyclized ucCMP (blue curve), and cCMP
S29
In addition, we have conducted solid-state UV/Vis absorption spectroscopy analysis for the post-ucCMP (Figure S24). The notable red shift for post-post-ucCMP compared to that of post-ucCMP validated that the reduction of band gap occurs from the further cyclizatin of imine bonds with neighboring carbons. This finding strongly supports increasing degree of cyclization with stronger acids for CMPs and its effect on the band gap.
Figure S23. The Raman spectrum of post-ucCMP measured at identical condition for the series of
CMPs. The higher ID/IG value of post-ucCMP than that of cCMP would probably resulted from the
un-cyclized imine bonds, evidenced from the presence of C-H in plane bands (1010 cm-1) in the IR
spectrum of post-ucCMP.
S30
S-10 References
(1) Tan, Q. T.; Chen, H. H.; Xia, H. D.; Liu, B. X.; Xu, B., Chem. Commun. 2016, 52, 537-540. (2) Wei, J.; Han, B.; Guo, Q.; Shi, X.; Wang, W.; Wei, N., Angew. Chem., Int. Ed. 2010, 49, 8209-8213.
(3) Pankove J. I. Optical Properties in Semiconductors; Prentice Hall: Inc., Englewood Cliffs, New Jersey, USA 1971.