How could Tippytea penetrate the organic,
sustainable and premium Swiss tea market?
Bachelor Project submitted for the degree of
Bachelor of Science HES in International Business Management by
Ana CULEBRAS ALMEIDA
Bachelor Project Advisor:
Fiorina MUGIONE, Chief entrepreneurship section Division on Investment and Entrepreneurship United Nations Conference on Trade and Development
Geneva, 4 June 2018
Haute école de gestion de Genève (HEG-GE) International Business Management
Declaration
This Bachelor Project is submitted as part of the final examination requirements of the Haute Ecole de Gestion de Genève, for the Bachelor of Science HES-SO in International Business Management.
The student accepts the terms of the confidentiality agreement if one has been signed. The use of any conclusions or recommendations made in the Bachelor Project, with no prejudice to their value, engages neither the responsibility of the author, nor the adviser to the Bachelor Project, nor the jury members nor the HEG.
“I attest that I have personally authored this work without using any sources other than those cited in the bibliography. Furthermore, I have sent the final version of this document for analysis by the plagiarism detection software stipulated by the school and by my adviser”.
Geneva, 4 June 2018
Acknowledgements
The project has been achieved thanks to my advisor, Ms. Fiorina Mugione, Chief of the Entrepreneurship Section in the Division on Investment and Enterprise of the United Nations Conference on Trade and Development. Ms Mugione trusted me and supported me, at any time I ran into a trouble spot concerning my research or writing. She consistently allowed this paper to be my own work, but steered me in the right direction, when she thought I needed it.
I would also like to thank the founder of Tippytea, Guillermo Jarrin because of his contribution during my trip to Ecuador. With his engagements and support, I successfully conducted interviews and technical visits in the country. I would also like to thank the Ecuadorian institutions, which took the time for interviews especially ConQuito, the Alliance for Entrepreneurship and Innovation and Pro Ecuador.
Finally, I would also like to acknowledge Mr. Alejandro Rubias Hernandez who was the second reviewer of this project and finally I would like to say I am gratefully indebted to all for their valuable inputs, comments and suggestions in this thesis.
Executive Summary
The project‘s goal is primarily to analyse tea market opportunities in Switzerland, and to study how Small and Medium-Sized Enterprises (SMEs) deal with the export process for the first time, building up sound business strategies to enter a market. The report takes into account the different barriers such as, the poor infrastructure, lack of access to new technologies and investment and trading facilities that SMEs in developing countries, such as Ecuador are facing to expand their business. Switzerland is a country where citizens enjoy a high standard of living. They have changed their consumers behaviours seeking healthy and environmentally friendly products, and there is an increased awareness of organic products benefits. The worldwide boom of organic products led Swiss consumers to change their consumption habits accordingly and they have allocated an increased share of their spending to buy quality products with bio certification. Swiss customers consume consciously, are aware of health issues and benefits of consuming organic products. The yearly Swiss climate is adequate for a large tea consumption and therefore, Switzerland represents an interesting market for premium quality tea products.
The apparently uniformization of tea as a good, offers to Tippytea, a sustainable and premium tea company from Ecuador, the advantage of differentiating its production following the new trends appreciated by consumers, such as the production traceability, the organic components and the social impact, including the promotion of decent jobs in rural areas, mainly for women. In niche markets, products with added value can make the difference compared to existing products. In Switzerland, niche markets segments that could be explored include the organic, sustainable and premium tea in medium or luxury hotels, and tea shops, cafés/bars, firstly as a pilot and then, medium high-end supermarkets to access other consumers.
Elderly people (over fifty-five years old) represents at present 18% of the Swiss population, they are the largest tea consumers in Switzerland and have a high purchasing power. Tippytea had four years of successful business expansion within Ecuador and gained experience in targeting young people between twenty-five to thirty-five years old. However, for the Swiss tea market, elderly consumers should not be neglected. A dedicated online survey among 18-29 years old confirmed that Swiss consumers appreciate tea blends and would accept an increase of price for organic tea produced in a sustainable manner. To conclude, Tippytea could penetrate the organic, sustainable and premium Swiss tea market by adapting its brand image to the ideal target customers that would appreciate premium organic tea and also value the social impact of the company.
Contents
Executive Summary 41
Introduction 11
1.1
Context 11
1.2
Objectives 12
1.3
Structure 12
1.4
Problem statement 13
1.5
Theoretical concepts 13
1.5.1
Internationalisation of firms 14
1.5.2
Global value chains 15
1.5.3
Market access 16
1.5.4
Trade facilitation 16
2
Analysis 18
2.1
Worldwide tea market 18
2.1.1
Ecuadorian tea market 29
2.1.2
Swiss tea market 37
2.2
Outlook on Tippytea 44
2.2.1
Implementation of a new culture 45
2.2.2
Market positioning 46
2.2.3
Competitors 47
2.2.4
Target consumers 49
2.2.5
Public and private institutions supporting entrepreneurship 50
2.3.1
PESTEL analysis 54
2.3.2
Tea competitors 58
2.3.3
Consumers’ analysis and consumption habits 63
2.3.4
Potential importers 65
2.4
Swiss certifications standards and regulations 68
2.4.1
Bio quality standards 69
2.4.2
Trade agreements 71
2.4.3
Institutions 72
3
Discussion 77
3.1
Options and recommendations 77
4
Conclusion 79
5
Bibliography 81
Appendix 1: Interview with Mr. Hernando Flores 31.01.2018 92
Appendix 2: Interview with Ms. Natalia Almeida 08.02.2018 95
Appendix 3: Customer survey on tea consumption habits in Switzerland 99
Appendix 4: Results of the survey on tea consumption habits in Switzerland 103
Appendix 5: Potential consumer profile of tea blends in Switzerland 106
Appendix 6: Interview with Mr. Robert Ley 12.03.2018 109
List of Tables
Table 1 Global tea exports values, 2010-2016 20
Table 2 Global tea exports in tons, 2010-2016 20
Table 3 Global tea exports values, 2013-2016 21
Table 4 Global tea exports in tons, 2013-2016 22
Table 5 Tea consumption in tons 24
Table 6 Global tea imports values, 2010-2016 24
Table 7 Global tea imports in tons, 2010-2016 25
Table 8 Global tea imports values, 2013-2016 26
Table 9 Global tea imports in tons, 2013-2016 27
Table 10 Ecuadorian tea exports values, 2010-2016 30
Table 11 Ecuadorian tea exports in tons, 2010-2016 30
Table 12 Ecuadorian tea exports values, 2013-2016 31
Table 13 Ecuadorian tea exports in tons, 2013-2016 32
Table 14 Ecuadorian tea imports values, 2010-2016 33
Table 15 Ecuadorian tea imports in tons, 2010-2016 34
Table 16 Ecuadorian tea imports values, 2013-2016 35
Table 17 Ecuadorian tea imports in tons, 2013-2016 36
Table 18 Swiss tea exports values, 2010-2016 37
Table 19 Swiss tea exports in tons, 2010-2016 38
Table 20 Swiss tea exports values, 2013-2016 39
Table 22 Swiss tea imports values, 2010-2016 41
Table 23 Swiss tea imports in tons, 2010-2016 42
Table 24 Swiss tea imports values, 2013-2016 42
Table 25 Swiss tea imports in tons, 2013-2016 43
Table 26 Summary of Ecuadorian tea competitors 49
Table 27 Ecuadorian population 50
Table 28 PESTEL analysis of Switzerland 57
List of Figures
Figure 1 World tea production in tonnes, 2000-2016 19
Figure 2 Tea production share by region, 2000-2016 19
Figure 3 Global tea exports values, 2010-2016 20
Figure 4 Global tea exports in tons, 2010-2016 21
Figure 5 Global tea exports values, 2013-2016 22
Figure 6 Global tea exports in tons, 2013-2016 23
Figure 7 Global tea imports values, 2010-2016 25
Figure 8 Global tea imports in tons, 2010-2016 25
Figure 9 Global tea imports values, 2013-2016 26
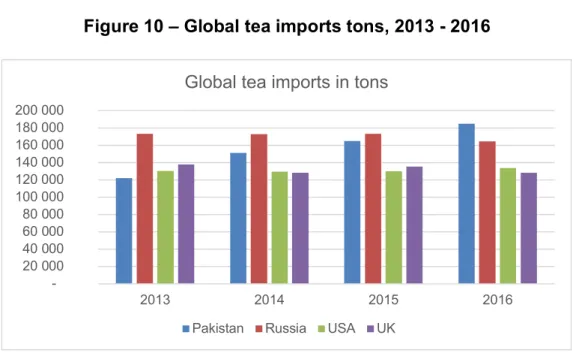
Figure 10 Global tea imports in tons, 2013-2016 27
Figure 11 Historical tea prices, 2007-2017 28
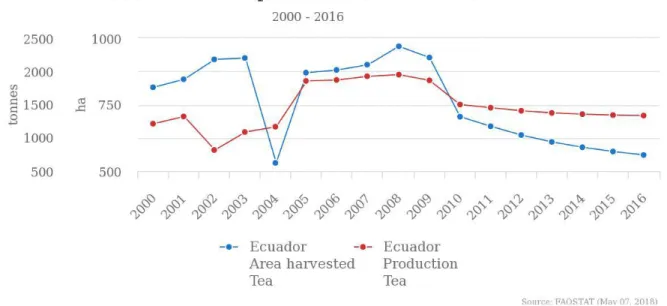
Figure 12 Tea production in tons in Ecuador, 2000-2016 29
Figure 13 Ecuadorian tea exports values, 2010-2016 30
Figure 14 Ecuadorian tea exports in tons, 2010-2016 31
Figure 15 Ecuadorian tea exports values, 2013-2016 32
Figure 16 Ecuadorian tea exports in tons, 2013-2016 33
Figure 17 Ecuadorian tea imports values, 2010-2016 34
Figure 18 Ecuadorian tea imports in tons, 2010-2016 34
Figure 19 Ecuadorian tea imports values, 2013-2016 35
Figure 21 Swiss tea exports values, 2010-2016 38
Figure 22 Swiss tea exports in tons, 2010-2016 38
Figure 23 Swiss tea exports values, 2013-2016 39
Figure 24 Swiss tea exports in tons, 2013-2016 40
Figure 25 Swiss tea imports values, 2010-2016 41
Figure 26 Swiss tea imports in tons, 2010-2016 42
Figure 27 Swiss tea imports values, 2013-2016 43
Figure 28 Swiss tea imports in tons, 2013-2016 44
1 Introduction
1.1 Context
The partner organisation for this project is the not-profit United Nations Conference on Trade and Development (UNCTAD) that is part of the United Nations (UN) Secretariat. UNCTAD provides analysis, facilitates consensus-building, and offers technical assistance to developing countries and economies in transition (UNCTAD, 2018).
UNCTAD is divided into the following five divisions;
● Division on Africa, Least Developed Countries and Special Programmes, ● Division on Globalisation and Development Strategies,
● Division on International Trade in Goods, Services, and Commodities, ● Division on Investment and Enterprise,
● Division on Technology and Logistics.
The Bachelor research project is part of the Division on Investment and Enterprise (DIAE). This Division is in charge of the issues related to investment and enterprise for sustainable development (UNCTAD, 2018). The thesis is linked to the Entrepreneurship section of the Division. UNCTAD is committed to implement the Sustainable Development Goals (SDGs) that are set by 2030 and adopted by the international community, ensuring a new way of meeting the current economic, social and environmental sustainable challenges (UN Department of Public Information, 2018). The SDGs provide significant perspectives for developing countries. In 2017, in the scope of the Global Entrepreneurship Week, the DIAE organised a contest to select ten worldwide entrepreneurs that made an impact in different SDGs. During a week, selected entrepreneurs came from all over the world to a pitch contest at UNCTAD and attend meetings at other institutions within Geneva. One of the finalists was an Ecuadorian tea company called Tippytea Blends. Tippytea is a fair-trade company working with indigenous women in rural parts of Ecuador and using locally grown organic herbs and fruits to produce specialist loose-leaf tea blends.
Tippytea Blends has been selected as the company provides solutions to different SDGs challenges. It tackles primarily goal number eight by promoting decent work and economic growth in rural parts of the country, but its impact can also be related to goals number ten by reducing inequalities, and number twelve promoting a responsible consumption and production as the company grows only organic products.
1.2 Objectives
The goal is primarily to give insights about the market opportunities of tea in Switzerland and to analyse how businesses deal with the export process for the first time. While doing the thesis, the first insight is the theoretical concepts of the internationalisation of firms, the implementation of the Global Value Chains system, the requirements to access a market and the trade facilitation aspects necessary to expand a business. By developing a complete analysis of the Swiss tea market, this research will allow to relate most of the topics studied during the Bachelor’s degree with the real practice such as, business strategies, barriers for Small and Medium-Sized Enterprises (SMEs) to enter a market and a sector analysis.
1.3 Structure
The report is divided into four sections and finalised with appendices. Firstly, the introduction begins with a summary of the research question. Then, there is a review of the theoretical concepts focusing on a general understanding on the internationalisation of firms, that has been a result of globalisation, the economic model of the Global Value Chains (GVC), the market access and trade facilitation and its importance for SMEs. Finally, the last concept presents the different trade facilitation a company can benefit from in order to internationalise its business.
The first chapter analyses the worldwide tea market trends and precisely the Ecuadorian and Swiss tea industry, based on literature review and different databases. Then, it provides an outlook on the Ecuadorian tea company, Tippytea. It contains a performance analysis of Tippytea since the creation of the company, through its milestones, target consumers, challenges the company faced in trying to implement a new culture of tea in Ecuador, and its positioning in the local tea market. Moreover, there is a detailed analysis of the various private and public Ecuadorian institutions that support entrepreneurs and specifically Tippytea to expand locally and internationally.
Then, the research analyses the Swiss environment through a PESTEL methodology, identifying the different competitors and the tea consumption habits in the country. The local tastes and preferences of tea have also been assessed through a quantitative online research on tea consumers’ preferences in Switzerland targeting a particular age range. Furthermore, through qualitative interviews, the imports patterns and requirements have been identified. In addition, information is provided on the certifications’ standards and packaging requirements, and all legal obligations, including tariffs and taxes to export tea to Switzerland. A concluding session includes a summary of the findings and a presentation of the different options and
recommendations. At the end of the report, there is an additional conclusion synthesising the main points on how Tippytea could develop a business strategy to export to Switzerland.
1.4 Problem statement
From 1950 to today, the world has known a Great Acceleration due to the increase of population. According to the UN DESA / Population Division (2018) that took a census of the World Population in the Prospect 2017, in 1950, the world population was of 2.5 billion persons and in 2015, it reached around 7 billion people (7,383,008.820). This enormous increase of population leads to necessary changes in the production methods, distribution of scarce resources and consumption habits (Maeder, 2018).
Globalisation is defined as the global interconnectedness in economic, political and cultural relations. Globalisation “embraces structural economic linkages associated with rising levels of trade, finance and investment, the political and cultural influences of transnational actors and international institutions, and the impact of their ideas on domestic policy” (Weiss, 2007). As a result, the internationalisation of firms has changed the way companies operate and source their activities throughout their value chains. The technological advances made by Multinational Corporations (MNCs) led small and medium enterprises (SMEs) in developing countries to adapt to the demand changes. However, while trying to upgrade their business activities, SMEs do not beneficiate of economies of scale, the same efficiency and productivity level as MNCs do. The integration of SMEs into this new economic system has often made local suppliers to loose their competitiveness.
The report aims to analyse the different barriers that SMEs in developing countries face to increase their competitiveness and access international markets. The poor infrastructure, lack of access to new technologies and investment are examples of barriers that SMEs in developing countries face in growing their companies.
1.5 Theoretical concepts
The research question, “How could Tippytea penetrate the organic, sustainable and premium Swiss tea market?”, will be analysed based on different concepts. In this context, the theory of firm internationalisation will guide to understand the modalities of market entry and the issues related to trade facilitation.
1.5.1 Internationalisation of firms
Internationalisation has been an effect of Western economies concentration of production and rise of firms’ size in the post war expansion (Ietto-Gillies, 2014) and has been analysed through various concepts throughout the years. Welch and Luostarinen (1988) defined internationalisation as “...the process of increasing involvement in international operations...” referring to the inward and outward activities of a company implemented in new locations. Internationalisation refers to a range of options for operating outside an organisation’s country of origin (Gerry, J., Whittington, R., Scholes, K., Angwin, D. and Regnér, P., 2009). The primary incentive of internationalisation of firms is to expand and grow a business. According to theory, determinants of internationalisation include cost efficiencies, innovation and technology advancements, competitiveness strategies related to the interdependence between countries, government facilitation in trade policies, technical standards and host government policies and finally, the opportunities in new markets, as to respond to similar customer needs, global customers and transferable marketing (Yip, 2003). The limitation of internationalisation of firms is imposed by the balance between the benefits and the costs of internationalisation.
The internationalisation process of firms, especially sales, has advantaged MNCs. MNCs have been able to adapt to changes, to benefit of economies of scale due to their large production volumes by reducing their costs in outsourcing activities to lower labour cost countries and creating added value with their final products. Cost related benefits are not the only reason for the internationalisation of firms. According to Dunning, enterprises seek cross border activities if they are able to acquire certain assets unavailable to other country’s enterprises and those assets are called “the OLI Paradigm” (1988). The OLI Paradigm stands for Ownership specific advantages, Location endowments and Internationalisation advantages. Ownership specific advantages enhance capital, technology, marketing, organisational and managerial skills. By exploiting location variables in a host country, enterprises could benefit of investment incentives, tariffs, government policies and infrastructure (Dunning, 1988).
The advancements in information and communication technologies (ICT) have eased the access of emerging economies to international trade, allowing selected companies to beneficiate from economies of scale and increase of productivity.
Countries with a deficit in their trade balance have been trying to increase and contribute to the international trade in order to raise the competitiveness of their SMEs. For developing economies, international activities represent a rise in economic growth, reduction of unemployment and development of local SMEs that expect to become large firms with time. SMEs are seeking opportunities in international markets to expand their business and grow.
However, SMEs still face disadvantages and trade barriers that do not allow them to participate and compete in the global economic system. In contrast to MNCs, SMEs in developing countries face problems in meeting quantity, quality and lead time requirements and therefore, are unable to meet targets and deadlines set by the production requirements. Finally, SMEs face cost-related issues in order to expand the business infrastructure for a higher productivity and production of final products. Internationalisation has entry barriers and difficulties because of the lack of market information and knowledge, which is necessary when trading with an unfamiliar country, procedures, legal and cultural environment.
1.5.2 Global value chains
Global trade saw an increase of intermediate goods implemented in between stages in the production process. “The fragmentation of production processes and the international dispersion of tasks and activities within them have led to the emergence of borderless production systems – which may be sequential chains or complex networks and which may be global, regional or span only two countries. These systems are commonly referred to as global value chains (GVCs)” (UNCTAD, 2013).
The contemporary economy has significantly changed in areas of international trade and industrial organisation. Throughout the supply chain, GVCs have been mostly coordinated by MNCs to their arm’s length suppliers. The rapid expansion of Foreign Direct Investment (FDI) thanks to leading MNCs lead GVCs to seek an efficiency approach through countries specialisation, an opportunity to increase income and employment throughout their network (OECD, 2007).
Globalisation in production and trade has lead MNCs to redefine its core competencies and focus on high value-added sectors as product strategy, marketing and innovation. On the other side, the “non-core” functions such as, production are coordinated across in new geographies in various countries to gain efficiency in operations (Gereffi, 2005). With the availability of cheap, rapid and reliable communications that permitted the development of international production systems, GVCs, became key to expand trade around the world through supply chains connecting people in different places with producers and consumers around the world. Developing economies also have a chance in participating in GVCs. Their benefits would represent a growth in potential export capabilities, leverage services to build knowledge capabilities and move to high-value niches within the GVCs (Gereffi, 2015).
To ensure a global economic development, the active participation of SMEs in the GVC allow the economy to prosper (Gereffi and Lee, 2012). The integration can bring them stability, a
raise in productivity and expand their business. “Co-operation with a network of upstream and downstream partners can enhance a firm’s status, information flows and learning possibilities and increases the chances of success of small firms in the value chain.” (OECD, 2007) However, data showed that only 10% of SMEs in developing countries are able to adapt to changes (UNCTAD, 2006). SMEs are unable to fully participate into GVC due to insufficient working capital and their inability to upgrade technologies and services.
1.5.3 Market access
Over the last years, market access has been highly influenced by trade agreements that provide preferential tariffs rates to trading partners. Broadly, market access helps to reduce trade barriers, such as tariffs in order to increase international trade flows.
Economic development is fundamentally delivered by SMEs, as they are major actors in employing people and generating income. The access of SMEs to international markets is crucial for their growth and economic development. Market linkages may allow SMEs to win more trade. However, market access is not only dependent on disadvantages exporters may face to domestic producers, but also on the pros and cons related to competitors from other countries.
Market access is measured through two main aspects of trade policies. First, there is the direct market access conditions which include the overall tariffs faced by a country exporter. The second captures relative market access conditions which include exports tariffs faced by foreign competitors (Fugazza and McLaren, 2013). Governments and policymakers could influence the outcome of market access by concluding commercial agreements with other countries.
1.5.4 Trade facilitation
Trade facilitation can be defined broadly or analysed through different lenses. Trade facilitation covers a wide range of issues from information technology capabilities to transport and logistics services (WTO, 2015). The WTO defines trade facilitation as “the simplification and harmonisation of international trade procedures” covering the “activities, practices and formalities involved in collecting, presenting, communicating and processing data required for the movement of goods in international trade” (WTO, 2018).
The fast evolution and expansion of global trade lead trade facilitation to become the main goal of the Doha Round of the WTO. The Doha Round covers the freedom of transit of goods, fees and formalities related to importing and exporting and transparency of trade regulations (OECD, 2005). The main objective of trade facilitation is to liberalise trade policies, expand global trade, connect countries and globalised production system. The issues trade facilitation is facing is to reach a uniform consent between the multilateral parties to create Trade Facilitation Agreement (TFA) and put them in practice.
According to the World Trade Organisation (WTO) (2018), the benefits of implementing trade facilitation “could reduce trade costs by an average of 14.3% and boost global trade by up to $1 trillion per year, with the biggest gains in the poorest countries”. TFAs are greatly enjoyed by developing countries due to their largest gain. It integrated better their economies into the global economy and ensure their development. SMEs also benefit from FTAs the first time they export and since the costs of complying with procedures are higher for them.
By reducing trade barriers, the participation of SMEs in global trade is boosted. Due to their small structure, SMEs are less equipped to deal with complex regulatory environments such as trade procedures, customs and trade regulations. Trade facilitation could promote the entry of SMEs in the export sector.
2
Analysis
The second and main part of the project consists of an analysis of the various aspects that any company has to take into consideration in deciding to export tea to Switzerland. It starts with a worldwide tea trend analysis and complemented with a deeper dire into Ecuadorian and Swiss tea, including production, export and import levels. An outlook on Tippytea Blends is introduced in the section to be followed by the Swiss export market analysis going through the Swiss macro environment, the tea companies present in Switzerland and a quantitative research to assess the consumers preferences and tastes and potential importers. To complete this second chapter, the Swiss regulations including standards on certifications and legal requirements for organic products are included.
2.1 Worldwide tea market
Tea has started being traded from the 15th century to 17th during the colonialism era. It started with the Portuguese in the Far East and the Dutch in the West that quickly spread the tea consumption in countries such as France, Germany and United Kingdom (UNCTAD, 2016). Therefore, tea is one of the oldest beverages in the world and the second most popular beverage.
Supply
According to the Food and Agriculture Organisation (FAO), from 2000 the production of tea has increased from 3,231,081 tonnes to 5,954,091 tonnes in 2016 (Figure 1) (FAO, 2018). This increase of 54.27% represents 2.7 million tonnes. Yields and productivity improvement can explain this growth. The worldwide supply of tea comes mainly from Asia with a strong 84.1% of the total production, followed by Africa with 13.7% (Figure 2). In 2016, the largest producer of tea was China counting for 2,401,784 tonnes, then, India with 1,252,174 tonnes and Kenya 473,000 tonnes (FAO, 2018).
Figure 1 – World tea production in tonnes, 2000 - 2016
Figure 2 – Tea production share by region, 2000 - 2016
Exports
Concerning the global tea export, the values increased from USD 6.4 billion (bn) in 2010 to USD 7.4 bn exported value in 2016 (Table 1) (ITC, 2018). The export sector is important for a country as it generates revenue, employment in rural areas and earnings for the governments.
Table 1 Global tea exports values, 2010 - 2016
(Thousand dollar)
2010 2011 2012 2013 2014 2015 2016
Exported
value 6,474,702 7,095,107 7,212,635 8,036,551 7,812,596 7,342,750 7,488,256 Source: ITC, Trade map (2018)
Figure 3 – Global tea exports values, 2010 - 2016
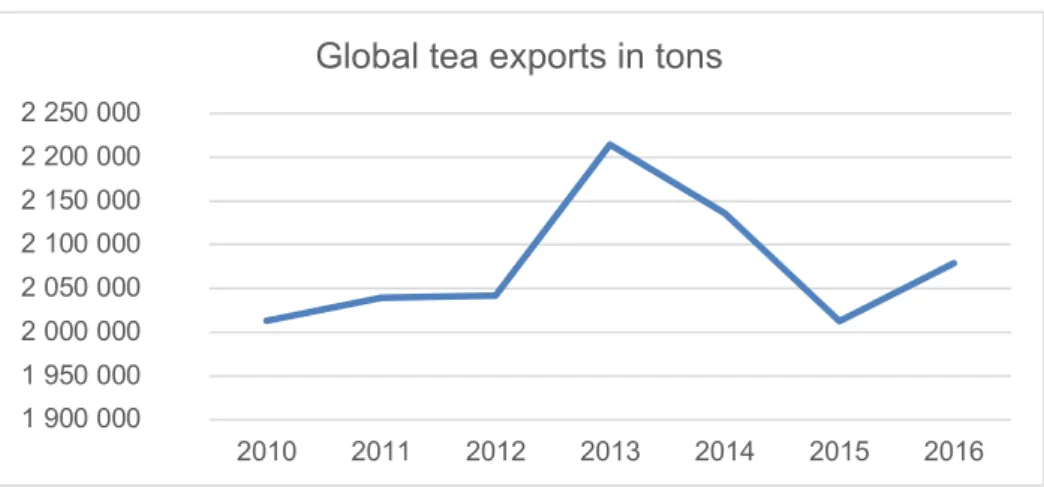
In 2016, the ITC trade map count 2,078,805 tons of tea that have been exported. Throughout six years, between 2010 and 2016, the values have fluctuated. In 2013 the highest peak reached 2,214,401 tons and in 2015 the lowest peak attained 2,012,568 tons exported worldwide. In comparison with exported values in USD, the trends are equal, with a high peak in 2013 and since then, it slowly decreased.
Table 2 Global tea exports in tons, 2010 - 2016
2010 2011 2012 2013 2014 2015 2016
Exported
tons 2,012,996 2,039,695 2,041,681 2,214,401 2,135,962 2,012,568 2,078,805 Source: ITC, Trade map (2018)
1 000 000 2 000 000 3 000 000 4 000 000 5 000 000 6 000 000 7 000 000 8 000 000 9 000 000 2010 2011 2012 2013 2014 2015 2016
Figure 4 – Global tea exports in tons, 2010 - 2016
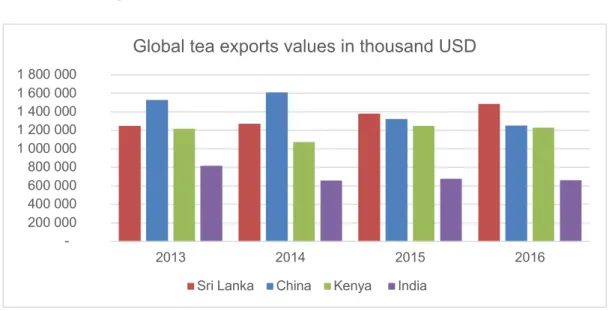
Tea production in China, which is the largest producer of tea, has increased throughout the years but their exports decreased. The leading exporter is China with a value of USD 1.5 bn (Table 3). China is the only exporting country, who steadily increase its export value in the three analysed years. China grows multiples varieties of teas to satisfy its local market as the first consumer of tea worldwide. Sri Lanka, also an important producer of tea, has decreased its tea exports. Kenya and India, two large producers of tea, are the third and fourth exporters of tea in 2016.
Table 3 Global tea exports values, 2013 - 2016
(Thousand dollar) 2013 2014 2015 2016 China 1,246,308 1,272,663 1,381,530 1,485,022 Sri Lanka 1,528,519 1,609,339 1,321,899 1,251,730 Kenya 1,218,162 1,071,451 1,248,739 1,229,106 India 816,055 656,214 677,933 661,719
Source: ITC, Trade map (2018)
1 900 000 1 950 000 2 000 000 2 050 000 2 100 000 2 150 000 2 200 000 2 250 000 2010 2011 2012 2013 2014 2015 2016
Figure 5 – Global tea exports values, 2013 - 2016
The largest actors in exports of tea are the same in USD than in tons. In terms of tons, in 2016, Kenya is the first exporter of tea with a value of 481,076 tons and the first exporter in USD values, Sri Lanka is ranked third with 286,760 exported tons in 2016 (Table 4). In the three analysed years, Sri Lanka decreased its exports valued while Kenya and China still increased theirs and gaining more market share.
Table 4 Global tea exports in tons, 2013 - 2016
2013 2014 2015 2016
Kenya 448,809 458,728 421,632 481,076
China 325,806 301,606 325,290 331,797
Sri Lanka 355,251 325,141 304,835 286,760
India 254,672 212,606 235,132 230,456
Source: ITC, Trade map (2018)
200 000 400 000 600 000 800 000 1 000 000 1 200 000 1 400 000 1 600 000 1 800 000 2013 2014 2015 2016
Global tea exports values in thousand USD
Figure 6 – Global tea exports in tons, 2013 - 2016
Demand
Regarding market trends, the organic retail consumption has considerably increased in the last sixteen years. According to the Research Institute of Organic Agriculture, in 2000, the organic retail sales were of USD 18,059.48 million and in 2016, it reached USD 101,007.07 million (FiBL Statistics, 2018). This increase shows the huge demand of organic/bio trend among consumers. Tea benefits have been highly emphasised since this healthy lifestyle trend started, which can explain this rapid growth for tea consumption. According to FAO, there are approximately three billion people consuming tea in the world, therefore, tea is the second most popular beverage after water.
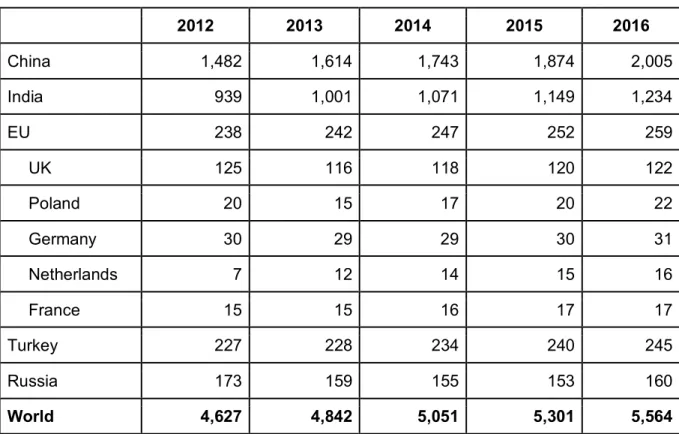
The rapid growth of tea consumption was due to the Chinese demand which represents one third of the world consumption. Another emerging economy -India- is the second largest consumer and producer of tea in the world (Table 5). The tea consumption between 2012 and 2016 has increased in every country.
100 000 200 000 300 000 400 000 500 000 600 000 2013 2014 2015 2016
Global tea exports in tons
Table 5 Tea consumption (‘000 tons)
2012 2013 2014 2015 2016 China 1,482 1,614 1,743 1,874 2,005 India 939 1,001 1,071 1,149 1,234 EU 238 242 247 252 259 UK 125 116 118 120 122 Poland 20 15 17 20 22 Germany 30 29 29 30 31 Netherlands 7 12 14 15 16 France 15 15 16 17 17 Turkey 227 228 234 240 245 Russia 173 159 155 153 160 World 4,627 4,842 5,051 5,301 5,564Sources: UN Food and Agriculture Organisation (FAO) & The Economist Intelligence Unit (2015)
Imports
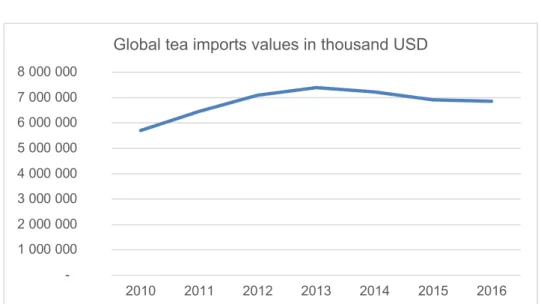
Overall, the imported value of tea increased between 2010 and 2016 from USD 5.7 bn to USD 6.8 bn which represents a growth of 16.7% (Table 6). Nevertheless, imports have not been steadily increased. Between 2010 and 2013, the imported value raised of USD 1.7 bn. The tea imports were at its highest in 2013 with a value of USD 7.4 bn and since then, slightly decreased and stagnated, reaching USD 6.8 bn in 2016.
Table 6 Global tea imports values, 2010 - 2016
(Thousand dollar)
2010 2011 2012 2013 2014 2015 2016
Imported
value 5,703,569 6,452,324 7,095,745 7,394,074 7,230,649 6,910,319 6,848,981 Source: ITC, Trade map (2018)
Figure 7 – Global tea imports values, 2010 - 2016
The global tea imports in tons between 2010 and 2016 are differently represented than the import values in USD (Figure 8). The quantities have been volatiles since 2013 and has known the highest peak of values in 2014 with 2,149,133 imported tons. In the three years analysed, there is an upward trend, but with ups and downs.
Table 7 Global tea imports in tons, 2010 - 2016
2010 2011 2012 2013 2014 2015 2016
Imported
tons 1,833,955 1,853,249 1,974,856 1,917,451 2,149,133 1,901,709 1,870,827 Source: ITC, Trade map (2018)
Figure 8 – Global tea imports in tons, 2010 - 2016
1 000 000 2 000 000 3 000 000 4 000 000 5 000 000 6 000 000 7 000 000 8 000 000 2010 2011 2012 2013 2014 2015 2016
Global tea imports values in thousand USD
1 600 000 1 700 000 1 800 000 1 900 000 2 000 000 2 100 000 2 200 000 2010 2011 2012 2013 2014 2015 2016
The five largest tea importers, which are Russia, Pakistan, United States of America (USA), United Arab Emirates (UAE) and United Kingdom (UK) have also decreased their import values between 2013 and 2016 (Table 8). Pakistan and USA remain the two importers which slightly increased in their import values. Russia is the fourth largest consumer of tea and due to their low level of production (449 tons in 2016), their tea imports generated the highest value. In 2016, Russia reached a tea value import of USD 548 million.
Table 8 Global tea imports values, 2013 - 2016
2013 2014 2015 2016 Russia 657,076 645,822 637,829 548,259 Pakistan 318,390 328,287 458,103 489,960 USA 475,853 467,328 468,841 483,725 UAE 695,399 677,860 468,277 483,590 UK 423,085 373,540 400,951 362,871
Source: ITC, Trade map (2018)
Figure 9 – Global tea imports values, 2013 - 2016
Comparing in tons, Russia and Pakistan are still major actors in the tea industry. Russia was ranked first between 2013 and 2015 and had the largest amounts of tons of tea imported but since 2016, the values slightly decreased and therefore, it ranked second in world imports (Table 9). 100 000 200 000 300 000 400 000 500 000 600 000 700 000 800 000 2013 2014 2015 2016
Global tea imports values in thousand USD
Table 9 Global tea imports in tons, 2013 - 2016
2013 2014 2015 2016 Pakistan 121,900 150,948 164,642 184,886 Russia 173,070 172,607 173,065 164,398 USA 130,162 129,264 129,708 133,487 UK 137,615 128,118 135,229 128,104Source: ITC, Trade map (2018)
Figure 10 – Global tea imports tons, 2013 - 2016
Prices
Regarding tea prices, the past ten years have been very volatile for the commodity. The price fluctuation represents the supply and demand and the weather conditions for tea. According to the Economist Intelligence Unit (2015), in ten years, the price has doubled from approximately USD 1.8/kg to USD 2.9/kg (Figure 11). Tea is a seasonal commodity, in the middle of the year, tea prices tend to increase while at the end of each year, the prices decrease. In 2012, the world faced a drought and as yields are highly dependent on weather conditions, the shortage of supply made the prices sharply increase again.
20 000 40 000 60 000 80 000 100 000 120 000 140 000 160 000 180 000 200 000 2013 2014 2015 2016
Global tea imports in tons
Figure 11 – Historical tea prices, 2007 - 2017
Summary
Tea worldwide consumption is increasing and according to the FAO, the production and exports will meet the demand. Healthy regimes and lifestyles possess a great influence on tea consumption. Nevertheless, the supply and demand of tea can be affected by different factors. Regarding the supply of tea, the producing countries benefit of an adequate climate to grow tea, which has to be humid and rainy, but with climate change is threatening yields. The temperatures are rising, it can have an impact on yields and can cause the loss of hectares of crops. Then, there is a tendency in countries to urban development, which makes the rural areas to disappear more and more. Climate change can influence producers to change the production location of tea, but producers are facing urbanisation, which decreases the available rural areas in countries. Finally, the producing countries, which are considered as developing countries, can benefit of new technologies improvements such as online commerce to increase the trading of tea. However, investment is lacking and therefore, producers cannot access new technologies and improve logistic transports to raise productivity.
On the demand side, tea is driven by many factors, firstly, its price. However, it influences only relatively tea consumption. The most competing and substitutable beverage of tea is coffee. They both have an effect on the consumption of the other. A decrease in the price of tea may result in an increase of tea consumption and a decrease for coffee beverage. In recent years, the tendency for organic/bio and healthy products is rising and the awareness of the tea benefits have become more significant. Finally, tea is still being associated to a warm beverage, the consumption is higher in cold seasons, which creates a seasonal demand for tea.
2.1.1 Ecuadorian tea market
For many years, Ecuadorian consumers were used to drink coffee rather than tea for cultural reasons and cultural heritage. Nowadays, some companies are reversing this trend by starting to produce and sell domestically tea. Ecuador is not the most competitive country for tea as coffee or cocoa, but the tonnes of tea produced and exported levels still slowly growing. Supply
Between 2000 and 2010, production of tea in Ecuador has faced some ups and downs, going from the lowest 815 tonnes produced in 2002 to its highest score in 2008 of 1,950 tonnes. Since then, in 2010, 1,499 tonnes of tea were produced, and it slightly decreased in 2016 to reach 1,334 tonnes (Figure 12). Few regions of the country are suitable for the production of tea. Ecuador has a tropical climate and the adequate regions for tea production are very attractive. In 2015, the FAO estimated to 5,788.4 hectares of agricultural areas and 12,547.88 hectares of forest in Ecuador (FAO, 2018).
Figure 12 – Tea production in tons in Ecuador, 2000 - 2016
Exports
The low national production level is hampered tea export levels. The total value exported from Ecuador in 2016 reached USD 1.3 million (Table 10) (ITC, 2018). Between 2010 and 2015, the values have been slowly increasing with the exception of a low peak in 2011. In 2016, its value decreased from USD 1.6 million to USD 1.3 million.
Table 10 Ecuadorian tea exports values, 2010 - 2016
(Thousand dollar)
2010 2011 2012 2013 2014 2015 2016
Exported
value 1,133 953 1,068 1,254 1,365 1,594 1,341
Source: ITC, Trade map (2018)
Figure 13 – Ecuadorian tea exports values, 2010 - 2016
As for values in USD, the values and representation of the curve are very similar. The highest value was in 2015 with 830 tons exported from Ecuador. Since then, the value in 2016 reached the same level as in 2013 (Table 11 and Figure 14).
Table 11 Ecuadorian tea exports in tons, 2010 - 2016
2010 2011 2012 2013 2014 2015 2016
Exported
tons 668 557 633 697 749 830 697 Source: ITC, Trade map (2018)
200 400 600 800 1 000 1 200 1 400 1 600 1 800 2010 2011 2012 2013 2014 2015 2016
Figure 14 – Ecuadorian tea exports in tons, 2010 - 2016
Analysing in greater details in the exporting countries for Ecuadorian tea, there might be a determinant factor of proximity, all the countries are situated in the Americas. Ecuador’s three first exports markets are USA, Colombia and Costa Rica. The Ecuadorian tea export market is highly dominated by US with an export value of USD 819 thousand in 2016, while the export value to Colombia is of USD 221 thousand (Table 12). Overall, the exported values have been very volatile from 2010 to 2016.
Table 12 Ecuadorian tea exports values, 2013 - 2016
(Thousand dollar) 2013 2014 2015 2016 USA 667 906 986 819 Colombia 220 212 273 221 Costa Rica 199 132 137 132 Uruguay 68 46 71 47
Source: ITC, Trade map (2018)
100 200 300 400 500 600 700 800 900 2010 2011 2012 2013 2014 2015 2016
Figure 15 – Ecuadorian tea exports values, 2013 - 2016
Similarly, the exported values in USD and in tons are following the same trend. The USA is largely dominant in this sector (Figure 16). There is also a possible factor of proximity dominating the exports in tons, but there is the apparition of Malaysia as the fourth exporters of tea for Ecuador, with 47 tons in 2016 (Table 13).
Table 13 Ecuadorian tea exports in tons, 2013 - 2016
2013 2014 2015 2016
USA 404 509 565 447
Colombia 99 93 124 106
Costa Rica 91 61 61 56
Malaysia 72 65 46 47
Source: ITC, Trade map (2018)
0 200 400 600 800 1000 1200 2013 2014 2015 2016
Ecuadorian tea exports values in thousand USD
Figure 16 – Ecuadorian tea exports in tons, 2013 - 2016
Demand
Ecuador is used to drink coffee and soft drinks, such as Coke and Fanta. There is no data on the consumption of tea in Ecuador or on the number of cups of teas drunk per day, but the low level of imports might reflect a low demand.
Imports
As for the export section, the values are very volatile, however the market is decreasing. Between 2010 and 2012, the import values doubled the amounts going from USD 278 thousands to reach a value of USD 480 thousands (Table 14). Then, between the year 2013 and 2016, the value decreased more than half from USD 388 to USD 160 thousands.
Table 14 Ecuadorian tea imports values, 2010 - 2016
(Thousand dollar)
2010 2011 2012 2013 2014 2015 2016
Imported
value 278 417 480 388 209 290 160
Source: ITC, Trade map (2018)
100 200 300 400 500 600 2013 2014 2015 2016
Ecuadorian tea exports in tons
Figure 17 – Ecuadorian tea imports values, 2010 - 2016
Throughout the six years, there has been an upward trend in tea imports in tons until 2013, where it reached the highest value with 60 tons (Table 15). The values doubled in three years, going from 29 tons in 2010 to 60 tons in 2013. Before that in 2011, the imports were also high with 53 tons of tea imported in Ecuador.
Table 15 Ecuadorian tea imports in tons, 2010 - 2016
2010 2011 2012 2013 2014 2015 2016
Imported
tons 29 53 46 60 46 42 47 Source: ITC, Trade map (2018)
Figure 18 – Ecuadorian tea imports in tons, 2010 - 2016
0 100 200 300 400 500 600 2010 2011 2012 2013 2014 2015 2016
Ecuadorian tea imports values in thousand USD
10 20 30 40 50 60 70 2010 2011 2012 2013 2014 2015 2016
Ecuador is importing tea from China, US, Germany and Spain. As China represents the largest producers of tea worldwide, Ecuador had an imported value of USD 126 thousand in 2016 from China (Table 16). China produces mainly green tea and black tea, which are some varieties that are not grown in Ecuador. Year after year, the import values have been decreasing. Before 2016, Ecuador did not import tea from Spain and since then, the imported value reached USD 7 thousand.
Table 16 Ecuadorian tea imports values, 2013 - 2016
(Thousand dollar) 2013 2014 2015 2016 China 93 101 135 126 USA 138 63 107 33 Germany 13 13 0 8 Spain 0 0 0 7
Source: ITC, Trade map (2018)
Figure 19 – Ecuadorian tea imports values, 2013 - 2016
The tea imports in Ecuador are coming from all over the world, China, Germany, USA, Spain and Indonesia. Comparing the values of tea imports in USD and in tons, USA has been a major actor, but its market decreased, while imports from China continue to growth (Figure 19 and 20). 0 20 40 60 80 100 120 140 160 2013 2014 2015 2016
Ecuadorian tea imports values in thousand USD
Table 17 Ecuadorian tea imports in tons, 2013 - 2016
2013 2014 2015 2016 China 27 22 28 40 Germany 1 1 0 3 USA 15 12 6 2 Indonesia 4 1 3 1Source: ITC, Trade map (2018)
Figure 20 – Ecuadorian tea imports in tons, 2013 - 2016
Summary
To sum up the Ecuadorian tea trends, the market is relatively small in the country. The competing beverage of coffee is very strong in Ecuador. Tea supply is expected to grow again, with more hectares to be planted referring the levels of 2012. Ecuador’s tea exports are low and need to expand to other regions than the Americas, such as Europe. The demand for tea in Ecuador is also small. Few companies are developing this niche market of fruit and herbal premium teas within the country. However, the substitute coffee might loose some market shares, as the benefits of tea are raising awareness for a healthier lifestyle.
5 10 15 20 25 30 35 40 45 2013 2014 2015 2016
Ecuadorian tea imports in tons
2.1.2 Swiss tea market
According to the FAO statistics, Switzerland possesses 1,508 hectares dedicated to agricultural activities and 1,254 are forest (FAO, 2015). Switzerland constitutes a large tea consumer, where citizens consume on a daily basis tea. The country has scarce resources and do not produce wider primary products. The trade balance has a deficit of USD 8.5 million, therefore, the tea import values are greater than exports.
Supply
Swiss tea production is extremely low and even non-existent for the FAO statistics. The land and weather conditions in Switzerland do not allow farmers to grow tea. Therefore, they import the raw material from different producing countries and transform it into a final product to be able to export.
Exports
Swiss tea exports have been hugely increasing between 2010 and 2016 (Table 18). Considering only 2010 to 2013, the values doubled from USD 8.4 million in 2010 to its highest USD 32 million in 2013. This represents an increase a 380% in the Swiss export tea market. Between 2013 and 2016, the values decreased of USD 7.3 million but still higher than in 2010.
Table 18 Swiss tea exports values, 2010 - 2016
(Thousand dollar)
2010 2011 2012 2013 2014 2015 2016
Exported
value 8,443 17,242 20,088 32,149 26,036 23,826 24,799 Source: ITC, Trade map (2018)
Figure 21 – Swiss tea exports values, 2010 - 2016
In 2016, Switzerland exported 4,252 tons of tea. Between 2010 and 2016, the Swiss tons of tea exported doubled (Table 19). The largest increase has been done between 2012 and 2013, where it rose by 1,245 tons. As for the exports in USD, in 2013, the country exported at its highest with 4,075 tons on tea.
Table 19 Swiss tea exports in tons, 2010 - 2016
2010 2011 2012 2013 2014 2015 2016
Exported
tons 1,928 2,677 2,830 4,075 4,160 4,125 4,252 Source: ITC, Trade map (2018)
Figure 22 – Swiss tea exports in tons, 2010 - 2016
5 000 10 000 15 000 20 000 25 000 30 000 35 000 2010 2011 2012 2013 2014 2015 2016
Swiss tea exports values in thousand USD
500 1 000 1 500 2 000 2 500 3 000 3 500 4 000 4 500 2010 2011 2012 2013 2014 2015 2016
Swiss tea exports reach mostly European countries such as UK, France and Netherlands. This configuration might be explained by the trade facilitation through trade agreements between the European Union and Switzerland. Japan is positioned fourth in the Swiss export market, which proves the strong culture and heritage of tea since ages of the country. Japan is the only exporters for which the values still increasing. The largest decrease is in the French export values that went down from USD 12.4 million in 2013 to 7.4 million in 2016 (Table 20).
Table 20 Swiss tea exports values, 2013 - 2016
(Thousand dollar) 2013 2014 2015 2016 UK 11,589 11,155 9,209 9,814 France 12,383 6,942 7,552 7,447 Netherlands 3,488 2,993 2,736 2,423 Japan 1,619 1,654 1,427 2,336
Source: ITC, Trade map (2018)
Figure 23 – Swiss tea exports values, 2013 - 2016
Regarding the Swiss tea exports in tons the three first largest countries are the same as for the values in USD, which are UK, France and Japan. In this case, the fourth ranked is Ireland with a value in 2016 of 93 tons (Table 21). Compared to the values in USD, with the values in tons, the UK is largely the largest exporter country for Switzerland.
2 000 4 000 6 000 8 000 10 000 12 000 14 000 2013 2014 2015 2016
Swiss tea exports values in thousand USD
Table 21 Swiss tea exports in tons, 2013 - 2016
2013 2014 2015 2016 UK 3,125 3,309 3,055 3,393 France 296 319 376 307 Netherlands 243 124 256 107 Ireland 76 57 72 93Source: ITC, Trade map (2018)
Figure 24 – Swiss tea exports in tons, 2013 - 2016
Demand
Three-quarters of Swiss imports come from the European Union (EU) (EIU, 2017). Switzerland has a high purchasing power and according to Euromonitor International, Swiss consumers prefer premium teas (Euromonitor, 2018). The country is a large tea consumer with an imported value of USD 33.3 million in 2016 (Table 22) (ITC, 2018). A survey was done on 2,085 Swiss citizens in February 2015 by the Federal Office for Food Security and Veterinary affairs (OSAV) within Switzerland and showed that people between eighteen and seventy-five years old drink in average 2.9dl of tea per day and per person (OSAV, 2017). The increasing number of tea companies and premium brands selling through retailers and/or their own shop shows the boom of demand for this product.
500 1 000 1 500 2 000 2 500 3 000 3 500 4 000 2013 2014 2015 2016
Swiss tea exports in tons
Imports
As Switzerland do not produce tea, the country imports tea from producing countries to manufacture it within Switzerland, put the premium brand and export it to trading partners. The imports values increased from USD 25 million in 2010 to USD 33 million in 2016 (Table 22). In 2014, the values reached its highest with USD 36 million and afterwards, start decreasing and now are stagnating.
Table 22 Swiss tea imports values, 2010 – 2016
(Thousand dollar)
2010 2011 2012 2013 2014 2015 2016
Imported
value 24,959 28,334 28,809 35,687 36,649 33,761 33,377 Source: ITC, Trade map (2018)
Figure 25 – Swiss tea imports values, 2010 – 2016
The upward trend in the Swiss tea imports values in USD is also distinguishable in tons (Table 22 and 23). The highest score has been in 2015 with a value of 5,917 tons imported in Switzerland. Since then, the following year, it has slightly decreased, but remained quite stable since 2013. 5 000 10 000 15 000 20 000 25 000 30 000 35 000 40 000 2010 2011 2012 2013 2014 2015 2016
Table 23 Swiss tea imports in tons, 2010 - 2016
2010 2011 2012 2013 2014 2015 2016
Imported
tons 3,692 4,295 4,623 5,889 5,788 5,917 5,836 Source: ITC, Trade map (2018)
Figure 26 – Swiss tea imports in tons, 2010 - 2016
The main importers of Swiss tea brands are Germany, Netherlands, UK, Poland and China. Most of the importing countries are located in Europe, which can benefit of trade facilitations between the European Union and Switzerland. Germany and Netherlands increased their exports between 2013 and 2016 (Table 24). But the other countries steadily decreased the demand for Swiss tea. In 2013, the UK imported a value of USD 6 million and in 2016, it went down to USD 4 million.
Table 24 Swiss tea imports values, 2013 - 2016
(Thousand dollar) 2013 2014 2015 2016 Germany 8,383 8,524 8,374 9,124 Netherlands 411 1,614 4,563 6,204 UK 6,448 5,794 4,960 4,336 Poland 3,165 3,460 3,198 2,795 China 2,393 2,796 2,244 2,173
Source: ITC, Trade map (2018)
1 000 2 000 3 000 4 000 5 000 6 000 7 000 2010 2011 2012 2013 2014 2015 2016
Figure 27 – Swiss tea imports values, 2013 - 2016
Netherlands have increased their competitiveness towards exports of tea to Switzerland (Figure 27 and 28). In 2016. Germany was ranked first with an import value in Switzerland of USD 9 million, while in tons, the country is third with 779 tons. All the countries mentioned as the fourth largest importers of tea in Switzerland are part of the European Union, which ease the trade with Switzerland.
Table 25 Swiss tea imports in tons, 2013 - 2016
2013 2014 2015 2016
Netherlands 126 324 2,072 2,834
UK 1,820 1,386 1,178 1,187
Germany 684 623 695 779
Poland 242 243 251 235
Source: ITC, Trade map (2018)
1 000 2 000 3 000 4 000 5 000 6 000 7 000 8 000 9 000 10 000 2013 2014 2015 2016
Swiss tea imports values in thousand USD
Figure 28 – Swiss tea imports in tons, 2013 - 2016
The Swiss tea market reflects the global consumption of tea. It started with a rapid growth until 2013 and then, it faced a stagnation phase and a small decrease until 2016. The purchasing power and the awareness of tea benefits of consumers can be a combination to increase the tea consumption. Overall tea supply and demand, the markets have been increasing reaching records between 2010 and 2013 but since 2015, the consumption is slightly decreasing. The organic/bio trend has started in 2000 but reached its peak value in 2016. Producing companies of organic products are continuing raising awareness towards their customers on health benefits and tea is one of them.
2.2 Outlook on Tippytea
Tippytea is an Ecuadorian tea company, which has been created in 2013 by Guillermo Jarrin, a tea sommelier and passionate of tea. Tippytea employs fourteen full time staff and it is, therefore, considered as a SMEs. At present, the company’ activity is only in Ecuador. It owns two shops, one office, a production plant and a cellar. In addition, the company has two shops franchised located in the country’s two largest cities and all the shops are located in shopping malls. In addition, the company sells online within Ecuador. Tippytea average earnings are USD 10,000 to USD 12,000 coming from sales per month per shop.
In its distribution centres, the company serves more than forty varieties of tea. Customers have also the opportunity to buy some tea on a priced by weight base. The company managed to diversify the business by selling accessories for tea and some baked products. Moreover, the company is offering six different tea blends either in bags or loose-leaf tea in the largest supermarket chain in Ecuador, which is called Corporación Favorita. This chain has 293 stores
500 1 000 1 500 2 000 2 500 3 000 2013 2014 2015 2016
Swiss tea imports in tons
in six different countries in South America and had a profit of USD 2,301 million in 2016 (Corporación Favorita, 2018). Tippytea products are sold in the Favorita’s main supermarkets throughout the country.
Although Tippytea faced at inception some difficulties in penetrating the local market, it succeeds thanks to their original offering of tea blends. The company creates its blends by using black tea, chai tea, chamomile, fruit tea, green tea, matcha tea, oolong as a base and then it mixes it with ingredients grown by indigenous women in Ecuador’s rural areas. The adding are apples, carrots, ginger, hibiscus, lemon, mint, rose extract, orange, physalis and strawberry. The company imports the basic products that possess organic certifications through a Canadian broker such as, black tea, white tea and jasmine from China, lavender from France, green tea and matcha tea from Japan and rooibos tea from South Africa. The company highlights the origin and the bio-organic certification of all its products.
In its business development, the company’s strategy was to establish a strong brand image and consolidate its business in Ecuador before starting to export. After four years of activities, the company decided that it was time to explore international markets.
2.2.1 Implementation of a new culture
In 2017, Ecuador produced 625’000 coffee bags of 60kg each and exported a value of USD 17 million in 2017, compared to the exported value of USD 1.5 million of tea (ICO, 2018) (ITC, 2018). Ecuadorian coffee is considered to be one of the best in the world in terms of quality. As the production of coffee is well-developed and the country has an appropriate climate to grow coffee, Ecuadorians are used to consume more coffee.
Four years ago, Tippytea made a market survey on drinking habits in Ecuador before the company establishment. As a result of this survey, people interviewed highlighted their consumption of coffee several times per day and at any season of the year, while the results for tea consumption was pretty low. In order to implement this new culture of tea in Ecuador, the company’s strategy was to raise awareness on tea benefits on health.
Tippytea describes its mission as the following: “Create a culture for the consumption of herbals tea; in order to commercialise innovative products, with a certain quality, which will positively influence our clients’ lives.” This represents an ambitious challenge for the company. Before Tippytea developed its business, there was a low consumption of tea and mainly in cafeterias, while now, the branding is designed to appeal local customers in shopping malls.
2.2.2 Market positioning
Since its creation, Guillermo Jarrin had a clear vision of the brand image and the experience he wanted to deliver with the company’s products. Before the company’s establishment, he realised a quantitative survey on tea preferences and habits of a sample population in Quito, Ecuador. He based the company’s strategy on the following results:
● People associate tea to a healthy and digestive beverage, ● Preference is to drink tea on cold days,
● Tea drinking is sharing it with friends or family, not alone, ● Tea provides a well-being and relaxation feeling,
● People associate tea to brown, green and black colours,
● Potential customers identified tea with: flavour, quality, natural products, healthy, aroma and a positive visual image.
The company’s business strategy included to design attractive products, make them look as an international brand, which would enhance a luxury and refined aspect. The founder wanted his brand to contain a part of English style without falling in the boring or classical. This decision was made as England appeared to be the first country to which Ecuadorian citizens relate to when they think of tea. The company wants to be associate to different adjectives as:
● Healthy, ● Innovative, ● International, ● Modern, ● Unique in Ecuador, ● Young.
In addition to all these aspects, Tippytea wanted to ensure the tastes, harmony and quality of the ingredients the company is offering and highlighted the benefits of the beverage. The company does not only serve organic products, but they guarantee a sustainable growth in the production process and all the company’s activities, as per the UN SDGs. One of the company’s first marketing argument is the culture and heritage of growing primary products in Ecuador. Their suppliers of ingredients are small communities in the country’s rural areas that possess bio certifications. This respect of the environment and of the cultural communities’ heritage creates a social impact. In fact, it is mostly indigenous women who are in charge of growing the yields in the rural areas.
2.2.3 Competitors
At the time Tippytea started their company, in 2013, there were only few businesses that spotted the market opportunity. Some companies such as Twinning, Lipton, Hornimans or Le Thé were selling tea in bags in supermarkets. These products are well known by Ecuadorians, but they are not considered as direct competitors. These are brands owned by multinational corporations that produce tea bags in larger quantities, which allow them to reduce their costs, therefore, the selling price for final products is lower.
Most of the direct competitors started analysing the business model, expansion and success of Tippytea to decide to enter the market. Even if tea was not the most drinkable beverage in Ecuador, the number of tea companies started increasing since then. Actually, there are four companies competing with Tippytea on a different scale. Two of them have established tea shops in the two biggest cities of Ecuador, one sells tea in a vegan shop and finally, the last one is offering similar tea products in supermarkets. For each competitor, there is no price indication on their website or any media, but according to Tippytea, they are in the same price range.
Tea shops ● Amatea
Amatea, which can be separated into “Ama” and “tea” which means “love tea”, is an Ecuadorian tea shop established since 2013, before Tippytea (Amatea, 2018). The company’s distribution channel is done through three shops located in shopping malls around the capital Quito. These shops offer a variety of premium teas certified by the European Union. The company also uses a basis of green tea, Oolong tea, black tea, Pu-Erh tea, rooibos and other herbs to create tea blends by mixing it with roses for example. On the company media pages, there is no information about the origins of ingredients. In their shops, customers can buy tea in a different format, they have a variety of tea accessories and they can drink a tea either cold as frappés or warm, while enjoying some baked products.
Regarding the packaging, the company wanted its brand to appeal luxurious, the colours used are black, dark brown, gold and white. There is a neutral logo and different packaging proposed to clients for instance, in metallic gold boxes, small glass recipient or loose tea leaves in a plastic recipient.
Finally, Amatea is very active on social media, it is their main channel to reach and communicate with their customers. The company wants to create a close relationship with its