ARE CROP MODELS ABLE TO SIMULATE CROP
GROWTH UNDER SHADE?
Artru S1, Dumont B2, Lassois L3, Garré S4*
* Correponding author: [email protected]
(1) AgricultureIsLife, UR TERRA, University of Liège, Gembloux Agro-Bio Tech, Gembloux, Belgium (2) UR AgroBioChem, Université de Liège, Gembloux Agro-Bio Tech, Gembloux, Belgium
(3) UR BIOSE, Université de Liège, Gembloux Agro-Bio Tech, Gembloux, Belgium (4) UR TERRA, Université de Liège, Gembloux Agro-Bio Tech, Belgium
Introduction
In agroforestry systems, the presence of tree canopy not only reduces the incident light for the crop, but also induces a dynamic spatio-temporal light pattern. At the scale of a cropping season, the interrow species are subjected to an intensification of shade following the tree phenology. At the daily time scale, the tree canopy induces a dynamic heterogeneous light environment according to the path of the sun, the field configuration, the species choice and tree management (Liu 1991). Furthermore, this light environment evolves throughout the system evolution over the years, following tree growth. These light alterations induce physiological and morphological differences for crop species growing beneath the trees, which in turn affect crop yield. In view of the large diversity and the long term dynamics of agroforestry systems, having a clear overview of crop responses to this specific environment remains difficult.
In this context models are powerful research tools that can help to improve our understanding of crop growth under reduced light conditions and to generate insights on long term growth and productivity of complex mixed systems.
Nevertheless most crop models deal with crops growing under full sunlight conditions. Models taking into account interspecific competition for global radiation generally use a shading algorithm in order to estimate the proportion of global radiation available for the intercropped species (Knörzer et al. 2011). This approach induces a reduction of the daily cumulated global radiation, but neglects the spatio-temporal variability which is characteristic for agroforestry system. From an agronomic point of view, this raises the question whether they are able to predict crop growth under a dynamic light environment. In this study, we evaluate the ability of the model STICS to predict winter wheat (T. aestivum L.) development and yield under a reduced and variable light environment while using the daily cumulative value of global radiation as input variable.
Material and methods
Field experiment. In 2014, an artificial shade structure was installed on the land of the experimental farm of Gembloux Agro-Bio Tech in Belgium (50°33’ N, 4°42’E) to evaluate winter wheat growth, productivity and quality under shade. Shaded conditions were obtained by covering the north face of a greenhouse tunnel structure installed in the field in East-West orientation with military cloth. The installation of the shade layers followed the phenology of a hybrid walnut tree. Three contrasted light conditions were obtained. The continuous shade (CS) treatment reduced the proportion of light during the entire day. The periodic shade (PS) treatment corresponded to an intermittent shade on the plot varying within the day. The no shade (NS) treatment corresponded to the control plot, under which 100% of the incident light is transmitted to the crop. Light at the crop canopy level was measured with quantum sensors (CS300 – Campbell Scientific Inc., USA). During the growing season, crop phenology, biomass development, leaf area, final yield and protein content were monitored.
Modelling strategies. The STICS crop growth model (STICS v8.4, INRA, France) is fully described in the literature and validated for a broad range of crop species (Brisson et al. 1998; Brisson et al. 2008). It is a generic crop model simulating the soil–plant–atmosphere system dynamics on a daily time step. The input variables are daily climatic data (global radiation, air temperature, air relative humidity, wind speed and rain), soil properties (clay content, nitrogen content, water-holding capacity …) and technical itinerary (date, depth and density of sowing, dates and amounts of N supply …). In addition, the STICS model requires specific plant parameters. For winter wheat, plant parameters were previously calibrated and validated for the soil and climate environment of the Gembloux experimental farm by Dumont (2013). A large number of output variables are obtained upon a simulation. In this study, the main output variables of interest are the total above-ground biomass and end-season variables such as grain yield, number of grain and grain weight.
First step. All simulations were launched with the same initial set of plant parameters (Set 1),
identical soil and technical itinerary description, but two distinct daily global radiation data sets were imposed as daily climatic input: the global radiation recorded during the growing season in 2014 under the NS, PS and CS treatments.
Second step. As the data fit was not entirely satisfactory, we added simulations with two
adjusted sets of plant parameters (Set2 and 3) taking into account physiological differences between shaded and unshaded plants. For the set 2, the values of two species dependent parameters involved in the determination of the number of grains (see (Brisson et al. 2008)), CGRAIN (g-1 m²) and CGRAINvo were modified (Tab. 1). In parameter set 3, the value of a
parameter determining the grain weight value, VITIRCARbT, was adjusted in addition to the modifications of parameter set 2 (Tab. 1). In order to adjust these parameters we used additional data from two others winter wheat fields of the experimental farm.
Model evaluation. The ability of STICS to simulate the aboveground biomass, final grain yield
and yield components (number of grain per m² and grain size) was evaluated by confronting the simulation outputs with field observations recorded during the growing season under three light regimes (NS, PS and CS). The root mean square errors (RMSE) and the Nash-Sutcliffe model efficiency (NSE) were used as model evaluation criteria.
Tab. 1 Plant parameters sets
Set 1 Set 2 Set 3
CGRAIN 0.045 0.08 0.08 CGRAINvo 0 -0.6691 -0.6691 VITIRACARb T 0.0006 5 0.00065 0.000625 Results
Field observation. The artificial shade layers were applied 10 days before crop flowering
according to the observed tree phenogy. In this condition, winter wheat experienced equivalent light conditions before it reached the full development of its leaf area. Therefore the reduction of transmitted global radiation mainly affected yield elaboration processes. Observations showed a significant yield reduction for the CS and PS treatment (-45% and – 24% respectively, Anova p-value : 1.48.10-10) in comparison to the NS treatment. This decrease is related to a significant
reduction of both grain weight (-32% and -18% respectively, Anova p-value : 1.5.10-4) and grain
number (- 18% and -14% respectively, Anova p-value : 1.75.10-7) under the CS and PS
treatments.
Simulation outputs. Whatever the parameter set used, the winter wheat total aboveground
biomass (MASEC, t/ha) dynamics were correctly reproduced under the 3 treatments (see RSME). This is expected, since the varied parameters only affect processes involved in grain elaboration (Fig.1).
Fig. 1 Model output simulation and field observed data of the total aboveground biomass (t/ha) under the NS (no shade) and CS (continuous shade) treatment. Vertical bars represent the standard error of the means of observed data and RMSE the root mean square error value.
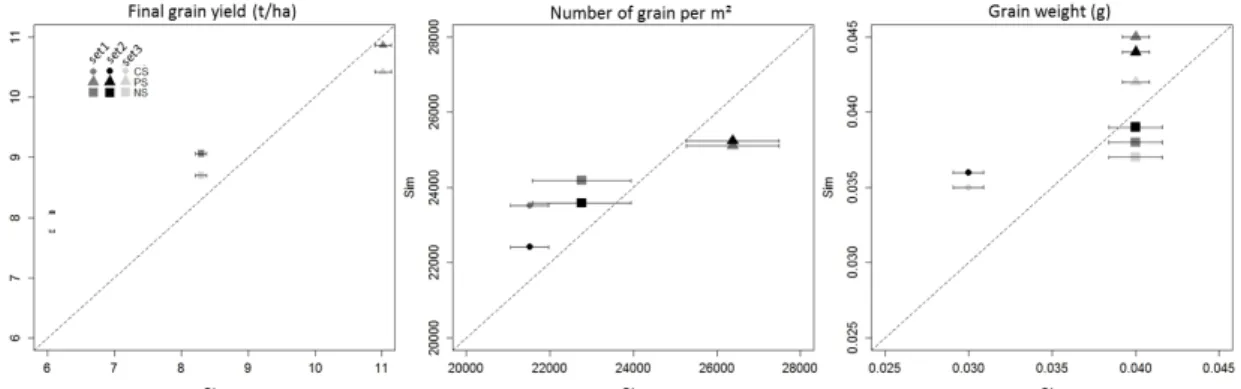
The simulations reflected the gradient observed in the field experiment for the final yield (t/h): final yield and yield components (number of grain per m² and grain weight) decreased with increasing shade (Fig. 2). Nevertheless, for both treatments (CS and NS) the relative reduction
of yield was higher in the field (- 45% and – 24 %) than in the simulation (around -25% and -16 % for the 3 sets). Under the CS treatment, the relative reduction of grain number and grain weight were underestimated whatever the parameter set used.
Overall, plant parameter set 2 allows improving the grain number prediction for the CS and PS treatment without having a detrimental impact on the NS simulations (set 1: RMSE=1595 t/ha and NSE=3.1; set 2: RMSE=963.17 and NSE=0.8). For the grain weight, we observed an increase of the overestimation under the CS treatment with set 2; while for PS this set improves the prediction. Using the set 2, we observed that the decrease of grain number is compensated by an increase of grain weight. Therefore, final grain yield was still overestimated for CS and PS with no differences between set 1 and 2 for the three light treatments.
The additional adjusted parameter of set 3 improves the final yield prediction (set 1 and 2: RMSE=1.24 t/ha and NSE=10.3; set 3: RMSE=1.06 and NSE=5.9) through a decrease of grain weight for the three treatments. As such, set 3 allows reducing the grain weight and grain number outputs.
Fig. 2 Simulated versus measured winter wheat final grain yield, number of grains per m² and grain weight for the two sets of plant parameters (set 1 and 2) and the two light treatments (CS, NS). Horizontal bars represent the standard error of the means of the observed data.
Discussion
This first attempt to understand and predict the behavior of winter wheat under shade environment consisted of running the STICS model by modifying solely the daily GR input. Preliminary results for the shade treatment show that a reduction in final grain yield, yield component and total aboveground biomass accumulation are predicted by STICS for both shade treatments (CS and PS), but with lower differences between treatments than the field observation.
Without the adaptation of plant parameters (set 1), STICS overestimates final grain yield for the CS and PS treatment. The correction of three species-dependent parameters involved in grain number and grain weight estimation improves the model prediction. Nevertheless, the model still appeared unable to correctly simulate final yield under the two shade treatments with a common set of parameters. In addition, the expected sensitivity of the crop to shade during the yield elaboration period, ca. fixed here at 20 days before flowering, is currently not reflected in the simulations.
To go further, additional data from other fields and different years will be used to improve the parameter calibration. Furthermore, the yield formalism of the STICS model will be discussed in future work.
Finally, the question of the ability of STICS to simulate final yield of crops growing under dynamic light environment by using a common set of plant parameters remains unresolved. Nevertheless, this first work was only a preliminary attempt on improving the crop component in order to advance with coupled tree-crop models with regard to light interaction in an agroforestry context, and further investigation is needed.
Acknowledgements
We thank the University of Liège, Gembloux Agro-Bio Tech and more specifically the research platform AgricultureIsLife for the funding of this research project. We also wish to thank all the technicians of the different departments, M-P Hiel, PhD student, as well as Pr. B. Bodson, director of the experimental farm, for their help with the field and forest experiment. We thank the Royal Meteorological Institute for the weather data availability.
Brisson N, Launay M, Mary B, Beaudoin N (2008) Conceptual basis, formalisations and parametrization of the STICS crop model, Quae. Versailles
Brisson N, Mary B, Ripoche D, et al (1998) STICS: a generic model for the simulation of crops and their water and nitrogen balances. I. Theory and parameterization applied to wheat and corn. Agronomie 18:311–346. doi: 10.1051/agro:19980501
Dumont B (2013) Incertitude liées à la modélisation agro-environnementale en vue de développer des outils d’aide à la décision. Université de Liège, Gembloux Agro-Bio Tech
Knörzer H, Grözinger H, Graeff-Hönninger S, et al (2011) Integrating a simple shading algorithm into CERES-wheat and CERES-maize with particular regard to a changing microclimate within a relay-intercropping system. Field Crops Research 121:274–285. doi: 10.1016/j.fcr.2010.12.016
Liu N (1991) Light distribution in tree intercropping area and its agricultural value. In: Agroforestry systems in China, The chinese academy of forestry and international development research centre. pp 14–21