www.advsustainsys.com
Polydopamine Nanoparticle Doped Nanofluid for Solar
Thermal Energy Collector Efficiency Increase
Daniel Hauser, Lukas Steinmetz, Sandor Balog, Patricia Taladriz-Blanco, Dedy Septiadi,
Bodo D. Wilts, Alke Petri-Fink, and Barbara Rothen-Rutishauser*
DOI: 10.1002/adsu.201900101
micrometer-sized carbon particles seeded in shellac which is commonly used as black paint.[5] One major problem with the India
Ink approach is the clogging of critical tubing equipment and pumps, therefore, this approach is increasing the costs due to the necessity of regular equipment replace-ment. With the rise of nanotechnology, a new set of promising nano materials appeared: Researchers started to evaluate a plethora of nanomaterials for their heating properties and the toolbox was broadened significantly to engineer more efficient heating solar fluids.[6] Taylor et al. reported
a heating efficiency increase of up to 10% when doping solar fluids with nano-particles.[7] More specifically, aluminum
oxide (Al2O3), zinc oxide (ZnO), and
magnesium oxide (MgO) nanoparticle-containing solar fluids (i.e., nanofluids) were reported to significantly increase the solar fluids’ efficiency.[8] The addition of carbonaceous structures
(i.e., carbon nanotubes, carbon nanohorns) has also proven to increase the heating efficiency.[9] Moreover, silver nano particles
(Ag NPs) have been investigated for the same purpose.[10] Even
though nanofluids undeniably increase efficacy of solar thermal energy collectors, they still possess several limitations such as an increase of the installation cost because of the loss of stability of nanomaterials over time (i.e., aggregation and dissolution), making pumping difficult and heating properties might get lost. It has also been shown that the dopant could promote erosion and/or corrosion of the tubing.[2] Additionally, according to a
standard procedure, the solar fluid has to be exchanged every two years, generating challenges in terms of waste disposal, as some of the dopants are toxic.[11] Therefore, there is a need of a
stable, nontoxic but highly efficient alternative to boost heating converters. We recently reported the design of hybrid polydopa-mine (PDA) nanoparticles which are efficient in converting UV-light into heat, nontoxic also at high concentrations, stable and reproducible.[12] All those properties indicate hybrid PDA
nano-particles as an interesting candidate in a DASC setting.
PDA hybrid NPs were synthesized as previously reported by Bergtold et al.[12b] As a capping protein bovine serum albumin
(BSA) was used. BSA served as a proof-of-concept protein; once the system has been proven to be efficient, BSA can be substi-tuted by an active protein exercising a function to optimize the system even further. This is, however, outside of the scope of this study. Different particle sizes were produced and measured by dynamic light scattering (DLS): big PDA/BSA (bPDA/BSA, 3527 nm), medium PDA/BSA (mPDA/BSA, 776 nm), and small PDA/BSA (sPDA/BSA, 81 nm) (Figure 1). Subsequently recorded
Polydopamine can form black nanoparticles and has recently been gaining attention due to its extraordinary heating properties upon excitation with light. Herein, polydopamine hybrid nanoparticles are synthesized in different sizes and subsequently added to a solar fluid to analyze heating ability. The solar fluids with the differently sized hybrid polydopamine particles are compared to a solar fluid containing food coloring (i.e., micrometer-sized soot particles, similar to India Ink) and silver nanoparticles. The hybrid polydopamine nanoparticles are found to heat more efficiently than silver nanoparticles or food coloring, respectively. In addition, no hybrid polydopamine nanoparticle deposits are found in the direct absorption solar collector in comparison to the solar fluids doped with silver nanoparticles or food coloring. Thus, this work shows that hybrid polydopamine nanoparticles are promising candidates to increase the efficiency of solar fluids.
Dr. D. Hauser, L. Steinmetz, Dr. S. Balog, Dr. P. Taladriz-Blanco, Dr. D. Septiadi, Dr. B. D. Wilts, Prof. A. Petri-Fink,
Prof. B. Rothen-Rutishauser Adolphe Merkle Institute University of Fribourg
Chemin des Verdiers 4, 1700 Fribourg, Switzerland E-mail: [email protected]
The ORCID identification number(s) for the author(s) of this article can be found under https://doi.org/10.1002/adsu.201900101.
With regard to the limitations of nonrenewable energy sources, considerable effort is made toward exploitation of sustainable energy sources.[1] Among others, sunlight is converted into
elec-trical energy (i.e., photovoltaics) or heat, which can be used to heat water (i.e., solar thermal systems) with the latter being the most prevalent.[2] Most commonly, the energy of the sunlight
is captured by a black absorber surface, from where the heat is transferred into a fluid running through the panel, the so-called solar or working fluid.[3] This system is not only limited by the
efficacy of the absorbing panel, but also by the efficiency of the heat transfer from the panels to the solar fluid.[3] To circumvent
the energy loss by incomplete heat transfer, the direct absorp-tion solar collector (DASC) approach, where the absorpabsorp-tion takes place directly in the solar fluid, was proposed.[4] To increase
the solar fluid’s efficiency in a first attempt, the fluid was mixed with black pigments such as India Ink, a suspension of
© 2019 The Authors. Published by WILEY-VCH Verlag GmbH & Co. KGaA, Weinheim. This is an open access article under the terms of the Creative Commons Attribution License, which permits use, distribution and repro-duction in any medium, provided the original work is properly cited. The copyright line for this article was changed on December 13th 2019 after original online publication.
absorption spectra of the PDA/BSA NPs reveal the light absorp-tion to be strongest in the UV wavelength range, but without a defined peak (Figure S1, Supporting Information). The food coloring, which was employed as control due to its similarity to India Ink (i.e., micrometer-sized soot particles), exhibited a more evenly spread spectrum without clear trend. Additionally, Ag NPs with a diameter of 39 nm were produced as they were used in previous publications for solar fluid doping (Figure 1).[10]
These Ag NPs showed a distinct peak of absorbance at 414 nm (Figure S1, Supporting Information). The heating ability of dif-ferent solar fluid compositions were then assessed using lock-in thermography (LIT).[13] To this end samples were excited with a
homogeneous light source at a wavelength of 400 nm and upon light absorption the dissipated heat was recorded by an infrared camera as amplitude image. Because temperature differences in the µK range can be resolved, LIT provides detailed information on the efficiency of a material’s light-to-heat conversion. In a first set of experiments, different compositions of solar fluids were assessed. In order to increase the efficiency, solar thermal col-lectors use solar fluids which consist partly of glycol. For these experiments, the glycol part of the solar fluid was varied between 0% and 95% with a bPDA/BSA portion of 5%. The bPDA/ BSA NPs were used as a representative for PDA/BSA NPs in general. Above 80% glycol there was no significant increase in heating ability anymore (Figure S2A, Supporting Information) and therefore, a mixture containing 80% glycol was used for fur-ther testing. The impact of the percentage of bPDA/BSA NPs in the solar fluid was also investigated by varying the bPDA/BSA concentration in the suspension (Figure S2B, Supporting Infor-mation). A linear increase of the amplitude signal was observed. The heat dissipation upon light stimulation of bPDA/BSA, mPDA/BSA, sPDA/BSA, Ag NPs, and food coloring (i.e., nega-tive control) was then also characterized by LIT. ≈1 mg mL−1
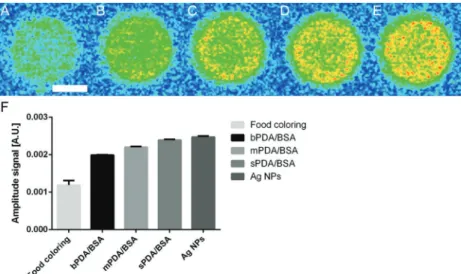
of the PDA/BSA and Ag NPs were used while the food color-ings’ absorbance was matched at 400 nm because the concen-tration could not be determined due to it being a commercial product. Figure 2 shows the comparison between the samples. An increase of amplitude signal can be appreciated from food coloring (Figure 2A) over bPDA/BSA (Figure 2B), mPDA/BSA (Figure 2C), sPDA/BSA (Figure 2D) to Ag NPs (Figure 2E). As expected, the measured amplitude signal of the food coloring is significantly lower than what was obtained for all samples containing NPs. For the PDA/BSA NPs; a trend suggesting an increase in heat production efficiency with the decrease of size of the NPs can be observed. Suspensions of small NPs con-tain more NPs than suspensions concon-taining bigger NPs at the same mass. This results for a higher surface to volume ratio which, in turn, increases the interface between hot particles and the fluid for smaller NPs. A greater interface results in an increased heat transfer. This hypothesis, however, is limited to this study and is yet to be proven experimentally for the used material. Even though the sPDA/BSA NPs do not reach the same efficiency as the Ag NPs (i.e., they heat less at 400 nm), the difference is not dramatic and merits a continuation of the investigation of PDA/BSA NPs as a solar fluid dopant.
One major challenge of solar fluid doping is the degrada-tion or aggregadegrada-tion of the dopant in the fluid over time.[14]
Interestingly, the PDA/BSA NPs were found to be stable after UV irradiation with an energy equivalent to 6.5 years of sun-light reaching Switzerland as calculated from data obtained by the Swiss meteorological service (Figure S3, Supporting Information).[15] LIT measurements revealed the heating ability
to decrease slightly after the treatment (7.6%). After ≈4 weeks of UV irradiation the decrease was found to be similar to the one after 36 h (6.8%). Furthermore, the size of the particles did not significantly decrease as measured by DLS (Figure S3,
Figure 1. A) Photograph of an aqueous suspension containing bPDA/BSA NPs. B) Graphical representation of the different particles measured by DLS
at 90° and room temperature. SEM microscopy image of dried samples of C) bPDA/BSA NPs, D) mPDA/BSA NPs, and E) sPDA/BSA NPs. F) TEM microscopy image of Ag NPs. Scale bars: C–E) 5 µm, F) 100 nm; insets: 300% enlarged.
Supporting Information) while also the polydispersity remained comparable (0.3). Taken together, it can be concluded that the particles are stable under prolonged UV irradiation and thus optimal as a novel solar fluid dopant.
In order to test the heating ability efficacy of the doping of the solar fluid in a more relevant setting, a test flow circuit was assembled (Figure S4A,B, Supporting Information). This circuit consists of a pump, a reservoir, a built-in thermometer, a flow rate sensor and the 3D printed collector. The collector is exposed to the solar radiation through a solar simulator and the tem-perature is monitored by the built-in thermometer. For the first
proof-of-concept experiment, the bPDA/BSA NPs were simply introduced into the flow cir-cuit without optimization by addition of glycol (Figure 3A). This is expected to result in a lower DT (difference of temperature of the solar fluid after 30 min) as the heating ability is increased by the addition of glycol as shown before. The negative control, bPDA/BSA NPs without irradiation showed a DT of 0. The solar fluid alone exposed to sunlight exhib-ited a slight temperature increase of about 0.5 °C in 15 min but reached a plateau shortly after and a DT of 0.71 °C was measured after 30 min. When the solar fluid was doped with carbonaceous food coloring particles, the initial temperature increase was 0.5 °C in 6 min compared to the solar fluid alone. The maximally reached temperature after 30 min increased to 1.08 °C corresponding to an increase of 52%. The doping of the solar fluid with bPDA/BSA NPs increased the ini-tial heating of the fluid (0.6 °C in 5 min— increase of 17% compared to the food coloring) and the temper-ature increased to 1.26 °C—an increase of 0.18 °C or 17%, again in comparison to the food coloring (Figure 3A). This indicates the potential of the PDA/BSA NPs to be used as a heat converter in solar fluids. In subsequent experiments, smaller sizes of the PDA/BSA NPs were tested and the solar fluid was doped with 80% glycol as this exhibits the most efficient heating. To this mixture, sPDA/BSA or Ag NPs were added and their increase in temperature was measured and compared to previously tested samples (Figure 3B). In comparison to the base mixture (glycol/ water; 8:2) the Ag NP doped solar fluid showed an increased
Figure 2. Amplitude image of A) food coloring, B) bPDA/BSA NP suspension, C) mPDA/BSA
NP suspension, D) sPDA/BSA NP suspension, and E) Ag NP suspension. F) Amplitude signal of food coloring, bPDA/BSA, mPDA/BSA, sPDA/BSA, and Ag NPs in glycol. Scalebar: 5 mm
N = 5.
Figure 3. A) Change in temperature measured for the different fluids under irradiation: bPDA/BSA (black line), food coloring (green line), Tris-HCl
buffered water (red line), and bPDA/BSA without sun (blue line). B) Change in temperature measured for the most efficiently heating PDA/BSA NPs (i.e., sPDA/BSA; yellow line), Ag NPs (red line), and glycol/water mixture (black line). C) Calculated specific heating rate (a) of the three different sizes of PDA/BSA NPs. N for all experiments equals at least 3.
heating by 160% in the first 5 min (0.15 °C of base fluid against 0.4 °C of the Ag NP suspension). For the sPDA/BSA doped solar fluid, an increase of 0.57 °C was measured in the first 5 min. This corresponds to an increase of 42.5% compared to the Ag NP doped fluid and 280% compared to the base fluid. These results stand in contrast to the ones obtained by LIT, where the Ag NPs were found to heat significantly more than the sPDA/ BSA NPs. However, this effect can be attributed to the fact that for the LIT measurement a light source with a relatively narrow emission band around 400 nm was used, while the employed solar simulator simulates the emission spectrum of the sun where a substantial part of the energy is present in form of red and infrared light. The absorbance spectra of the different nano-particle suspensions were multiplied with the emission spec-trum of the solar simulator obtained from ABET technologies (Figures S1 and S5, Supporting Information). Subsequently, the resulting curves were analyzed for the area under the curve which yields a weighed value corresponding to the heating of the different NP dispersions. These values were calculated to be 151.0 for bPDA/BSA, 104.7 for mPDA/BSA, 115.3 for sPDA/ BSA, and 99.9 for Ag NPs. This supports the explanation for the discrepancy of the measured heating behavior between the LIT and the solar collector. The Ag NPs exhibit a pronounced absorption peak around 414 nm, but very low absorbance at higher wavelengths. Even though the PDA/BSA NPs’ absorption steadily deteriorates from their maximum at low wavelengths, PDA/BSA NPs still exhibit a higher absorption at higher wave-lengths than the Ag NPs. Because LIT is measured at only one wavelength (i.e., 400 nm), this effect does not have an influence on the measured heating properties; since the absorption at 400 nm is similar. The solar simulator, however, simulates the solar spectrum—whose energy content is located to a consider-able extent in the red part of the spectrum (i.e., longer wave-lengths). Consequently, the PDA/BSA NPs—despite turning light of 400 nm wavelength less efficiently into heat—are more efficient to transform sunlight into thermal energy than the Ag NPs. To highlight the potential of the PDA/BSA NPs and for a more thorough characterization of the employed system, the processes were mathematically modeled. The sample tempera-ture as a function of time is influenced by two processes: a) the generation of heat by the absorption of light and b) the loss of heat owing to the imperfect insulation of the system from its environment. Given the small temperature difference between the system and its environment, the loss of heat is described by the Fourier law. To set up the mathematical model, three assumptions were made: i) The temperature of the environment is constant during a measurement, ii) the parameter describing heat absorption (a) is constant during a measurement and c) the parameter describing heat loss (k) is constant during an experi-ment. Accordingly, the solution of the differential equation
y t
t a k y t y
d
d
(
0)
( )
= −( )
− (1)with the initial condition of y (0) = y0 was used to fit against the
experimental data. The solution of this equation is as follows
y t a k y kt 1 e 0
(
)
( )
= − − + (2)Therefore, each curve was fitted with three unconstrained and adjustable parameters: a, k, and y0. The parameter
a [°C s−1] describes the rate of temperature increase owing to
light absorption and k [s−1] describes the heat loss owing to
imperfect insulation. The previously gained knowledge was now employed and solarfluids containing 80% glycol with dif-ferent particle sizes (bPDA/BSA, mPDA/BSA and sPDA/BSA) and types (Ag NPs) as well as the negative control (water/glycol) were measured (Figure 3B and Figure S6, Supporting Informa-tion). The Ag NPs were included as a reference point for this experiment since they have previously been successfully used as a solar fluid dopant.[10] Also, the concentration of NPs in the
solar fluid was decreased by 50% for another set of repetitions in order to gain more stable calculations for the heating rate (Figure S6, Supporting Information).
The data from these measurements was then used to cal-culate and compare the heating rates: For the bPDA/BSA NPs the measured heating rate was 2.3 °C s−1 L g−1, for the
medium sized mPDA/BSA NPs the measured heating rate was 1.31 °C s−1 L g−1 and for the smallest NPs (sPDA/BSA)
the measured heating rate was 2.77 °C s−1 L g−1 (Figure 3E).
The heating rate for the mPDA/BSA NPs was lower than for the other two NP sizes. This is probably attributed to the rel-atively big error in the calculations for the mPDA/BSA and not an actual difference. Finally, a trend was visible for the smaller sized sPDA/BSA NPs which revealed a slightly higher heating rate than the mPDA/BSA and bPDA/BSA NPs. The reference Ag NPs exhibited a heating rate of 6.0 × 10⁻⁴ °C s−1 while the
most efficiently heating sPDA/BSA NPs, at the same concentra-tion, were found to have a heating rate of 8.8 × 10⁻⁴ °C s−1—an
increase of 47%.
To conclude there are several challenges for nanoparticle-doped solar fluids, such as the high production costs, instability and agglomeration of particles which can result in a pressure drop or even complete clogging of the tubing’s, or the erosion and corrosion of components. These challenges can be over-come by using PDA NPs, as the production costs are relatively low because the main components—BSA and dopamine—can easily be obtained on a large scale.[16] In addition, PDA is
bioin-spired (present in the environment) and biocompatible also at high concentrations.[17] It thus is very unlikely for PDA to pose
any threat to the environment upon accidental spillage and it can be considered a sustainable approach to improve the pro-duction of renewable energy. Another advantage is that the NPs were stable, minimizing the risk of efficiency loss or agglom-eration. Moreover, no depositions in the tubing’s were found from the solar fluids doped with PDA, in contrary to the ones doped with the food coloring or the Ag NPs (Figure S7, Sup-porting Information). The data presented herein indicate the PDA/BSA system to be a powerful platform for the doping of solar fluids as it increases the efficiency considerably while overcoming major challenges in the field.[18]
Experimental Section
PDA Nanoparticle Synthesis and Characterization: Nanoparticles were
synthesized according to previously published protocol by Bergtold et al. Briefly, dopamine [Sigma-Aldrich, H8502, Buchs, Switzerland] was polymerized under oxidative conditions and in the presence of
the protein BSA [Sigma-Aldrich, A7030] for 24 h and subsequently characterized by the home built lock-in thermography system, dynamic light scattering [Brookhaven 90Plus Particle Size Analyzer, Brookhaven, Holtsville, USA] and UV–vis [Jasco V-670, Schlieren, Switzerland]. The UV–vis spectra were calibrated to the absorbance at 400 nm: All the tested NP dispersions were diluted to exhibit similar absorbance at 400 due to the LIT data being recorded with this wavelength. The scanning electron data was obtained by dropcasting the NP suspension and sputtercoating the sample with 4 nm of gold before image acquisition with a Tescan Mira3 LM FE [Tescan, Brno, Czech Republic] scanning electron microscope.
Ag Nanoparticle Synthesis and Characterization: 39 nm silver (Ag) NPs
were prepared by combining the methods described by Rainville et al.[19] and Bastus et al.[20] First, 400 mL of an AgNO
3 (1.32 × 10⁻³m) [Sigma-Aldrich, ACS reagent, ≥99.0%] aqueous solution was placed in a two-neck round flask provided with a reflux system and heat at 60 °C for 5 min. Second, 100 mL of a mixture containing tannic acid (1.47 × 10⁻³m) [Sigma-Aldrich, ACS reagent] and sodium citrate (12.2 × 10⁻³m) [Sigma-Aldrich, ≥98.0%] was heated to 60 °C in the oven for 5 min and injected into the silver solution under vigorous magnetic stirring. Then, the final mixture was refluxed for 20 min. After cooling down the solution to room temperature, the excess of tannic acid and citrate was removed by centrifugation at 2500 rpm for 25 min. NPs were concentrated in Milli-Q water for further use. Hydrodynamic diameter of the NPs was determined with a Brookhaven 90Plus Particle Size Analyzer [Brookhaven 90Plus Particle Size Analyzer]. The effective surface charge of the particles was analyzed using phase amplitude light scattering [ZetaPALS, Brookhaven 90Plus] in water. The plasmon absorption spectrum of the particles was recorded with a Jasco V-670 spectrophotometer [Jasco V-670] using a 10 mm path length quartz suprasil cuvette [Hellma Analytics, Müllheim, Germany]. TEM characterization was carried out in an FEI Tecnai Spirit transmission electron microscope [FEI, Frankfurt, Germany] operating at 600 kV by drop casting 20 µL of the nanoparticle dispersions on a copper grid. Size of the particles was calculated using an automatized sizing analysis in ImageJ software.
Thermal Measurements via Lock-in Thermography: To perform
thermal measurements a previously described lock-in imaging setup was applied.[13] Nanoparticles and food coloring [Lebensmittelfarbe 4866920, TRAWOSA AG, St. Gallen, Switzerland] were both stimulated by a homogeneous light source at 150 mA and a wavelength of 400 nm. Trigger modulation frequency was set to 1 Hz and a total of 60 cycles was conducted for all measurements. An infrared camera [Onca-MWIR-InSb-320, XenICs, Loewen, Belgium] was mounted on a standard microscope stand [Leica Microsystems, Wetzlar, Germany] and acquisition of infrared images was performed with a frame rate of 200 Hz. By using light transparent polystyrene sample holders it was ensured that no light is scattered before interacting with the sample. Both samples were measured five times to calculate the average as well as the standard deviation.
Collector Production: After designing the collector in FreeCAD, it was
3D printed using a Formlabs Form 2 3D printer [Formlabs, Somerville, USA]. The lid, a silica glass for optimal UV permeability, Herasil [WISAG, Faellanden, Switzerland], was glued onto the 3D printed collector by a two component glue [Coop, Basel, Switzerland]. After a 24 h drying period the collector could be deployed into the system.
Long-Term Stability Experiments: First, the UV lamp was characterized
utilizing a power meter [Avantes Avaspec-ULS2048, Apeldoorn, The Netherlands]. Subsequently, the inlet and outlet of the collector were sealed with septa, allowing for periodical sample removal. The sealed collector was then exposed to the UV lamp [Fisher Scientific, Reinach, Switzerland] and every 2 h, a sample of 500 µL was removed with a syringe. The samples were stored and subsequently measured with LIT) and DLS. The UV light intensity emitted by the lamp used for the experiment was measured to be at 1113 mW cm−2, thus 2 h of exposure to the light of the lamp correspond to ≈1 week of energy reaching Switzerland averaged throughout the year 2018.[15]
Flow Circuit: A computer controlled pump “aquastream ULTIMATE”
[Aqua Computer GmbH, Gleichen, Germany] was connected with
the collector. A flow rate sensor [Aqua Computer GmbH, Gleichen, Germany], a thermometer [Aqua Computer GmbH, Gleichen, Germany], and a fluid reservoir [Aqua Computer GmbH, Gleichen, Germany] were also integrated into the circuit.
Flow Experiments: The circuit was brought to operating temperature by
switching it on and setting it to a flow rate of 40 L min−1. The operating temperature was defined by no change in delta T for one measured increment of 1 min. Once this temperature was reached, the solar simulator [Sun 3000 Solar Simulator, ABET Technologies, Milford, USA] was switched on and the change in temperature was recorded for 30 min with temporal increments of 1 min.
Supporting Information
Supporting Information is available from the Wiley Online Library or from the author.
Acknowledgements
This study was supported by the Swiss National Science Foundation through the National Center of Competence in Research Bio-Inspired Materials and the Adolphe Merkle Foundation. The authors would like to thank Dr. Christoph Geers from Nanolockin for the lock-in thermography measurements, Dr. Miguel Spuch-Calvar for the illustrations, and Prof. Ullrich Steiner for fruitful discussions.
Conflict of Interest
The authors declare no conflict of interest.
Keywords
bioinspired, nanofluid, polydopamine, solar thermal energy
Received: September 13, 2019 Revised: November 26, 2019 Published online: December 11, 2019
[1] N. L. Panwar, S. C. Kaushik, S. Kothari, Renewable Sustainable
Energy Rev. 2011, 15, 1513.
[2] O. Mahian, A. Kianifar, S. A. Kalogirou, I. Pop, S. Wongwises,
Int. J. Heat Mass Transfer 2013, 57, 582.
[3] Y. Tian, C. Y. Zhao, Appl. Energy 2013, 104, 538. [4] J. E. Minardi, H. N. Chuang, Sol. Energy 1975, 17, 179.
[5] W. G. Houf, F. P. Incropera, W. Lafayette, Sol. Energy 1980, 25, 549.
[6] G. L. Liu, J. Kim, Y. U. Lu, L. P. Lee, Nat. Mater. 2006, 5, 27. [7] R. A. Taylor, P. E. Phelan, T. P. Otanicar, C. A. Walker, M. Nguyen,
S. Trimble, R. Prasher, J. Renewable Sustainable Energy 2011, 3, 023104.
[8] Y. Li, H. Xie, W. Yu, J. Li, Mater. Sci. Forum 2011, 694, 33.
[9] a) E. Sani, L. Mercatelli, S. Barison, C. Pagura, F. Agresti, L. Colla, P. Sansoni, Sol. Energy Mater. Sol. Cells 2011, 95, 2994; b) L. Mercatelli, E. Sani, G. Zaccanti, F. Martelli, P. Di Ninni, S. Barison, C. Pagura, F. Agresti, D. Jafrancesco, Nanoscale
Res. Lett. 2011, 6, 282; c) T. Yousefi, F. Veisy, E. Shojaeizadeh,
S. Zinadini, Exp. Therm. Fluid Sci. 2012, 39, 207.
[10] T. P. Otanicar, P. E. Phelan, R. S. Prasher, G. Rosengarten, R. A. Taylor, J. Renewable Sustainable Energy 2010, 2033102.
[11] SOLARAIR UK, Servicing, http://www.solarairuk.com/servicing (accessed: November 2019).
[12] a) D. Hauser, M. Estermann, A. Milosevic, L. Steinmetz, B. Rothen-rutishauser, Nanomaterials 2018, 8, 1065; b) C. Bergtold, D. Hauser, A. Chaumont, S. El Yakhlifi, M. Mateescu, F. Meyer, M. H. Metz-Boutigue, B. Frisch, P. Schaaf, D. Ihiawakrim, O. Ersen, C. A. Monnier, A. Petri-Fink, B. Rothen-Rutishauser, V. Ball,
Biomacromolecules 2018, 19, 3693.
[13] a) S. Huth, O. Breitenstein, Solid State Phenom. 2002, 741, 82; b) O. Breitenstein, C. Schmidt, F. Altmann, D. Karg, in
Microelec-tronics Failure Analysis, 6th ed. (Ed: R. J. Ross), ASM International,
Materials Park, OH 2011, p. 330; c) L. Steinmetz, P. Taladriz-Blanco, C. Geers, M. Spuch-Calvar, M. Bonmarin, S. Balog, B. Rothen-Rutishauser, A. Petri-Fink, Part. Part. Syst. Charact. 2019,
36, 1900224.
[14] J. Qu, R. Zhang, Z. Wang, Q. Wang, Appl. Therm. Eng. 2019, 147, 390.
[15] MeteoSchweiz, Monats- und Jahresgitterkarten (Global Radia-tion 2018), https://www.meteoschweiz.admin.ch/home/klima/ schweizer-klima-im-detail/monats-und-jahresgitterkarten. html?filters=rad_mean_2018_yy_2018 (accessed: August 2019). [16] a) J. H. Ryu, P. B. Messersmith, H. Lee, ACS Appl. Mater. Interfaces
2018, 10, 7523; b) B. D. Holt, K. N. Dahl, M. F. Islam, Small 2011, 7, 2348.
[17] a) Y. Liu, K. Ai, L. Lu, Chem. Rev. 2014, 114, 5057; b) S. H. Ku, J. Ryu, S. K. Hong, H. Lee, C. B. Park, Biomaterials 2010, 31, 2535.
[18] R. Taylor, S. Coulombe, T. Otanicar, P. Phelan, A. Gunawan, W. Lv, G. Rosengarten, R. Prasher, H. Tyagi, J. Appl. Phys. 2013, 113, 011301.
[19] L. Rainville, M.-C. Dorais, D. Boudreau, RSC Adv. 2013, 3, 13953.
[20] N. G. Bastús, F. Merkoçi, J. Piella, V. Puntes, Chem. Mater. 2014,