Supplemental Information
PackMem: A Versatile Tool to Compute and Visualize Interfacial
Pack-ing Defects in Lipid Bilayers
Romain Gautier, Amélie Bacle, Marion L. Tiberti, Patrick F. Fuchs, Stefano Vanni, and Bruno Antonny
Supporting Material
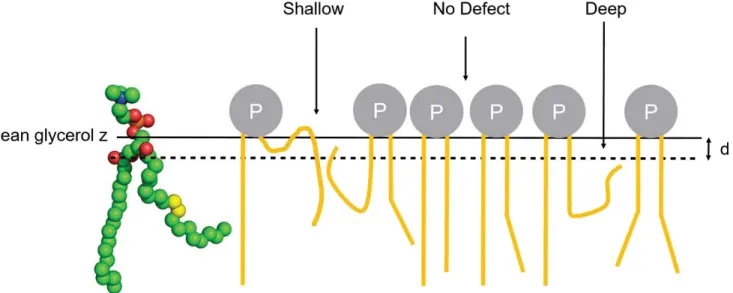
FIGURE S1: Schematic representation of lipid-packing defects. The gray spheres represent the polar
head of lipids and the orange sticks represent the aliphatic acyl chains. Deep defects: grid cells corresponding to voids where aliphatic atoms are deeper than d Å below the central atom of glycerol and are vertically accessible from the outside. Shallow defects: grid cells where aliphatic atoms are less than d Å below the central atom of glycerol and are vertically accessible from the outside. The figure also shows the structure of a POPC lipid. The double bond in the monounsaturated acyl chain is shown in yellow.
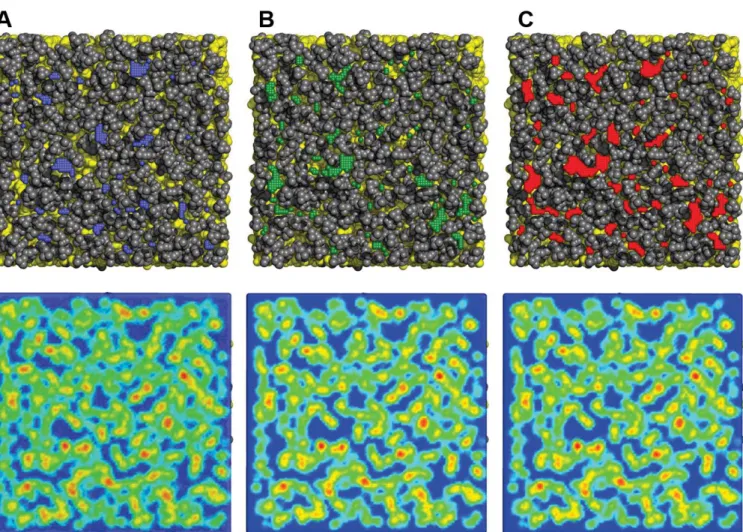
FIGURE S2: Example of packing defect mapping for a POPC bilayer. The top panels show the position
of deep (A; blue), shallow (B; green) and ‘all’ (C; red) packing defects. Aliphatic atoms are colored in yellow and all other lipid atoms are in gray. The bottom panels show the matrix M for each type of packing defects with a color gradient: cold color (blue) for value n=0 to warm color (red).
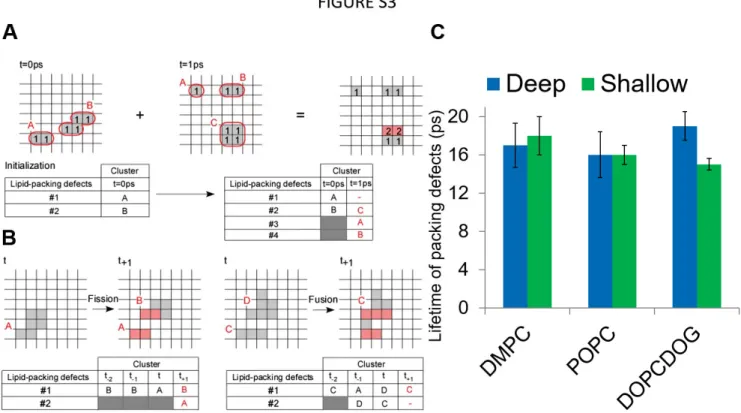
FIGURE S3: Lifetime of lipid-packing defects. (A) Spatial distribution of the lipid packing defects on a
grid at two consecutive time frame. Values 1 indicate elementary lipid-packing defects whereas A, B and C are the ID of the actual lipid packing defects (clusters of elementary defects). The sum of the two matrices (value = 2) allows us to identify the lipid-packing defects that persist in time and to build a table of the lifetime of the lipid packing defects. In this example, the lipid packing defect C at time 1 ps is the same as the lipid packing defect B at time 0 ps.
(B) Management of fission and fusion events of lipid-packing defects during the trajectory. For fission, the largest defect resulting from fission continues to be followed; the smaller one is considered as a new defect. For fusion, the resulting defect is associated to the defect that had the longest lifetime before fusion; the other one is considered as vanished.
(C) Lifetime of packing defects in picoseconds (ps) for different bilayers (DMPC, POPC and DOPC/DOG) for deep and shallow packing defects (blue and green respectively). The lifetime has been calculated from 50 ns MD simulations by following defects with an area > 15A² and with a sampling frequency of one frame/ps.
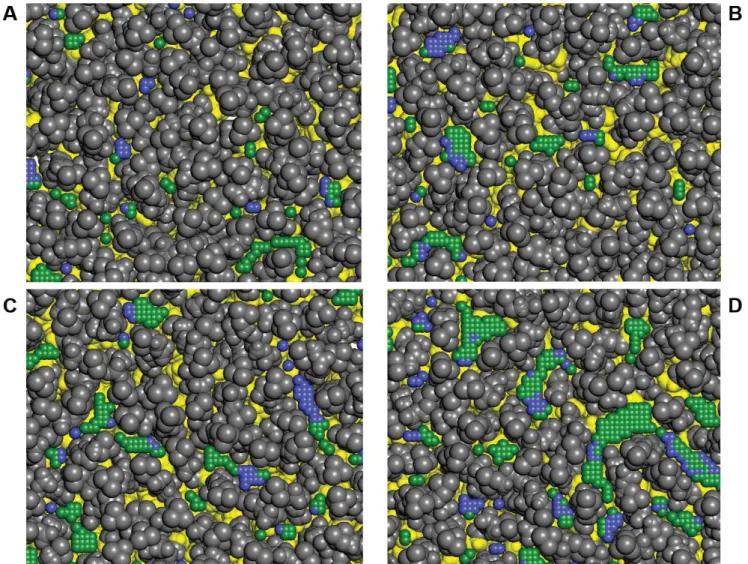
FIGURE S4: Examples of packing defects in DMPC (A), POPC (B), DOPC (C) and DOPC/DOG (D)
bilayer simulations. Deep and shallow lipid-packing defects are shown in blue and green, respectively. Aliphatic atoms are colored in yellow and all other lipid atoms are in gray. Note the gradual increase in the surface area of the defects from A to D.