HAL Id: hal-02733800
https://hal.inrae.fr/hal-02733800
Submitted on 2 Jun 2020
HAL is a multi-disciplinary open access
archive for the deposit and dissemination of sci-entific research documents, whether they are pub-lished or not. The documents may come from
L’archive ouverte pluridisciplinaire HAL, est destinée au dépôt et à la diffusion de documents scientifiques de niveau recherche, publiés ou non, émanant des établissements d’enseignement et de
Are EU subsidies a springboard to the reduction of
pesticide use?
Magali Aubert, Geoffroy Enjolras
To cite this version:
Magali Aubert, Geoffroy Enjolras. Are EU subsidies a springboard to the reduction of pesticide use?. 11. Journées de Recherches en Sciences Sociales (JRSS), Société Française d’Economie Rurale (SFER). Paris, FRA.; Centre de Coopération Internationale en Recherche Agronomique pour le Développement (CIRAD). FRA.; Institut Supérieur d’Agriculture et d’Agroalimentaire Rhône-Alpes (ISARA Lyon). FRA.; Laboratoire d’Etudes Rurales (LER). FRA.; Institut National de la Recherche Agronomique (INRA). FRA., Dec 2017, Lyon, France. 18 p. �hal-02733800�
Version postprint
Are EU subsidies a springboard to
the reduction of pesticide use?
Magali Aubert *, Geoffroy Enjolras **
* UMR 1110 MOISA, INRA-Montpellier Supagro 2 place Viala, 34060 Montpellier Cedex 2, France
** FRE 3748 CERAG, Univ. Grenoble Alpes, IAE Domaine universitaire, B.P. 47, 38040 Grenoble Cedex 9, France
Tel. +33 (0)4 76 82 81 02 Fax. + 33 (0)4 76 82 59 99 Corresponding author: [email protected]
11èmes Journées de recherches en sciences sociales (JRSS)
Lyon – 14 et 15 décembre 2017
Version postprint
Are EU subsidies a springboard to
the reduction of pesticide use?
Abstract
Many farms are changing their productive practices, by developing more environmentally-friendly practices in order to meet phytosanitary requirements of both private actors and public authorities. This article analyses the essential contribution of EU subsidies to the reduction of pesticide use. We use the FADN database, from 2000 to 2015, for its accuracy to measure pesticide use and to relate it to public subsidies received by farmers. The influence of EU subsidies on pesticide use is measured through a panel-data econometric model. In addition to individual, structural and financial factors which usually explain the implementation of environmental-friendly practices, our study emphasizes the role of EU subsidies. The results show that payments from the 1st Pillar increase pesticide use while
payments from the 2nd Pillar lead to a decreasing intensity of phytosanitary expenses. Other key individual, structural and financial factors at the farm scale also have contrasted effects on pesticide use. The efficiency of public policies towards the issue of environmentally-friendly practices is therefore questioned.
Keywords: Pesticides, EU subsidies, FADN, France.
1. Introduction
Implementation of environmentally-friendly practices has been more and more popular over the last decades, mainly because of recent sanitary crises. These practices can take several forms including the reduction of applications and quantities of phytosanitary products as well as the implementation of integrated pest management techniques (Fernandez-Cornejo, 1996). An illustration of this growing trend is the extension of organic farming in Europe and widely in the World (Eurostat, 2017; FIBL and IFOAM, 2017).
Reducing pesticides is a challenge for a more sustainable agriculture addressed to all stakeholders, from producers to consumers. Existing studies have proven that the process underlying the implementation of more environmentally-friendly practices requires the combination of several factors such as the implementation of new production and marketing patterns and a continuous education of farm holders. The existence of taxes and incentives
Version postprint
The European Union has long been developing support policies for green agriculture. The Common Agricultural Policy is based on the concept of “multifunctionality”, which considers according to the World Trade Organization, that “agriculture has many functions in addition
to producing food and fibre, e.g. environmental protection, landscape preservation, rural employment, food security”. More specifically, organic farming is regulated by the Council
Regulation (EC) No 834/2007 on organic production and labelling of organic products, complemented by Commission Regulation (EC) No. 889/2008 with detailed rules for production, labelling and control. The CAP strategic framework for 2014-2020 reinforced the greening of EU agricultural policy (Westhoek et al., 2014).
In practice, the Concept of Common Agricultural Policy (CAP) is based on two pillars. The 1st Pillar includes direct payments which help farmers to stabilize their revenue, and market measures which tackle specific market situations. The 2nd Pillar concerns rural development policy and it includes measures for promoting environmentally-friendly practices. Within this framework, farmers receive subsidies providing they comply with rules related to the main public expectations on environment, public and animal health and welfare.
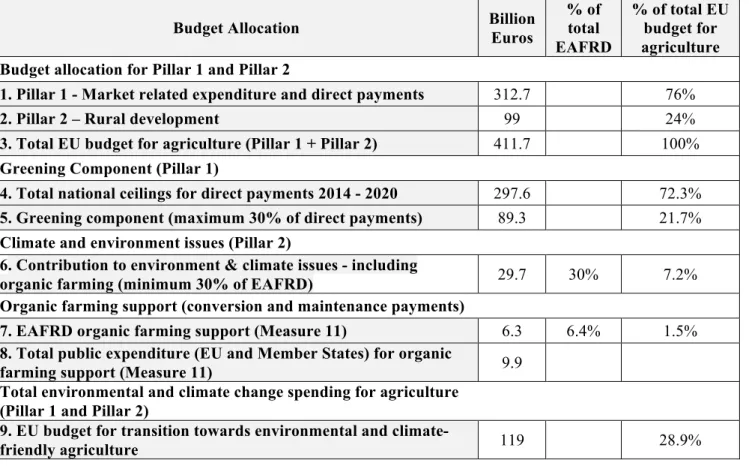
Within the CAP 2014-2020 framework, green practices are strongly encouraged with specific budget guidelines. Part of them are targeted to the development of organic farming but the range of possible actions includes in fact all types actions leading to more environmentally-friendly practices. In total, about 28.9% of the total EU budget for agriculture is focused on measures directly linked to environmental and climate issues (Table 1).
Table 1. Key EU budget allocations for transitioning towards environmental and climate friendly practices and organic farming under the CAP 2014–2020
While the previous table quantifies the efforts made in favour of green practices, it also describes a complex multi-layered structure of subsidies. The OECD (2017) annual report points out that most traditional agricultural support policies remains targeted towards production rather than quality, which may impede progress of environmentally-friendly practices.
The aim of this research is to examine in detail the influence of financial incentives on the implementation of environmentally-friendly practices. In order to complement the existing literature on these practices, the contribution provided by this paper is threefold. First, we propose an innovative analysis which considers the relationship between EU subsidies and pesticide use. Second, this analysis takes specific account of a set of individual, structural, economic and financial parameters as determinants of production choices. Third, we use data from the French Farm Accountancy Data Network for the period 2010-2015 because they provide a representative overview of professional French farms, particularly in terms of productive orientation. Our study considers more precisely the French case. This country is relevant case study since pesticide use is among the highest in Europe (Butault et al., 2012). In such a context, following the implementation of EcoPhyto I (2008) and Ecophyto II (2015)
Version postprint
frameworks, objectives were defined to reduce the intensity of pesticide use in the French agriculture.
This article is structured as follows. In the first section, we develop the theoretical framework. In the second section, we present the empirical strategy. In the third section, we develop the results using descriptive statistics and econometric models. In the fourth section, we conclude and provide some perspectives.
2. Theoretical framework
The theoretical framework relies on the growing literature based on environmentally-friendly practices and organic farming. Starting for the analysis of the papers, we set up research hypotheses that will be tested using an empirical framework.
2.1 European subsidies
European subsidies contribute to increase the total income of the farmers. While this financial support can help farmers to implement environmentally-friendly practices, almost all studies consider only their consequences on the economic potential of the farm (Rigby et al., 2001; Kallas et al., 2010). Few studies took into account the link between European subsidies and green practices (Fernandez-Cornejo et al., 1998; Stozle, 2016) while during the last decade more financial incentives have been implemented. Because Europe has set up an active regulation which can influence pesticide use, our study focuses specifically on the impact of such subsidies on farmers’ behaviour.
Considering that the CAP is based on two pillars with different assigned objectives, one can assume that contrasted effects may be noticed. Subsidies from the 1st Pillar which are
designed to stabilize farmers’ revenue through direct payments may be more likely to incite farmers using pesticides. Pesticide use can indeed be considered as risk management tool aiming at stabilizing yields from a year to another and hence farmers’ income.
H1a European subsidies from the 1st Pillar lead to an increase in pesticide use.
Subsidies from the 2nd Pillar, which comprises rural development policies seems to be better adapted to pesticides reduction. These subsidies incorporate mainly compensation for losses caused by adverse weather conditions and agrienvironmental subsidies. Such supports foster the implementation of more environmentally-friendly practices and hence may discourage pesticide applications.
Version postprint
2.2 Structural characteristics
Padel (2001) and Kallas et al. (2010) emphasize that small farms are more willing to adopt organic farming. Aubert and Enjolras (2017) also show that larger farms may also be interested by this kind of farming because of a sufficient economic dimension.
H2a. Pesticide use increases with the size of the farm
According to Dinis et al. (2015) and Aubert and Enjolras (2017), farms reducing pesticide use are less diversified. The rationale lies in the production and certification constraints when adopting alternative production processes. However, Padel (2001), Hanson et al. (2004) and Kallas et al. (2010) find an opposite situation: farms which apply less pesticides may diversify their activities in order to mitigate the consequences of potential yield losses.
H2b. Pesticide use increase with the diversification of farm produces
Workforce has been continuously acknowledged as a key factor leading to the adoption of environmentally-friendly practices (Jansen, 2000; Padel, 2001; Aubert and Enjolras, 2017). An increase in working hours is needed because of additional activities, such as monitoring, required by a drop in pesticide applications (Karali et al., 2014).
H2c. Pesticide use decreases when workforce increases
Karali et al. (2014) show that available family workforce is one of the cheapest substitute to pesticides use. Dinis et al. (2015) and Kallas et al. (2010) also prove that family farming is deeper organic because of a smaller need of material investments when this type of workforce is available. Aubert and Enjolras (2017) demonstrate that, for small farms, family work is essential is the adoption of environmentally-friendly practices.
H2d. Pesticide use decreases when family work increases 2.3 Individual characteristics
Padel (2001), Sylvander and Schieb-Bienfait (2006), Kallas et al. (2010) and Aubert and Enjolras (2017) show that the most the farm holder is educated and the most he is involved in environmentally-friendly practices.
H3a. A higher level of education for the farm holder decreases pesticide use
Sylvander and Schieb-Bienfait (2006) emphasize the need for the holder to be fully involved in his farming activity when adopting organic farming.
Version postprint
2.4 Financial characteristics
Offermann and Nieber (2000), as well as Koesling et al. (2008), indicate that farms converting to organic farming may be motivated by the perspective of a higher profitability.
H4a. Profitable farms increase their pesticide use
Galt (2008) highlights the fact that indebtedness has a positive impact on the consumption of pesticides used per hectare while Sharma et al. (2011) showed this effect is not significant. Farmers may prioritize expenses such as pesticides because their application can insure yields.
H4b. Indebtedness leads to an increase in pesticide use 2.5 Control variables
Because of their specificities, mainly in terms of sensibility to pests and diseases, some specializations are more likely to use pesticides. As a matter of fact, while farms specializing on field crops used 134€ per hectare of pesticides in 2006, farms specializing on wine growing used 394€ per hectare (Butault et al., 2010).
H5a. The technical and economic specialization influences pesticide use
The location of the farm is also an important factor which reflects the environment in which farmers evolve. Since our study aims at appreciating the importance of European support on pesticide use, location can be considered through a location in less-favoured areas characterized by a lower density, a higher degree of isolation and more complex farming activities. We assume that to be located in a less-favoured area decreases the use of pesticide since farmers are encouraged to implement environmentally-friendly practices in order to preserve these areas (Rudow, 2014).
H5b. A location in a less-favoured area decreases pesticide use
Whatever the location and the specialization, we are witnessing a fast evolution of phytosanitary requirements for all farms imposed by private actors, public authorities and consumers (Lefebvre et al. 2014; Böcker and Finger, 2016). Hence, we assume that pesticide use decreases over time.
H5c. Pesticide use decreases over time
Version postprint
3. Empirical framework
In this section, we present first the database used and second the econometric model implemented to understand to what extend farmers’ behaviour towards pesticide use is conditioned not only by individual, structural and financial characteristics but also by the level of European support.
3.1 Database
In order to understand farmers’ practices in terms of pesticides used, our study is based on the European Farm Accountancy Data Network (FADN) for the period 2000-2015. These data are both the most precise available at the individual level and the most complete and recent that we have. This database offers a reliable way to access structural and financial characteristics of professional farms. Professional farms correspond to farms whose standard output is superior to 25.000€.
Because of the sampling methodology, farms belonging to the FADN-RICA do not correspond to perennial farms. From 2000 to 2015, whatever the economic and technical orientation (ETO) 106,384 farms are surveyed. We consider in our study all professional farms, regardless of their specializations. Market gardeners, wine growers, fruit producers as well as sheep breeders are therefore considered.
The database let us appreciate not only the individual characteristics of the farmer and the structural and financial characteristics of farms but also pesticides used. More precisely, the latter is measured in economic terms through the declared expenses. In order to neutralize size effects, expenses are reported to farm sales.
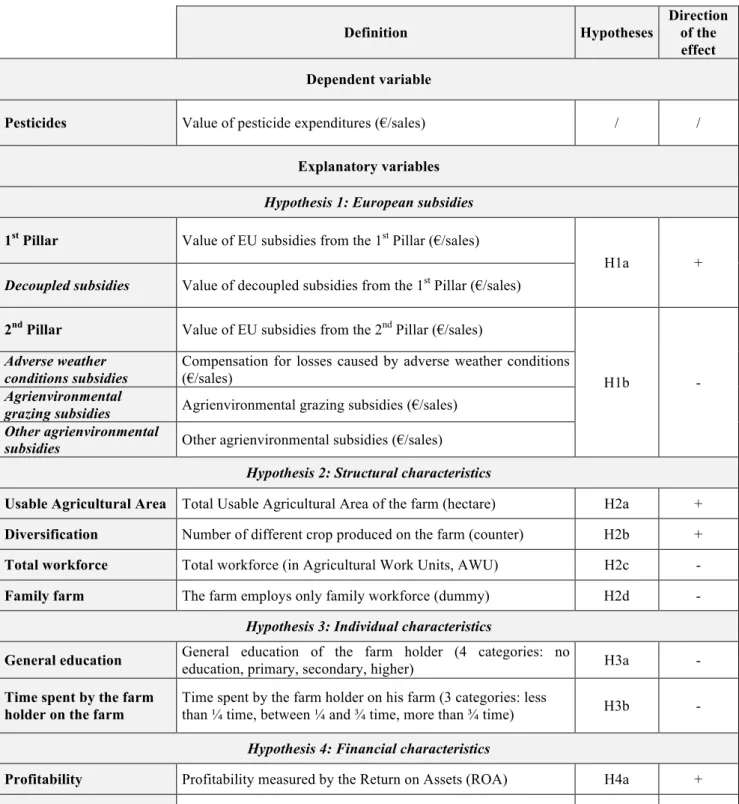
Table 2 summarizes the variables used for this analysis, the underlying hypotheses and the direction of the effects.
Table 2. List of variables used in the analysis 3.2 Econometric models
The aim of our study is to understand to what extend individual, structural and financial characteristics lead to an intensive use of pesticides and to what extent European support specifically drives farmers’ behaviour. To do so, an unbalanced panel is used from 2000 to 2015. Indeed, the renewal of farms in the sample, from one year to another, is random. This let us consider all farms present in the period and not only perennial ones. Hausman’s test (1978) lets us favouring a random effects model rather than a fixed effects model. Hence, we perform a panel with random effects in order to consider not only individual effects but also temporal ones. We also carried out heteroscedasticity and autocorrelation tests (Wooldridge, 2002).
Version postprint
In order to appreciate to what extent farmers implement environmentally-friendly practices, three main measures can be considered. The first one considers directly the quantity of pesticides used (Aubert and Enjolras, 2014). The second one is indirect through the adoption of integrated pest management technics (Aubert et al., 2013; Fernandez-Cornejo, 1996; Fernandez-Cornejo and Ferraioli, 1999; Galt, 2008; McNamara and Keith Douce, 1991). The third one takes into account the adoption of a certification such as the “organic farming” label (Aubert and Enjolras, 2016). In our case, the database provides information on the measure of amount of pesticide expenditures. To remedy a possible size effect, we have to divide this amount by the dimension of the farm, which can be either physical or economic. Since our study considers all specializations, the physical size cannot be taken into account. In fact, a farm specializing in wine growing will generate a standard output of 81,414€/hectare if located in Champagne-Ardennes and 4,134€/hectare if located in Lorraine. Hence, we consider pesticide expenditures over sales as an objective indicator.
The model explains the level of pesticide expenditures divided by sales and can be considered as follow:
𝑌"# = 𝛼 + 𝛽′𝐸𝑆"#+ 𝛾′𝑆𝐶 + 𝛿′𝐼𝐶"#+f′𝐹𝐼"#+ 𝜍′𝐸𝑇𝑂#+ 𝜑′𝑌𝑒𝑎𝑟" + 𝜀"#
Where:
Yit is the level of pesticide expenditures divided by sales
ESit is the matrix of European subsidies
SCit is the matrix of structural characteristics
ICit is the matrix of individual characteristics
FIit is the matrix of financial characteristics
ETOi is a control variable related to the economic and technical orientation of the farm
Yeart is a control variable related to the period
α is the constant,
β, γ, δ, f, 𝜍 and 𝜑 are (vectors of) parameters to be estimated εit is a random error term
4. Results
4.1 Descriptive statistics
From 2000 to 2015, we observe that the level of pesticide expenditures is quite stable although it varies according to the specialization (Figure 1). Farms specializing in field crops use more pesticides than farms specializing in fruit production and wine growing.
Version postprint
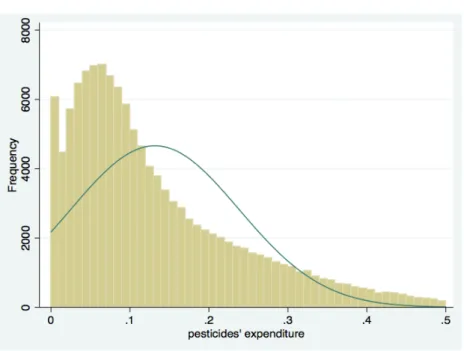
When we consider the distribution of pesticide expenditures, we observe a heterogeneity of farms according to their environmental practices (Figure 2). Half farmers (50.1%) exhibit a very low level of expenditures (lower than 10 %), while for a small minority (3%) phytosanitary expenditures represent more than 40 % of their sales.
Figure 2. Distribution of pesticide expenditures
More precisely, we observe that, on average, pesticide expenditures represent 12.9% of the farms’ sales (Table 3a). Compared to European subsidies, we can note that supports from the 1st Pillar represent 21.6% of sales and decoupled supports from this Pillar represent almost half of this support. We also notice that supports from the 2nd Pillar represent less than 5 % of farmers sales.
Table 3a. Relative importance of pesticide expenditures on sales
Farms located in less-favoured areas and specializing in field crops seem to implement the least environmentally-friendly practices (Table 3b). As a matter of fact, while pesticide expenditures represent 12.9% of sales at the national level, they represent respectively 14% and 27% for these farms.
Considering farmers’ characteristics, descriptive statistics indicate that farmers who are more educated and who work more than ¾ time on their farm implement more environmentally-friendly practices. These practices seem also to be linked to the type of employment. Farmers employing only family members present a lower level of pesticide expenditures than farms with waged workers.
Table 3b. Relative importance of pesticide expenditures on sales according to farms and farmers’ characteristics
4.2 Econometric models
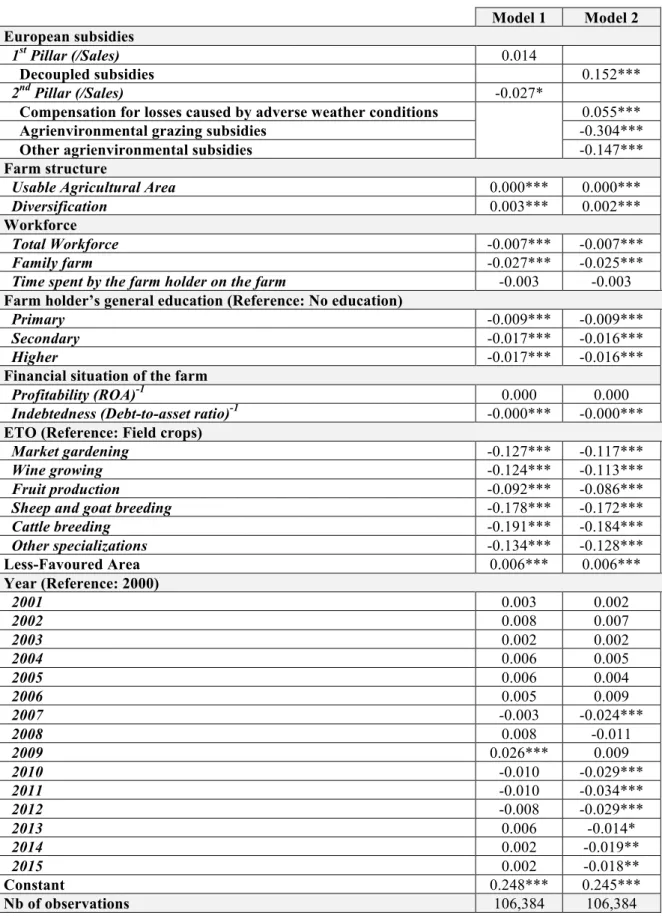
The econometric model let us appreciate the dynamics of pesticide expenditures considering both individual and temporal dimensions (Table 4).
Table 4. Econometric models
Results highlight the role of European support on farmers’ behaviour. Considering the 1st Pillar, the model underlines that this support has no influence when considered in an aggregated way but has a positive influence when only decoupled payments are considered (H1a validated). These subsidies appear to be a springboard to develop production. Considering the 2nd Pillar of the European support, the results demonstrate that, whatever the nature of the support, each kind of subsidy translates into a reduction of pesticide expenditures (H1b validated). Because these supports are targeted to improve the
Version postprint
environment, our results confirm the effective importance of such support to the implementation of environmentally-friendly practices.
Beyond the individual characteristics of farmers, the level of pesticide expenditures appears to be conditioned by structural characteristics. Farms who apply more pesticides are more likely larger (H2a validated) and more diversified (H2b validated). The results also highlight that farms on which there is more workforce are more likely to reduce their use of pesticides (H2c validated). This confirms the fact that pesticides and workforce are substitutes. To reduce the use of pesticides, farmers need to employ workforce for direct observation and treatments. Moreover, family farms are more likely to reduce pesticide use (H2d validated).
The results also highlight the importance of farmers’ characteristics. We confirm that farmers who are more educated are more likely to implement environmentally-friendly practices (H3a validated). This level of education has to be considered with the time spent on the farm by the holder since the implementation of such practices supposes a higher implication from the farmer, his family or waged workforce (H3b validated).
When we consider the financial situation of farms, the results underline that the level of profitability has no impact on pesticide expenditures (H4a not validated). Moreover, the results confirm that farmers who are more indebted apply less pesticides. This can translate the fact that these farmers may use environmentally-friendly practices as a way to reduce their indebtedness (H4b not validated).
The econometric model confirms the specificity of specialization (H5a validated) as well as the importance of the location. Farmers who are located in less-favoured areas are more likely to apply pesticides than farmers located in other areas. The reason may lie in the risk-decreasing effect of pesticides in these specific areas (H5b not validated). Annual effects are only significant in the second model. They tend to prove that pesticide use decreased after 2010, when public policies in favour of the environment and organic farming were reinforced (H5c partially validated).
5. Conclusion
In this article, we have analysed the influence of EU subsidies on pesticide use. This question is salient as an increasing number of farms are progressively converting their production towards environmentally-friendly practices in order to meet phytosanitary requirements. This study focused on French farms, by using data from the FADN for the period 2000-2015. This database appears well suited to provide precise information regarding the farms individual, structural and financial characteristics, including pesticide expenditures and the detail of EU subsidies.
Version postprint
Many factors drive positively pesticide use, such as farm size and location in less-favoured areas. Rationales for intensive pesticide use may be different according to the types of farms. While large farms are production-oriented, farms located in less-favoured areas use pesticides as a way to secure their yields. Conversely, family farming leads to a decrease in pesticide use. We also observe a year effect which indicates that pesticides expenses are being reduced overtime. The results also confirm that there exists sectorial difference, some sectors such as field crops being more pesticide-intensive, such as field crops.
The results show that EU subsidies have contrasted effect on environmental practices. While decoupled subsidies received by farmers from the 1st Pillar tend to increase pesticide use, payments from the 2nd Pillar have the opposite effects and act in favour of greener practices. The reason lies in the targets of each kind of subsidies: the 1st Pillar promotes production quantity while the 2nd Pillar rather fosters production quality. In these conditions, the progressive shift of subsidies observed from the 1st to the 2nd Pillar is likely to be favourable
to environmentally-friendly practices. Beyond these effects, the results highlight the dynamics in favour of a reduction of pesticide use.
These results emphasize the key role of EU subsidies, especially through the 2nd Pillar, in promoting green practices at the farm level. Incentives are nowadays mainly targeted on production practices on the fields. However, more specific actions could be performed in order to encourage the development of alternative practices. Moreover, the research would benefit from more detailed data on EU subsidies targeted on environmentally-friendly practices so as to assess their effectiveness.
Version postprint
6. References
Aubert, M. and Enjolras, G. (2017), “French labour-force participation in organic farming”,
Human Systems Management, 36(2): 163-172.
Böcker, T. and Finger, R. (2016), “European Pesticide Tax Schemes in Comparison: An Analysis of Experiences and Developments”, Sustainability, 8(4): 378.
Butault, J.P., Dedryver, C.A., Gary, C., Guichard, L., Jacquet, F., Meynard, J.M., Nicot, P., Pitrat, M., Reau, R., Sauphanor, B., Savini, I. and Volay, T. (2010), “Ecophyto R&D, quelles voies pour réduire l’usage des pesticides ». Paris: INRA.
Dinis, I., Ortolani, L., Bocci, R. and Brites, C. (2015), “Organic agriculture values and practices in Portugal and Italy”, Agricultural Systems, 136: 39-45.
Eurostat (2017), “Organic farming statistics”. Available on the internet from: http://ec.europa.eu/eurostat/statistics- explained/index.php/Organic farming statistics
Fernandez-Cornejo, J. (1996), “The microeconomic impact of IPM adoption: Theory and application”, Agricultural and Resources Economics Review, 25(2): 149-160.
Fernandez-Cornejo, J., Jans, S., and Smith, M. (1998), “Issues in the economics of pesticide use in agriculture: A review of the empirical evidence”, Review of Agricultural Economics, 20(2): 462–488.
FIBL and IFOAM (2017), “The World of Organic Agriculture. Statistics and Emerging Trends 2017”. Frick: Research Institute of Organic Agriculture.
Galt, R.E. (2008), “Toward an integrated understanding of pesticide use intensity in Costa Rican vegetable farming”, Human Ecology, 36(5): 655-677.
Hanson, J., Dismukes, R., Chambers, W., Greene, C. and Kremen, A. (2004), “Risk and risk management in organic agriculture: views of organic farmers”, Renewable Agriculture and
Food Systems, 19(14): 218-227.
Hausman, J.A. (1978), “Specification Tests in Econometrics”, Econometrica, 46(6): 1251-1271.
Jansen, K. (2000), “Labour: Livelihoods and the quality of life in organic agriculture in Europe”, Band, 17(3): 247–278.
Kallas, Z., Serra, T. and Gil, J. (2010), “Farmers’ objectives as determinants of organic farming adoption: The case of Catalonian vineyard production”, Agricultural Economics, 41(5): 409-423.
Karali, E., Brunner, B., Doherty, R., Hersperger, A.M. and Rounsevell, M.D.A. (2014), “Identifying the factors that influence farmer participation in environmental management practices in Switzerland”, Human Ecology, 42: 951–963.
Version postprint
Koesling, M., Flaten, O. and Lien, G. (2008), “Factors influencing the conversion to organic farming in Norway”, International Journal of Agricultural Resources, Governance and
Ecology, 7(1/2): 78-95.
Lefebvre M., Langrell S.R.H. and Gomez-y-Paloma S. (2014), “Incentives and policies for integrated pest management in Europe: A review”, Agronomic Sustainable Development, 35 (1): 27-45.
OECD (2017), “Agricultural Policy Monitoring and Evaluation 2017”, OECD Publishing, Paris.
Offermann, F. and Nieber, H. (2000), “Economic Performance of Organic Farms in Europe”.
Organic Farming in Europe: Economics and Policy, Vol. 5. Stuttgart: Universitat
Hohenheim.
Padel, S. (2001), “Conversion to organic farming: A typical example of the diffusion of an innovation?”, Sociologica Ruralis, 41(1): 42–61.
Rigby, D., Young, T. and Burton, M. (2001), “The development of and prospects for organic farming in the UK”, Food Policy, 26(6): 599-613.
Rudow, K. (2014), “Less favoured area payments: Impacts on the environment, a German perspective”, Agricultural Economics / Zemedelska Ekonomika, 60(6): 260-272.
Sharma, A., Bailey, A. and Fraser, I. (2011), “Technology adoption and pest control strategies among UK cereal farmers: Evidence from parametric and nonparametric count data models”,
Journal of Agricultural Economics, 62(1): 73-92.
Stolze, M., Sanders, J., Kasperczyk, N. and Madsen, G. (2016), “CAP 2014-2020: Organic farming and the prospects for stimulating public goods”, IFOAM EU, Brussels.
Sylvander, B. and Schieb-Bienfait, N. (2006), “The strategic turn of Organic Farming in Europe: From a resource based to an entrepreneurial approach of Organic Marketing Initiatives”. In: Marsden, T. and Murdoch, J. (eds), Between the local and the global, confronting complexity in the contemporary food sector. Oxford: Emerald Group Publishing Limited, pp. 323–358.
Westhoek, H., Van Zeijts, H., Witmer, M., Van den Berg, M., Overmars, K., Van der Esch, S. and Van der Bilt, W. (2014), “Greening the CAP. An analysis of the effects of the European Commission’s proposals for the Common Agricultural Policy 2014-2020, Netherlands Environmental Assessment Agency.
Version postprint
Figure 1. Dynamics of pesticide expenditures
Key: This figure presents the evolution of pesticide expenditures relatively to sales. Source: Own representation, after FADN 2000-2015.
Figure 2. Distribution of pesticide expenditures
Source: Own representation, after FADN 2000-2015.
0% 5% 10% 15% 20% 25% 30% 35% 2000 2001 2002 2003 2004 2005 2006 2007 2008 2009 2010 2011 2012 2013 2014 2015
Field crops Market gardening Wine growing
Fruit production Sheep and goat breeding Cattle breeding
Version postprint
Table 1. Key EU budget allocations for transitioning towards environmental and climate friendly practices and organic farming under the CAP 2014–2020
Budget Allocation Billion Euros
% of total EAFRD % of total EU budget for agriculture Budget allocation for Pillar 1 and Pillar 2
1. Pillar 1 - Market related expenditure and direct payments 312.7 76%
2. Pillar 2 – Rural development 99 24%
3. Total EU budget for agriculture (Pillar 1 + Pillar 2) 411.7 100%
Greening Component (Pillar 1)
4. Total national ceilings for direct payments 2014 - 2020 297.6 72.3%
5. Greening component (maximum 30% of direct payments) 89.3 21.7%
Climate and environment issues (Pillar 2)
6. Contribution to environment & climate issues - including
organic farming (minimum 30% of EAFRD) 29.7 30% 7.2%
Organic farming support (conversion and maintenance payments)
7. EAFRD organic farming support (Measure 11) 6.3 6.4% 1.5%
8. Total public expenditure (EU and Member States) for organic
farming support (Measure 11) 9.9
Total environmental and climate change spending for agriculture (Pillar 1 and Pillar 2)
9. EU budget for transition towards environmental and
climate-friendly agriculture 119 28.9%
Version postprint
Table 2. List of variables used in the analysis
Definition Hypotheses
Direction of the effect Dependent variable
Pesticides Value of pesticide expenditures (€/sales) / /
Explanatory variables
Hypothesis 1: European subsidies
1st Pillar Value of EU subsidies from the 1st Pillar (€/sales)
H1a +
Decoupled subsidies Value of decoupled subsidies from the 1st Pillar (€/sales)
2nd Pillar Value of EU subsidies from the 2nd Pillar (€/sales)
H1b -
Adverse weather conditions subsidies
Compensation for losses caused by adverse weather conditions (€/sales)
Agrienvironmental
grazing subsidies Agrienvironmental grazing subsidies (€/sales) Other agrienvironmental
subsidies Other agrienvironmental subsidies (€/sales) Hypothesis 2: Structural characteristics
Usable Agricultural Area Total Usable Agricultural Area of the farm (hectare) H2a +
Diversification Number of different crop produced on the farm (counter) H2b +
Total workforce Total workforce (in Agricultural Work Units, AWU) H2c -
Family farm The farm employs only family workforce (dummy) H2d -
Hypothesis 3: Individual characteristics
General education General education of the farm holder (4 categories: no
education, primary, secondary, higher) H3a -
Time spent by the farm holder on the farm
Time spent by the farm holder on his farm (3 categories: less
than ¼ time, between ¼ and ¾ time, more than ¾ time) H3b -
Hypothesis 4: Financial characteristics
Profitability Profitability measured by the Return on Assets (ROA) H4a +
Indebtedness Indebtedness measured by the debt-to-assets ratio H4b
Hypothesis 5: Control variables
Less-Favoured Area The farm is located in a Less-Favoured-Area (dummy) H5a -
ETO
E economic and Technical Orientation (1: field crops; 2: market gardening; 3: wine growing; 4: fruit production; 5: sheep and goat breeding; 6: cattle breeding; 7: other specializations)
Version postprint
Table 3a. Relative importance of pesticide expenditures on sales
Mean Std. Dev.
Pesticides expenses 12.90% 0.109
1st Pillar 21.60% 0.216
Decoupled subsidies 8.40% 0.128
2nd Pillar 4.20% 0.105
Compensation for losses caused by adverse weather conditions 0.50% 0.030
Agrienvironmental grazing subsidies 0.60% 0.029
Other agrienvironmental subsidies 0.40% 0.029
Key: Values are expressed relatively to sales. Source: Own computation, after FADN 2000-2015.
Table 3b. Relative importance of pesticide expenditures on sales according to farms and farmers’ characteristics Mean Std. Dev. Less-Favoured Area No 9.27% 0.081 Yes 14.05% 0.113 Education No 14.13% 0.110 Primary 12.61% 0.108 Secondary 11.42% 0.103 Higher 11.66% 0.114 Family No 13.91% 0.114 Yes 11.21% 0.095
Time spent by the farm holder on the farm
Less than ¼ time 12.83% 0.105 Between ¼ and ¾ time 14.91% 0.122 More than ¾ time 12.82% 0.108
ETO
Field crops 27.19% 0.102
Market gardening 6.33% 0.048
Wine growing 8.83% 0.070
Fruit production 10.64% 0.062 Sheep and goat breeding 8.29% 0.053
Cattle breeding 6.10% 0.058
Other specializations 12.03% 0.099 Key: Values are expressed relatively to sales.
Version postprint
Table 4. Econometric models
Model 1 Model 2
European subsidies
1st Pillar (/Sales) 0.014
Decoupled subsidies 0.152***
2nd Pillar (/Sales) -0.027*
Compensation for losses caused by adverse weather conditions 0.055***
Agrienvironmental grazing subsidies -0.304***
Other agrienvironmental subsidies -0.147***
Farm structure
Usable Agricultural Area 0.000*** 0.000***
Diversification 0.003*** 0.002***
Workforce
Total Workforce -0.007*** -0.007***
Family farm -0.027*** -0.025***
Time spent by the farm holder on the farm -0.003 -0.003
Farm holder’s general education (Reference: No education)
Primary -0.009*** -0.009***
Secondary -0.017*** -0.016***
Higher -0.017*** -0.016***
Financial situation of the farm
Profitability (ROA)-1 0.000 0.000
Indebtedness (Debt-to-asset ratio)-1 -0.000*** -0.000***
ETO (Reference: Field crops)
Market gardening -0.127*** -0.117***
Wine growing -0.124*** -0.113***
Fruit production -0.092*** -0.086***
Sheep and goat breeding -0.178*** -0.172***
Cattle breeding -0.191*** -0.184*** Other specializations -0.134*** -0.128*** Less-Favoured Area 0.006*** 0.006*** Year (Reference: 2000) 2001 0.003 0.002 2002 0.008 0.007 2003 0.002 0.002 2004 0.006 0.005 2005 0.006 0.004 2006 0.005 0.009 2007 -0.003 -0.024*** 2008 0.008 -0.011 2009 0.026*** 0.009 2010 -0.010 -0.029*** 2011 -0.010 -0.034*** 2012 -0.008 -0.029*** 2013 0.006 -0.014* 2014 0.002 -0.019** 2015 0.002 -0.018** Constant 0.248*** 0.245*** Nb of observations 106,384 106,384