HAL Id: halshs-00919340
https://halshs.archives-ouvertes.fr/halshs-00919340
Submitted on 16 Dec 2013
HAL is a multi-disciplinary open access
archive for the deposit and dissemination of
sci-entific research documents, whether they are
pub-lished or not. The documents may come from
teaching and research institutions in France or
abroad, or from public or private research centers.
L’archive ouverte pluridisciplinaire HAL, est
destinée au dépôt et à la diffusion de documents
scientifiques de niveau recherche, publiés ou non,
émanant des établissements d’enseignement et de
recherche français ou étrangers, des laboratoires
publics ou privés.
Distributions on the Sustainability of Bushmeat Hunting
Nathalie van Vliet, E.J. Milner-Gulland, François Bousquet, Mehdi Saqalli,
Robert Nasi
To cite this version:
Nathalie van Vliet, E.J. Milner-Gulland, François Bousquet, Mehdi Saqalli, Robert Nasi. Effect
of Small-Scale Heterogeneity of Prey and Hunter Distributions on the Sustainability of Bushmeat
Hunting. Conservation Biology, Wiley, 2010, 24 (5), pp.1327-1337. �halshs-00919340�
Effect of Small-Scale Heterogeneity of Prey and
Hunter Distributions on the Sustainability of
Bushmeat Hunting
NATHALIE VAN VLIET,
∗†† E. J. MILNER-GULLAND,† FRANCOIS BOUSQUET,‡ MEHDI SAQALLI,§
AND ROBERT NASI
∗∗∗Center for International Forestry Research (CIFOR), c/o IITA - HFEC, B.P. 2008, Yaound´e, Cameroon
†Department of Life Sciences, Imperial College London, Silwood Park Campus, Buckhurst Road, Ascot, Berkshire SL5 7PY, United Kingdom
‡Centre International de Recherche Agronomique pour le D´eveloppement (CIRAD), Campus International de Baillarguet, 34 398 Montpellier cedex 5, France
§Laboratoire des M´ecanismes et Transferts en G´eologie (LMTG), Observatoire Midi-Pyr´en´ees, 14, avenue Edouard Belin, F-31400 Toulouse, France
∗∗Center for International Forestry Research (CIFOR), P.O. Box 0113 BOCBD, Bogor 16000, Indonesia
Abstract: Bushmeat is the main source of protein and the most important source of income for rural people in the Congo Basin, but intensive hunting of bushmeat species is also a major concern for conservationists. Although spatial heterogeneity in hunting effort and in prey populations at the landscape level plays a key role in the sustainability of hunted populations, the role of small-scale heterogeneity within a village hunting territory in the sustainability of hunting has remained understudied. We built a spatially explicit multiagent model to capture the dynamics of a system in which hunters and preys interact within a village hunting territory. We examined the case of hunting of bay duikers (Cephalophus dorsalis) in the village of Ntsi´et´e,
northeastern Gabon. The impact of hunting on prey populations depended on the spatial heterogeneity of hunting and prey distribution at small scales within a hunting area. Within a village territory, the existence of areas hunted throughout the year, areas hunted only during certain seasons, and unhunted areas contributed to the sustainability of the system. Prey abundance and offtake per hunter were particularly sensitive to the frequency and length of hunting sessions and to the number of hunters sharing an area. Some biological parameters of the prey species, such as dispersal rate and territory size, determined their spatial distribution in a hunting area, which in turn influenced the sustainability of hunting. Detailed knowledge of species ecology and behavior, and of hunting practices are crucial to understanding the distribution of potential sinks and sources in space and time. Given the recognized failure of simple biological models to assess maximum sustainable yields, multiagent models provide an innovative path toward new approaches for the assessment of hunting sustainability, provided further research is conducted to increase knowledge of prey species’ and hunter behavior.
Keywords: gabon, hunting pressure, hunting sustainability, prey distribution, small-scale heterogeneity Efecto de la Heterogeneidad a Peque˜na Escala de la Distribuci´on de Presas y Cazadores sobre la Sustentabilidad de la Cacer´ıa de Carne de Monte
Resumen: La carne de monte es la principal fuente de prote´ına y la fuente de ingreso m´as importante de la poblaci´on rural en la Cuenca del Congo, pero la cacer´ıa intensiva de especies de carne de monte
††email n.vanvliet@cgiar.org
Paper submitted August 2, 2009; revised manuscript accepted November 1, 2009.
tambi´en es una preocupaci´on mayor de conservacionistas. Aunque la heterogeneidad espacial del esfuerzo de caza y de las poblaciones de presas a nivel de paisaje juega un papel clave en la sustentabilidad de las poblaciones cazadas, el papel de la heterogeneidad a peque˜na escala en el territorio de caza de una aldea en la sustentabilidad de la cacer´ıa ha sido poco estudiado. Elaboramos un modelo multiagente espacialmente expl´ıcito para capturar la din´amica de un sistema en el que cazadores y presas interact´uan en el territorio de caza de una aldea. Examinamos el caso de la caza deCephalophus dorsalis en el poblado de Ntsi´et´e,
noreste de Gab´on. El impacto de la cacer´ıa sobre las poblaciones de presas dependi´o de la heterogeneidad espacial de la cacer´ıa y de la distribuci´on de presas a escalas peque˜nas dentro del ´area de cacer´ıa. En un territorio de aldea, la existencia de ´areas cazadas durante el a˜no, ´areas cazadas solo durante ciertas ´epocas y ´areas sin cacer´ıa contribuyeron a la sustentabilidad del sistema. La abundancia de presas y la captura por cazador fueron particularmente sensibles a la frecuencia y duraci´on de las sesiones de caza y al n´umero de cazadores compartiendo un ´area. Algunos par´ametros biol´ogicos de las especies de presa, tales como la tasa de dispersi´on y el tama˜no del territorio, determinaron su distribuci´on espacial en una zona de cacer´ıa, que a su vez influy´o sobre la sustentabilidad de la cacer´ıa. El conocimiento detallado de la ecolog´ıa y comportamiento de las especies y las pr´acticas cineg´eticas son cruciales para entender la distribuci´on potenciales fuentes y vertederos en espacio y tiempo. Dado el fracaso reconocido de los modelos biol´ogicos simples para evaluar la producci´on m´axima sostenible, los modelos multiagente proporcionan un camino innovador hacia nuevos m´etodos para la evaluaci´on de la sustentabilidad de la cacer´ıa, siempre y cuando se realice m´as investigaci´on para incrementar el conocimiento de las especies de presa y la conducta de los cazadores.
Palabras Clave: distribuci´on de presas, Gab´on, heterogeneidad a peque˜na escala, presi´on de caza, sustentabil-idad de la cacer´ıa
Introduction
Many studies have documented the importance of bush-meat as a source of protein and income for rural peo-ple in the Congo Basin (Lahm 1993; Wilkie & Carpenter 1999; Bakarr et al. 2001). Duikers (Cephalophus spp.) are abundant and make up a large proportion of hunter offtake and bushmeat in markets; thus, researchers had used duikers to evaluate the sustainability of bushmeat hunting (reviewed in Wilkie & Carpenter 1999). Many researchers have based their models or indices on bio-logical parameters such as the stock recruitment model (McCullough 1987), the unified harvest model (Bodmer & Robinson 2004), or Robinson and Redford’s (1991) model. Nevertheless, these simple models do not address the spatial heterogeneity inherent in hunting systems, which is crucial for the sustainability of hunting. There are two components to spatial heterogeneity, hunter and prey distributions, and their interaction determines sustainability.
Previous modeling and empirical studies have demon-strated the importance of the spatial distribution of hunt-ing on population dynamics and dispersal rates of prey. Novaro et al. (2000) framed their work in terms of source–sink dynamics. The results of their literature re-view suggest that the presence of unhunted areas was a key determinant of hunting sustainability for tapirs (Tapirus terrestris). Salas and Kim (2002) also found, with an individual-based mode on tapirs, that for a given hunting intensity, the spatial configuration of hunted and unhunted areas affects sustainability. Several other re-searchers have demonstrated that the spatial distribution of hunting affects sustainability. With a simple model, Ling and Milner-Gulland (2008) showed that when hunter
costs are related to the distance they must travel to hunt, nonspatial calculations of maximum sustainable harvest are likely to be overoptimistic. Levi et al. (2009) devel-oped an empirically based model of hunter–prey interac-tions at the landscape scale, but did not consider explic-itly hunter decision-making processes. Sir´en et al. (2004) used simple, empirically derived functions to relate the distance a hunter must travel from the village to hunter effort and linked these functions to a prey population model to evaluate hunting sustainability. Bousquet et al. (2001) used a multiagent system to show that the sustain-ability of snare hunting for C. monticola depends more on the spatial distribution of snare lines than on the level of annual offtakes.
Although the results of these studies demonstrate that the effect of spatial heterogeneity at the landscape scale is linked to the distribution of hunted and unhunted forest blocks, they do not show how small-scale heterogeneity within hunted areas is linked to the distribution of hunt-ing trails and hunthunt-ing camps. Moreover, none of these re-searchers considered fully the spatial distribution of both prey dynamics (linked to habitat characteristics) and the distribution of hunting effort at the individual level to account for shifts in hunter and prey locations on the basis of meaningful decision rules. We used a multiagent system approach with spatially explicit agents to simu-late local individual decisions (Huston et al. 1988; Durett & Levin 1994). We modeled the effect of hunting on prey abundance in a realistic setting and included in the model key small-scale landscape features, such as vegeta-tion types, existing hunter paths, and camps. We tested the effect of spatial selectivity by hunters and by prey on hunting sustainability in a multiagent system model. Our hypothesis was that hunting sustainability is determined
by overall hunting effort and by the distribution of that effort relative to habitat associations of prey.
Methods
General Model
We used the CORMAS (common-pool resources and mul-tiagent systems) (Bousquet et al. 1998) platform to model a bay duiker (C. dorsalis) hunting system. This platform, developed by the Center for International Research in Agriculture for Development (CIRAD), represents spa-tially explicit and communicating entities (Bousquet et al. 1998). We programmed the model in Smalltalk with Vi-sualWorks (Cincom, Cincinnati, Ohio).
Bushmeat hunters target multiple species, but for clar-ity we focused our model only on the bay duiker, which is particularly affected by hunting effort in our study area (van Vliet et al. 2007). We assumed hunting effort is disas-sociated from bay duiker’s abundance in time and space. We based this assumption on the likelihood that in a mul-tispecies system hunters do not make decisions about hunting effort on the basis of the distribution of a single species, but on the aggregate biomass obtained from all species hunted. Although hunters use different methods, we focused our model on gun hunting because this tech-nique is widespread in the region and is used by more than 80% of the hunters (van Vliet 2008).
Spatial and Temporal Framework
The spatial scale in our model was 44.5 km2, which
cor-responded to the hunting territory of Ntsi´et´e, a village in the Ogoou´e-Ivindo Province, 30 km from the town of Makokou (northeastern Gabon). The most common vegetation is transition forest between evergreen and de-ciduous forests. The hunting territory was 58% mature forest, 31% secondary forest and natural gaps, 5% marshy forests, 4% rivers, and 2% roads. We imported a map of the territory, produced by van Vliet (2008), from Map-Info into CORMAS following Rala & Bousquet (2005). The map used in CORMAS is a raster image, and one cell rep-resents 1 ha. The layers of the map show the limits of the hunting territory; the village (represented by one cell); hunting trails for each family (trails used only during the dry seasons [along rivers] and trails used throughout the year are differentiated); hunting camps; and vegetation types.
The temporal scale sets one time step to 12 hours to account for daily decision making by hunters. Time is divided into seasons according to the prevailing sea-sons in Ntsi´et´e: two rainy seasea-sons and two dry seasea-sons. The region is characterized by a pure equatorial climate (Saint-Vil 1977 in Feer 1988), defined by four seasons, relatively low rainfall (1672 mm/year), and warm tem-peratures (mean 23.9◦C).
Population Dynamics of Bay Duiker
Little information is available about bay duikers. Bay duik-ers are solitary, territorial, and nocturnal, with a mean adult weight of 20 kg (Kingdon 1997). At maturity duiker offspring disperse away from the natal territory. Duiker dispersal rates are the same in tree plantations and mixed forests (Hart 2000). Dispersal distances are often >1 km, and animals may move more than once. A male’s ter-ritory can overlap several females’ territories, but terri-tories belonging to individuals of the same sex do not overlap (Feer 1988). At the Ipassa Reserve (Gabon), fe-male territories cover a minimum of 24.5 ha, whereas males concentrate 90% of their time in at least 48 ha (Feer 1988). Vegetation associations of bay duikers are poorly known. Hunters attest, however, that bay duikers use thick understories or forest gaps more often than ma-ture forests with sparse understories. Feer (1989) showed that bay duikers are not associated with any one vegeta-tion type during active periods but the species rest in forest gaps or thick understories. Annual mortality of bay duikers varies between 0.7 and 2.7 individuals/km2/year
in the Ituri forest, depending on vegetation type (Hart 2000).
We parameterized our model to conform to the avail-able data on the species. Where data were unavailavail-able, we used best estimates and feasible ranges of the baseline values (Table 1). We tested the sensitivity of our results to our assumptions. In our model, a dispersing animal moved consistently away from the natal territory. In each step, the dispersing animal moved randomly in one of the cells that was either equidistant or farther away from its natal territory until it reached the maximum time for dis-persal. At each position, we simulated the time it would take an animal to search for areas in which to settle. When the maximum dispersal time was reached, if the animal was still not settled, it was removed from the model. If a dispersing animal found an area with a minimum size of 25 ha (5 × 5 cells in the model; females) or 49 ha (7 × 7 cells; males) not yet occupied by an individual of the same sex, the animal settled there (scenario 0 in Table 2).
The model considered only dispersal within the hunt-ing area. No animals came from outside the hunthunt-ing area or dispersed outside the hunting area. This assumption means the model may underestimate immigration, partic-ularly if the areas surrounding the modeled territory have much higher duiker densities than the modeled territory. In this area, however, hunting villages are not located in a matrix of unhunted territory. Instead the surrounding areas are equally hunted. This means that the assumption of no immigration probably will not affect the qualita-tive conclusions that we can draw from the results of the model and that the assumption is parsimonious given the paucity of data on duiker dispersal patterns (van Vliet & Nasi 2008a).
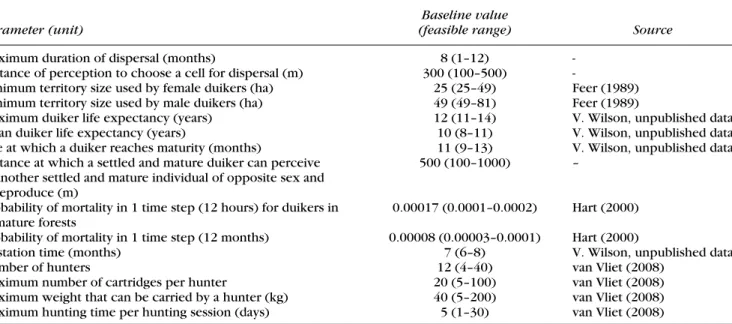
Table 1. Parameter values for duiker biology and hunters used in the model of hunting in Ntsi´et´e, Gabon.
Baseline value
Parameter (unit) (feasible range) Source
Maximum duration of dispersal (months) 8 (1–12) -Distance of perception to choose a cell for dispersal (m) 300 (100–500)
-Minimum territory size used by female duikers (ha) 25 (25–49) Feer (1989) Minimum territory size used by male duikers (ha) 49 (49–81) Feer (1989)
Maximum duiker life expectancy (years) 12 (11–14) V. Wilson, unpublished data Mean duiker life expectancy (years) 10 (8–11) V. Wilson, unpublished data Age at which a duiker reaches maturity (months) 11 (9–13) V. Wilson, unpublished data Distance at which a settled and mature duiker can perceive
another settled and mature individual of opposite sex and reproduce (m)
500 (100–1000) –
Probability of mortality in 1 time step (12 hours) for duikers in mature forests
0.00017 (0.0001–0.0002) Hart (2000) Probability of mortality in 1 time step (12 months) 0.00008 (0.00003–0.0001) Hart (2000)
Gestation time (months) 7 (6–8) V. Wilson, unpublished data Number of hunters 12 (4–40) van Vliet (2008)
Maximum number of cartridges per hunter 20 (5–100) van Vliet (2008) Maximum weight that can be carried by a hunter (kg) 40 (5–200) van Vliet (2008) Maximum hunting time per hunting session (days) 5 (1–30) van Vliet (2008)
We based our mortality estimates on those of Hart (2000), who showed that mortality rates are higher in mature forest, where predators are abundant, than in sec-ondary forests. If the animal was older than the mean life expectancy, its mortality was set regardless of vegetation type and equal to the mortality rate in mature forests. Bay duiker survival, reproduction, and location were updated at every time step on the basis of the parameter values in Table 1.
Hunter Behavior
We used the hunting practices presented in van Vliet (2008) in our model. Hunting occurred only along hunt-ing trails. At <10 km from the village, each family used its own trails. We defined traditional “ownership” as the historical rights to a certain portion of forest. At ≥10 km from the village, all trails and camps were used by all hunters. Trails along rivers were used only
Table 2. Description of scenarios without hunters, with a hunting system as observed in Ntsi´et´e, with homogeneous distribution of hunting effort, and with hunting effort targeting the primary vegetation in which prey occur.
Scenario Hunters Duikers
0 no hunters homogeneous distribution across vegetation types
0.a distribution according to primary vegetation association, X = 25% 0.b distribution according to primary vegetation association, X = 50% 0.c distribution according to primary vegetation association, X = 75% 1 hunting system as observed in Ntsi´et´e homogeneous distribution across vegetation types
1a distribution according to primary vegetation association, X = 25% 1b distribution according to primary vegetation association, X = 50% 1c distribution according to primary vegetation association, X = 75% 1d maximum size of female territories = 49 ha
1e maximum duration of dispersal = 1 month 1f maximum duration of dispersal = 12 months 2 homogeneous hunting homogeneous distribution across vegetation types
2a distribution according to primary vegetation association, X = 25% 2b distribution according to primary vegetation association, X = 50% 2c distribution according to primary vegetation association, X = 75% 2d maximum size of female territories = 49 ha
2e maximum duration of dispersal = 1 month 2f maximum duration of dispersal = 12 months 3a hunting target primary vegetation in
which prey occurs
distribution according to primary vegetation association, X = 25% 3b distribution according to primary vegetation association, X = 50% 3c distribution according to primary vegetation association, X = 75%
during the dry seasons because access was difficult during the wet seasons. Although the number of active hunters varies throughout the year, there are on average 12 ac-tive hunters who belong to the three main families of the village (van Vliet 2008). In the model the number of cartridges a hunter had for each trip was determined ex-ogenously, as was the number of hunters in the village. We tested the effect of these values on model outcomes in the sensitivity analyses. The model represented a sys-tem in which the number of hunters was fixed and all adult males hunted. This is a common situation in many Central African villages, particularly in remote areas. In the model, as observed in the study site, hunters moved along family hunting trails or the road. Hunter effort was based on the availability of cartridges, not on catch rate. This is a realistic assumption for villages in northeastern Gabon, and potentially beyond Gabon, because hunting is often the only available livelihood for men and it is carried out even when catches are low (Kumpel 2006; Coad 2008).
On the basis of discussions with hunters, we imple-mented the following decision rules. The number of car-tridges was randomly determined on the basis of an aver-age range of use of 3–20 cartridges during the dry seasons and 3–10 cartridges during the rainy seasons (three was the minimum number of cartridges needed for a hunting trip). For each trip, the hunter chose at random whether to hunt during the day or night. The choice between hunting from the village or a hunting camp depended on the number of cartridges a hunter had. If the hunter had <5 cartridges he hunted for a maximum of 12 hours and returned to the village. On a 1 day or 1 night trip, a hunter could carry only up to 40 kg of carcasses (i.e., two adult duikers).
The hunter moved 40 cells per time period (equivalent to 8 km a day) along the family’s trails or road. If a hunter had 5–10 cartridges, he went to a hunting camp <10 km from the village and spent a maximum of 3 days hunt-ing. If a hunter had >10 cartridges, he went to a camp >10 km from the village and spent a maximum of 5 days hunting. In both cases, the maximum carcass weight a hunter could carry home was 100 kg. Under these circum-stances hunters bring porters with them (van Vliet 2008). When hunters hunted from camps, they moved 40 cells per time period along the trails or roads that offered the shortest way to the camp. Once they reached the camp, they rested for 12 hours before taking short hunting trips during the day or night (maximum of 12 hours) and re-turning to the camp.
If a hunter and duiker were in the same cell, the proba-bilities the hunter would see and kill the duiker were 50% and 80%, respectively. These values were taken from in-terviews with hunters (van Vliet 2008) and from duiker surveys (van Vliet et al. 2007). Because hunters use meth-ods that work equally well in different vegetation types and at different times of day, probabilities of duiker
ob-servation did not vary among vegetation types (van Vliet et al. 2009).
When the hunter shot at an animal, the number of cartridges decreased by one. If the animal was killed, the weight of the carcass was added to the weight carried by the hunter, and the animal’s territory was left vacant and available for other dispersing individuals.
The hunter returned to the village after the maximum length of the hunting trip if the hunter had fewer than three cartridges or if his carcasses reached the maximum weight. Upon return to the village, the parameters deter-mining hunting effort per hunter (number of cartridges, time spent hunting, and weight carried on the back) were reinitialized. The hunter rested in the village for 3 days before the next hunting trip.
Scenarios
We ran several model scenarios (Table 2) to evaluate the effect of small-scale spatial heterogeneity in hunter pres-sure and prey distribution on duiker abundance. We ran each scenario 100 times for 110 years. There was no hunt-ing durhunt-ing the first 10 years. Ten years was long enough for the population to equilibrate in each scenario. The model provided results for bay duiker abundance and hunter offtake in year 110 for each run. We assessed dif-ferences in duiker abundance between paired scenarios with two-tailed t tests.
We evaluated whether the model reliability repre-sented duiker population dynamics by running the model 10 times each for 100 years with the baseline parameter values found in the literature (Table 1) at a range of initial duiker abundances. In scenario 0 (no hunters/no par-ticular vegetation association), all simulations converged to a carrying capacity of 364 individuals (8.1 ind./km2).
This value is within the density estimated by Feer (1989) (7.5–8.7 ind./km2) and within the range found by Noss
(1998) (0.3–8.7 ind./km2). In scenarios 0a, 0b, and 0c, in
which duikers were nonrandomly distributed among veg-etation types, we assumed duikers were able to settle only in territories in which X percentage of the area was cov-ered by secondary forests with thick undergrowth and fallen trees (Table 2). For simulations in which duikers were associated with secondary forests, all simulations converged to 195 individuals for X = 25%, 68 individuals for X = 50%, and 32.9 individuals for X = 75%.
In scenario 1 (organized hunting as observed in Ntsi´et´e), we assumed hunters hunted according to the de-cision rules outlined earlier and hunting was distributed heterogeneously within the hunting territory. In scenario 2 (homogeneous distribution of hunting pressure over the hunting territory), hunters chose their hunting area (close to the village or from a hunting camp) indepen-dent of the number of cartridges they had or the season. Hunters moved randomly in the forest. Hunting pres-sure was therefore distributed homogeneously over the
territory and every cell could be visited by a hunter at any time.
To test whether the difference between heterogeneous and homogenous distribution of hunting was related to the reference value chosen for the most sensitive pa-rameter correlated with duiker abundance (i.e., female territory size), we ran two additional scenarios, −1d and 2d, in which the female territory size was at its maximum (49 ha).
To test whether dispersal affected whether hunting was organized or homogeneous hunting, we ran four ad-ditional scenarios (1e, 1f, 2e, and 2f) with dispersal rates set at their maximum and minimum values (1 and 12 months) (Table 2). In scenario 1a, hunting was organized as in Ntsi´et´e, but duikers could settle only where 25% of the individual’s territory was covered by secondary forests and thick undergrowth. In scenarios 2a, 2b, and 2c (homogeneous distribution of hunting and duikers as-sociated with secondary forests), hunting effort was as in scenario 2, but duikers could settle where X (percent-age of the area covered by secondary forests with thick understory and fallen trees) equaled 25%, 50%, and 75% (respectively in 2a, 2b, and 2c). In scenarios 3a, 3b, and 3c (hunting effort targets primary vegetation in which prey occur), duiker behavior was as in 2a, 2b, and 2c re-spectively, but hunters moved preferentially in secondary forests with thick understory. As in scenario 2, hunters chose their hunting area (close to village or from a hunt-ing camp) independent of cartridge number and season.
Sensitivity Analyses
We ran sensitivity analyses for estimates of duiker abun-dance and for the hunter parameter values. For the duiker analyses, we varied the key duiker parameters simultane-ously in two different ways. First, we varied the parame-ters simultaneously over a feasible range (Table 1). Sec-ond, we varied them by ±10%. In both cases we ran the sensitivity analyses for an unhunted population. We ran the model for 150 random parameter combinations for each of the two approaches and used duiker abundance as the dependent variable in a general linear model (GLM) with a binomial link. We included all parameters as main effects only (McCarthy et al. 1995). We inferred the sig-nificance of each parameter as a determinant of duiker abundance from the size and significance of the coeffi-cients of the GLM and checked the model for linearity through examination of the residual plots.
The sensitivity analysis for hunter parameters was run for 150 random hunting parameter combinations in which we varied the number of hunters, maximum num-ber of cartridges per hunter, maximum weight that can be carried by a hunter, maximum time spent hunting per hunting session, and maximum time spent resting be-tween two hunting sessions. We used duiker abundance and total offtake as dependent variables in three general
linear models with a binomial link, including all parame-ters, as earlier.
Results
Sensitivity Analyses
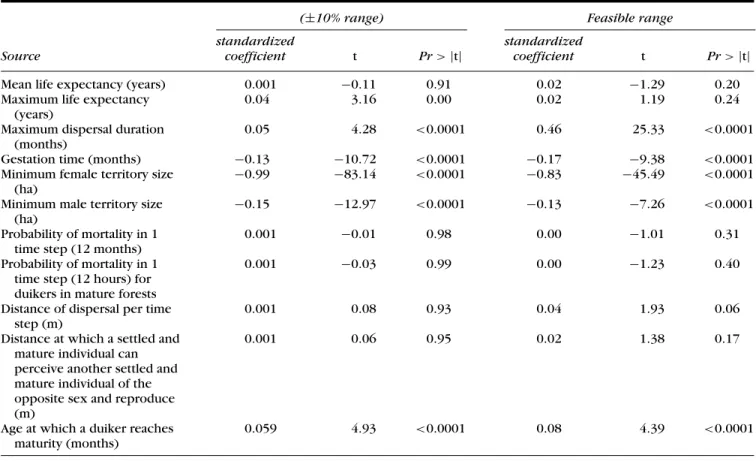
The biological parameters to which the model was most sensitive were the minimum size of female territories and the maximum dispersal time for duikers (Table 3). Other influential parameters were mean gestation time, mini-mum size of male territories, and mean age at maturity. Minimum territory size and mean gestation time were correlated negatively with duiker abundance, whereas maximum dispersal time and age at maturity were corre-lated positively with duiker abundance.
The sensitivity analysis of the effect of changes in hunter effort on abundance showed that prey abundance was correlated negatively with the number of hunters and positively with the time spent resting between two hunt-ing sessions and the length of hunthunt-ing sessions (Table 4). The length of hunting trips correlated positively to prey abundance, and offtake did not decrease significantly. Prey abundance was not affected significantly by varia-tion in the maximum weight a hunter can carry back to the village per hunting trip or by the maximum number of cartridges per hunter. Total offtake was correlated nega-tively with time spent in the village between two hunting sessions and positively with the number of hunters.
Comparison of Scenarios
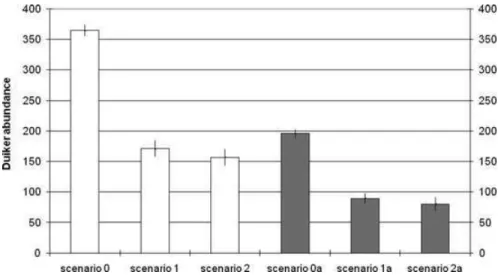
Duiker abundance stabilized at a mean of 364 individuals when they were not hunted (scenario 0). There were 170 individuals with hunting as observed in Ntsi´et´e (scenario 1) and 117 individuals with a homogeneous distribution of hunting effort (scenario 2; Fig. 1). In scenario 1 the choice of hunting area (close to the village or from a hunting camp) depended on season and number of car-tridges. Hunters used their family-owned hunting paths to move across the hunting area. Hence, within the hunting area, some animals never were hunted because their ter-ritory did not cross a hunting path. In scenario 2 all cells of the hunting territory could have been hunted. Prey abundance was significantly lower in scenario 2 (homo-geneous distribution of hunting) than in scenario 1 (hunt-ing as observed in Ntsi´et´e; n = 200, t test p = 0.005). The difference in duiker abundance between homogeneous hunting and organized hunting was independent of the vegetation association of the prey species. When duikers were associated with secondary forests and thick under-growth (X = 25%), duiker abundance stabilized at a mean of 195 individuals without hunters (scenario 0a), 89 in-dividuals with hunting as observed in Ntsi´et´e (scenario 1a), and 80 individuals with a homogeneous distribu-tion of hunting effort (scenario 2a). Prey abundance was
Table 3. Results of the sensitivity analysis of duiker abundance as a function of the values of the model parameters.
(±10% range) Feasible range standardized standardized
Source coefficient t Pr > |t| coefficient t Pr > |t| Mean life expectancy (years) 0.001 −0.11 0.91 0.02 −1.29 0.20 Maximum life expectancy
(years)
0.04 3.16 0.00 0.02 1.19 0.24 Maximum dispersal duration
(months)
0.05 4.28 <0.0001 0.46 25.33 <0.0001 Gestation time (months) −0.13 −10.72 <0.0001 −0.17 −9.38 <0.0001 Minimum female territory size
(ha)
−0.99 −83.14 <0.0001 −0.83 −45.49 <0.0001 Minimum male territory size
(ha)
−0.15 −12.97 <0.0001 −0.13 −7.26 <0.0001 Probability of mortality in 1
time step (12 months)
0.001 −0.01 0.98 0.00 −1.01 0.31 Probability of mortality in 1
time step (12 hours) for duikers in mature forests
0.001 −0.03 0.99 0.00 −1.23 0.40
Distance of dispersal per time step (m)
0.001 0.08 0.93 0.04 1.93 0.06 Distance at which a settled and
mature individual can perceive another settled and mature individual of the opposite sex and reproduce (m)
0.001 0.06 0.95 0.02 1.38 0.17
Age at which a duiker reaches maturity (months)
0.059 4.93 <0.0001 0.08 4.39 <0.0001
significantly lower in scenario 2a (homogeneous distribu-tion of hunting) than in scenario 1a (hunting as observed in Ntsi´et´e; n = 200, t test p = 0.03).
The difference in duiker abundance between homo-geneous and heterogenous hunting distributions did not depend on the value of the female territory size because the difference remained significant between scenarios 2d and 1d (n = 200, t test p value = 0.016). With ho-mogeneous hunting duiker abundance was significantly lower than with heterogeneous hunting, in which the maximum duiker dispersal time was 8 months (t test
p = 0.005) or 12 months (t test p = 0.016).
Neverthe-less, duiker abundance was not significantly greater with heterogeneous hunting compared with homogeneous hunting when the maximum time allowed for dispersal was at its minimum (Fig. 2). Therefore, the maintenance of higher duiker abundance under heterogeneous com-pared with homogeneous hunting scenarios depended greatly on dispersal patterns.
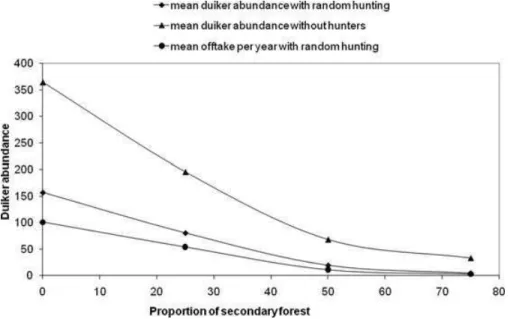
The impact of hunting on duiker abundance depended on whether duikers were associated with secondary forests and thick undergrowth (Fig. 3). Hunter offtake in-creased as strength of vegetation associations dein-creased, but the difference in mean duiker abundance between Table 4. Results of the generalized linear model testing the effect of changes in hunter effort on duiker abundance and hunter offtake.
Standard
Hunter parameter coefficient SD t Pr > |t| Compared with duiker abudance
weight carried by the hunter on his back −0.086 0.102 −0.843 0.413 initial number of cartridges 0.074 0.118 0.629 0.540 maximum time spent on a hunting trip 0.255 0.106 2.414 0.030 maximum time spent resting in the village between hunting trips 0.404 0.113 3.563 0.003 number of hunters −0.735 0.112 −6.584 <0.0001 Compared with global offtake
weight carried by the hunter on his back −0.004 0.126 −0.032 0.975 initial number of cartridges 0.206 0.147 1.408 0.181 maximum time spent on a hunting trip 0.230 0.131 1.751 0.102 maximum time spent resting in the village between hunting trips −0.694 0.141 −4.929 0.000 number of hunters 0.452 0.139 3.257 0.006
Figure 1. Mean duiker abundance under scenarios 0 (no hunters, no differential association between duiker and vegetation types,X =
0%), 0a (no hunters and duiker vegetation association,X = 25%),
1 (organized hunting,X = 0%), 1a
(organized hunting,X = 25%), 2
(homogeneous hunting,X = 0%),
and 2a (homogeneous hunting,
X = 25%) ( X, proportion of
secondary forest required within a given location for a duiker to settle; error bars, 95% CI for 100 runs of each model).
paired scenarios (0/2, 2a/0a, 2b/0b, 2c/0c) decreased as strength of vegetation associations increased. Neverthe-less, when hunters targeted secondary forests and thick undergrowth and no dispersal from outside the hunt-ing territory was allowed, selective hunthunt-ing lead to the local extirpation of duikers in a mean of 4.3 years for scenario 3a, 3.1 years for scenario 3b, and 2.1 years for scenario 3c.
Discussion
Our results show that the spatial distribution of the prey population relative to the spatial distribution of hunting effort is a crucial determinant of the ecological sustain-ability of the system. The organized hunting system main-tained over time and space higher duiker abundances than the homogeneous hunting system even in the ab-sence of immigration. But, in both systems, duiker abun-dance was highly dependent on the characteristics of small-scale dispersal within the hunting territory. The heterogeneity of hunting pressure over time and space in Ntsi´et´e increased the resilience of duiker abundance because unhunted areas (far from major hunting paths) were maintained and served as sources of duikers. More-over, the areas that were hunted only in certain seasons
(far from the village) varied in their role as source and sink over the year. Our results support those of Bous-quet et al. (2001), who showed that the sustainability of hunting depends on the spatial and temporal distribution of hunting effort. Our results also confirm the assump-tion of Cowlishaw et al. (2005) that the extent to which bushmeat hunting is unsustainable is likely to be variable and contingent on a variety of supply-and-demand fac-tors, such as the availability and distribution of habitat for bushmeat species and the local human population size.
By contrast, if hunting pressure is distributed homoge-neously over the hunting territory, limiting the number of hunters sharing the same hunting area and the frequency of hunting trips reduced negative effects on prey abun-dance (Table 4). When hunters took longer hunting trips (staying in hunting camps for long periods), prey abun-dance was higher than when hunters conducted 1-day hunting trips, and decrease in total offtake was not signif-icant. Staying in camps longer, and hunting from remote camps, may reduce the pressure around the village and provide the opportunity to rebuild depleted populations in heavily hunted areas close to the village. The vege-tation associations of the duiker population also had a strong influence on sustainability. Under a homogeneous distribution of hunting pressure, reduction in duiker
Figure 2. Duiker abundance under different scenarios of hunting effort (heterogeneous or homogeneous) depending on the duiker’s maximum dispersal time (1, 8, or 12 months; black, gray, and white bars, respectively; error bars, 95% CI for 100 runs of each model).
Figure 3. Duiker abundance under different proportions (X)
of secondary forest required for a duiker to settle in an unhunted population (scenarios 0, 0a, 0b, and 0c) and in a population with homogeneous hunting scenarios (2, 2a, 2b, and 2c).
abundance due to hunting was lower when duikers were highly dependent on a certain type of vegetation. Nev-ertheless, if hunting is concentrated in a vegetation type with which the prey are associated strongly, species that are highly dependent on specific vegetation types may be more vulnerable than generalist species. We found that duikers that were strongly associated with uncom-mon vegetation were extirpated quickly in the absence of nearby external sources that could rebuild a viable population.
A key issue in our research is that sustainability is af-fected by heterogeneities in hunting pressure related to vegetation associations of prey. Thus when hunters se-lect hunting areas for reasons other than prey density, the hunting system is more robust than when hunters target their efforts to areas with which prey are strongly associated. Hunting practices are in many cases deter-mined by anthropogenic landscape factors (e.g., pres-ence of camps, trails, roads) or technical factors (e.g., characteristics of vegetation and soil that determine visi-bility of foot prints and animals, the capacity of hunters to move silently) that are independent of prey abundance. For example, during the dry seasons, hunters target low-elevation forests near streams and rivers because the dried clay soil of the hills does not easily show recent foot prints and the dry leaves that cover the ground make too much noise when the hunter approaches its prey. Forests near rivers offer a moist soil, where foot prints are easily detected even during the dry seasons. On the contrary, during the rainy seasons, hunters target hills of mature forest because most paths along the streams are flooded, foot prints are easily visible on the humid clay soils, and visibility is much better than in secondary forests or swampy areas (van Vliet & Nasi 2008a).
The uncertainty in our model is hard to estimate, given the paucity of data on duiker population dynamics. The
biological parameters that most influence model out-comes are also those for which we have little information: maximum time spent dispersing and female territory size. Dispersal patterns are unknown for duiker species. Ter-ritory sizes for male and female duikers available in the literature were derived from few individuals and error was not measured. Territory sizes may vary with the age of the individual, the availability of food resources, and the presence of structures used as resting sites. Never-theless, we found that the heterogeneous hunting dis-tribution observed at Ntsi´et´e maintains a higher duiker abundance than homogeneous hunting for a range of maximum dispersal times and independent of female ter-ritory size. In its present form, our model cannot be used as a tool to assess the sustainability of hunting for bay duikers because of the uncertainty surrounding the most influential biological parameters. Better knowledge of dis-persal patterns is crucial to examining the effects of hunt-ing on prey populations and would significantly increase the potential for managers and researchers to implement the most sustainable hunting schemes. To understand dispersal, it is important to consider the dispersal ca-pabilities of the organism and the interactions between the organism’s behavior and landscape pattern, especially heterogeneity and fragmentation (Vuilleumier & Metzger 2006). Moreover, to be used for assessment of hunting sustainability, a model needs to consider explicitly con-sier multispecies hunting (Rowcliffe et al. 2003).
An important element that is missing in our model is the feedback that occurs between prey abundance and hunter effort. Although the costs of hunting effort likely drive the distribution of hunting as shown by Clayton et al. (1997), we assumed hunters choose their cartridge numbers and trip characteristics for reasons other than maximizing hunting success and that they do not actively shift hunting locations if an area is depleted. As discussed,
this may be a realistic assumption if people are hunting with low opportunity costs and in a relatively opportunis-tic way and if hunting effort is jointly determined by the overall catch, rather than by the catch of one particular species.
Given the recognized failure of simple biological mod-els to assess maximum sustainable yields (Milner-Gulland & Akc¸akaya 2001; van Vliet & Nasi 2008b), multiagent models are an innovative way to assess hunting sustain-ability. They allow one to model individual behavior of both hunters and prey, and to represent the interactions of the agents within their spatial and temporal environ-ment. We found that multiagent models are useful in rep-resenting the evolution of social and ecological systems over time scales compatible with the notion of sustain-ability. Multiagent simulations can also be used to en-courage collective action and learning among different stakeholders (e.g., resource users, managers, scientific community) in community hunting management (Bous-quet et al. 2005).
Acknowledgments
The authors thank CIFOR (Centre for International Forestry Research) and CIRAD (Center for International Research in Agriculture for Development) for their finan-cial support. The authors also acknowledge the support of a Royal Society Wolfson Research Merit award to E.J. Milner-G¨ulland.
Literature Cited
Bakarr, M. I., G. A. B. da Fonseca, R. Mittermeir, A. B. Rylands, and K. W. Paenemilla. 2001. Hunting and Bushmeat utilization in the African rain forest: perspectives towards a blueprint for conservation action. Conservation International, Washington, D.C.
Bodmer, R. E., and J. G. Robinson. 2004. Evaluating the sustainability of hunting in the Neotropics. Pages 303–323 in K. Silvius, R. Bodmer, and I. J. Fragoso, editors. People in nature: wildlife conservation in South and Central America, Columbia University Press, New York. Bousquet, F. I., I. Bakam, H. Protonand, and C. LePage. 1998. Cormas:
common-pool ressources and multi-agents systems. Lecture Notes in Artificial Intelligence 1416:826–837.
Bousquet, F., Ch. LePage, I. Bakamand, and A. Takforyan. 2001. A spatially-explicit individual-based model of bleu duikers popula-tion dynamics: multi-agent simulapopula-tions of bushmeat hunting in an eastern cameroonian village. Ecological Modelling 138:331– 346.
Bousquet, F., G. Tr´ebuiland, and B. Hardy. 2005. Companion modeling and multi-agent systems for integrated natural resource management in Asia. Metro Manila, Manila.
Clayton, L., M. Keeling, and E. J. Milner-Gulland. 1997. Bring-ing home the bacon: a spatial model of wild pig har-vesting in Sulawesi, Indonesia. Ecological Applications 7:642– 652.
Coad, L. 2008. Bushmeat hunting in Gabon: socio-economics and hunter behaviour. PhD thesis. University of Cambridge, Cambridge, United Kingdom.
Cowlishaw, G., S. Mendelson, and J.M. Rowcliffe. 2005. Evidence of post-depletion sustainability in a mature bushmeat market. Journal of Applied Ecology 42:460–468.
Durett, R. and S. Levin. 1994. The importance of being discrete (and spatial). Theoretical Population Biology 46:363–394.
Feer, F. 1988. Strat´egies ´ecologiques de deux esp`eces de bovid´e sympa-triques de la forˆet sempervirente africaine (Cephalophus callipigus et C. dorsalis): influence du rythme d’activit´e. Universit´e Pierre et Marie Curie, Paris.
Feer, F. 1989. Comparaison des r´egimes alimentaires de Cephalophus callipygus et C. dorsalis. Mammalia 53:563–604.
Hart, J. A. 2000. Impact and sustainability of indigenous hunting in the Ituri forest, Congo-Za¨ıre: a comparison of unhunted and hunted duiker populations. Pages 106–153 in E. Robinson, J. G. Bennet, and E. L. Bennet, editors. Hunting for sustainability in tropical forests. Huston, M., D. DeAngelis, and W. Post. 1988. New computer models
unify ecological theory. Bioscience 38:682–691.
Kingdon, J. 1997. The kingdon field guide to African Mammals. Aca-demic Press, London.
Kumpel, N. 2006. Incentives for sustainable hunting of bushmeat in Rio Muni, Equatorial Guinea. PhD thesis. Institute of Zoology, Imperial College, London.
Lahm, S. A. 1993. Ecology and economics of human/wildlife interac-tion in Northeastern Gabon. Journal of Applied Ecology 42:460– 468.
Levi, T., H. S. Glenn, J. Ohl-Schacherer, C. A. Peres, and W. Y. Dou-glas. 2009. Modelling the long-term sustainability of indigenous hunting in Manu National Park, Peru: landscape-scale management implications for Amazonia. Journal of Applied Ecology 46:804– 814.
Ling, S., and E. J. Milner-Gulland. 2008. When does spatial structure matter in models of wildlife harvesting? Journal of Applied Ecology
45:63–71.
McCarthy, M., M. Burgman, and S. Ferson. 1995. Sensitivity analysis for models of population viability. Biological Conservation 73:93–100. McCullough, D. R. 1987. The theory and management of Odocoileus populations. Pages 535–549 in C. Wemmer, editor. Biology and management of the Cervideae. Smithsonian Institution Press, Wash-ington, D.C.
Milner-Gulland, E. J., and H. R. Akc¸akaya. 2001. Sustainability indices for exploited populations. Trends in Ecology & Evolution 16:686–692. Noss, A. J. 1998. The impact of BaAka net hunting on rainforest wildlife.
Biological Conservation 86:161–167.
Novaro, A. J., K. H. Redford, and R. E. Bodmer. 2000. Effect of hunt-ing in source-sink systems in the Neotropics. Conservation Biology
14:713–721.
Rala, A., and F. Bousquet. 2005. Conversion manual between GIS and CORMAS. Centre de Recherches Agronomiques pour le D´eveloppement (CIRAD), Montpellier, France. Available from http://cormas.cirad.fr/pdf/GIS_Cormas.pdf (accessed June 2006). Robinson, J. G., and K. H. Redford. 1991. Sustainable harvest of
Neotrop-ical forest animals. University of Chicago Press, Chicago.
Rowcliffe, J. M., G. Cowlishaw, and J. Long. 2003. A model of human hunting impacts in multi-prey communities. Journal of Applied Ecol-ogy 40:872–889.
Salas, L. A, and J. Kim. 2002. Spatial factors and stochasticity in the evaluation of sustainable hunting of tapirs. Conservation Biology
16:86–96.
Sir´en, A., P. Hamb¨ack, and J. Machoa. 2004. Including spatial hetero-geneity and animal dispersal when evaluating hunting: a model anal-ysis and an empirical assesment in an Amazonian Community. Con-servation Biology 18:1315–1329.
van Vliet, N. 2008. Spatial and temporal variability within the “hunter-animal-village territory” system—towards a geographical approach to hunting sustainability in Central Africa- case study on duikers in north-east Gabon. PhD dissertation. Facult´e de G´eographie, Univer-sit´e Toulouse le Mirail, Mirail.
van Vliet, N., and R. Nasi. 2008a. Hunting for livelihood in northeast Gabon: patterns, evolution, and sustainability. Ecology and Society
van Vliet, N., and R. Nasi. 2008b. Why do models fail to assess properly the sustainability of duiker (Cephalophus spp.) hunting in Central Africa? Oryx 42:392–399.
van Vliet, N., R. Nasi, L. Emmons, F. Feer, P. Mbazza, and M. Bourgarel. 2007. Evidence for the local depletion of bay duiker Cephalophus
dorsalis within the Ipassa Man & Biosphere Reserve, North-East Gabon. African Journal of Ecology 45:440–443.
van Vliet, N., E. Kaniowska, M. Bourgarel, C. Fargeotand, and R. Nasi.
2009. Answering the call! Adapting a traditional hunting practice to monitor duiker populations. African Journal of Ecology 47:393–399. Vuilleumier, S., and R. Metzger. 2006. Animal dispersal modelling: han-dling landscape features and related animal choices. Ecological Mod-elling 190:159–170.
Wilkie, D. S., and J. F. Carpenter. 1999. Bushmeat hunting in the Congo Basin: an assessment of impacts and options for mitigation. Biodi-versity and Conservation 8:927–955.