Publisher’s version / Version de l'éditeur:
Vous avez des questions? Nous pouvons vous aider. Pour communiquer directement avec un auteur, consultez la première page de la revue dans laquelle son article a été publié afin de trouver ses coordonnées. Si vous n’arrivez pas à les repérer, communiquez avec nous à PublicationsArchive-ArchivesPublications@nrc-cnrc.gc.ca.
Questions? Contact the NRC Publications Archive team at
PublicationsArchive-ArchivesPublications@nrc-cnrc.gc.ca. If you wish to email the authors directly, please see the first page of the publication for their contact information.
https://publications-cnrc.canada.ca/fra/droits
L’accès à ce site Web et l’utilisation de son contenu sont assujettis aux conditions présentées dans le site LISEZ CES CONDITIONS ATTENTIVEMENT AVANT D’UTILISER CE SITE WEB.
The Journal of Physical Chemistry Letters, 11, 10, pp. 4179-4185, 2020-05-05
READ THESE TERMS AND CONDITIONS CAREFULLY BEFORE USING THIS WEBSITE.
https://nrc-publications.canada.ca/eng/copyright
NRC Publications Archive Record / Notice des Archives des publications du CNRC :
https://nrc-publications.canada.ca/eng/view/object/?id=b4a48c9a-1280-4ddf-b4c5-27c65717bd6f https://publications-cnrc.canada.ca/fra/voir/objet/?id=b4a48c9a-1280-4ddf-b4c5-27c65717bd6f
NRC Publications Archive
Archives des publications du CNRC
This publication could be one of several versions: author’s original, accepted manuscript or the publisher’s version. / La version de cette publication peut être l’une des suivantes : la version prépublication de l’auteur, la version acceptée du manuscrit ou la version de l’éditeur.
For the publisher’s version, please access the DOI link below./ Pour consulter la version de l’éditeur, utilisez le lien DOI ci-dessous.
https://doi.org/10.1021/acs.jpclett.0c01023
Access and use of this website and the material on it are subject to the Terms and Conditions set forth at
Conformational order in aggregated rra-P3HT as an indicator of quality
of boron nitride nanotubes
Jakubek, Zygmunt J.; Chen, Maohui; Martinez Rubi, Yadienka; Simard,
Benoit; Zou, Shan
Conformational Order in Aggregated rra-P3HT as an Indicator of
Quality of Boron Nitride Nanotubes
Zygmunt J. Jakubek,
*
Maohui Chen, Yadienka Martinez Rubi, Benoit Simard, and Shan Zou
Cite This:J. Phys. Chem. Lett. 2020, 11, 4179−4185 Read Online
ACCESS
Metrics & More Article Recommendations*
sı Supporting InformationABSTRACT: We report on investigation, by correlated polarized excitation fluorescence microscopy (PEFM) and atomic force microscopy (AFM) imaging, of the conformational order of regiorandom poly(3-hexyl-thiophene) (rra-P3HT) aggregated on two boron nitride nanotube (BNNT) materials (BNNT-2 and BNNT-3) processed by different purification methods. rra-P3HT photoluminescence excited by linearly polarized light shows polarization direction-dependent intensity with a modulation depth, M, generally >0.5 for rra-P3HT on nanotubes and <0.5 for rra-P3HT on nontubular impurities. PEFM-measured modulation depth value distributions can be decomposed into two components, one corresponding to ordered rra-P3HT on nanotubes and the other to disordered rra-P3HT on impurities. The nanotube component peaks at M = 0.64 and 0.70 and comprises 60% and 78% of the normalized distribution for rra-P3HT on BNNT-2 and BNNT-3, respectively, indicating higher quality and higher fraction of nanotubes in the latter material. The method can be integrated in a material development platform to monitor production and purification progress.
A
vailability in recent years of large-scale boron nitride nanotube (BNNT) production methods has both stimulated and facilitated in-depth investigation of BNNT properties, optimization of processing technologies, and development of applications.1−5 BNNT materials, except forthose produced by chemical vapor deposition at laboratory scales, typically contain a large amount of impurities such as allotropes of boron, saturated and unsaturated boron-containing polymers, amorphous and crystalline boron nitride particles and shells, and various other boron nitride derivatives. Elemental boron and, to a lesser extent, other impurities can be removed from raw BNNT materials by high-temperature oxidation and solvent washing.1,6
BNNT materials are generally assessed in terms of purity (fraction of nanotubes and impurities), defect density (presence of structural defects, chemical groups, or contam-inants on nanotube surface), the number of walls, and the nanotube length and diameter distributions.7−9 However, fast
and quantitative assessment of bulk BNNT material quality is challenging because most spectroscopic methods either do not efficiently differentiate hexagonal boron nitride (h-BN) and BN derivatives from nanotubes because of their similar optical properties or their availability and applicability is limited by a large band gap of BNNT and h-BN.10,11
Previously, we reported on differentiation between nano-tubes and impurity particles in BNNT materials in suspension using regiorandom poly(3-hexyl-thiophene) (rra-P3HT) as a spectral indicator.12 Upon addition of yellow/orange-colored rra-P3HT chloroform solution to a suspension of a BNNT material, the color changes to magenta/purple and unique structured absorption bands emerge, similar to those observed
for neat regioregular P3HT aggregates in suspension. Emergence of the bands is attributed to ordered aggregation of rra-P3HT on nanotubes facilitated by strong π−π and electrostatic interactions between the nanotubes and the P3HT backbone13that overcomes steric repulsion of randomly distributed and oriented side chains and enhances planariza-tion and subsequent stacking of the polymer. Following on that observation, we recently developed a methodology for relative quality assessment of BNNT materials using UV−vis absorption spectroscopy.14
Building upon our past research,12,14 we explored in this work whether the strong interaction between rra-P3HT and nanotubes could facilitate differentiation between nanotubes and impurities at a single-particle level, provide validation of the recently developed UV−vis absorption spectroscopy-based quality index method, and further allow for independent or complementary to other existing methods assessment of BNNT material quality using polarized excitation fluorescence microscopy (PEFM). In conjugated polymers like P3HT, polarized excitation-induced photoluminescence modulates with polarization direction and the modulation depth, M, a morphological order parameter, indicates chromophore or segmental alignment.15−19Its value ranges nominally between Received: March 31, 2020
Accepted: May 5, 2020 Published: May 5, 2020
Published 2020 by the American
Downloaded via NATL RESEARCH COUNCIL CANADA on July 2, 2020 at 15:43:03 (UTC).
0 and 1, approaching 1 when the majority of transition dipole moments within a chain or between chains are parallel to each other, such as in a highly ordered rod structure, and 0 when dipole moments are oriented randomly.
We recorded a series of correlated polarized excitation fluorescence microscopy (PEFM) and atomic force micros-copy (AFM) images for rra-P3HT assembled on two BNNT materials (BNNT-2 and BNNT-3) purified by different methods. Details of BNNT synthesis and purification, sample preparation, and image acquisition and analysis procedures can be found in theSupporting Informationas well as in our earlier publications.1,6,12,14,20 High-resolution AFM topography im-ages served as an independent differentiation method between nanotubes and impurities at the basis set development stage of the analysis. For most high aspect ratio objects in AFM images, which we identified as nanotubes or their small bundles
(Figure 1A,B), we observed high rra-P3HT photoluminescence
modulation depth values (Figure 1C,D). This observation was consistent with ordered aggregation of rra-P3HT with the polymer backbone planarized and axially aligned with nano-tubes.12,14The majority of low modulation depth value pixels correlated with nontubular objects identified in the corre-sponding AFM images as impurities. Polymer planarization and π−π stacking on nanotubes could be hindered by local structural or chemical defects of or impurities residing on nanotubes resulting in observation of locally reduced
modulation depth values. Because PEFM resolution is diffraction-limited, reduced modulation depth values were also observed whenever nanotubes crossed one with another or an impurity particle resided within a few hundred nanometers of a nanotube. For some seemingly nontubular structures, high modulation depth value pixels were observed next to low modulation depth ones. In most cases this was due to a presence of a short nanotube, which could be observed in a corresponding high-resolution AFM image either bound to or residing next to an impurity particle. In total, we recorded four and three sets of correlated PEFM/AFM images representative of each material for rra-P3HT/BNNT-2 and rra-P3HT/ BNNT-3, respectively. The PEFM polarization sets of images were acquired with excitation polarization rotated in 20° steps, and photoluminescence as a function of polarization direction was pixel-by-pixel analyzed to determine photoluminescence modulation depth, M (see the Supporting Information for details of the analysis and Figures S1−S4 for additional examples of AFM and PEFM images). At the material analysis stage of this project, modulation depth value distributions were determined for each polarization set and combined for each material. The distributions were generated from PEFM modulation depth mapping images using all particles and all pixels with above the threshold average photoluminescence intensity. No particles were masked at this stage of the analysis. The AFM images shown inFigures S1A and S3Aare presented
Figure 1.Representative correlated AFM topography (A and B) and photoluminescence modulation depth mapping (C and D) images and all-particle-combined modulation depth value distributions (E and F) for rra-P3HT/BNNT-2 and rra-P3HT/BNNT-3, respectively.
The Journal of Physical Chemistry Letters pubs.acs.org/JPCL Letter
https://dx.doi.org/10.1021/acs.jpclett.0c01023
J. Phys. Chem. Lett. 2020, 11, 4179−4185
for readers’ reference only and were neither used nor required for the generation of the modulation depth value distributions. The combined distributions are shown in panels E and F of
Figure 1 for rra-P3HT/BNNT-2 and rra-P3HT/BNNT-3,
respectively.
Examining the distributions, we observed that both resembled a bimodal distribution with the higher mean modulation depth value component peaking near 0.6 and 0.7 for rra-P3HT/BNNT-2 and rra-P3HT/BNNT-3, respectively,
and the lower one approximately centered in the 0.2−0.4 range for both materials. Following this observation we hypothesized that, first, the modulation depth value distribution, a measure of conformational order of rra-P3HT assembled on a BNNT material, could be decomposed into two components, one corresponding to rra-P3HT aggregated on nanotubes (the higher mean value component) and the other on impurity particles (the lower mean value one) and, second, the fraction
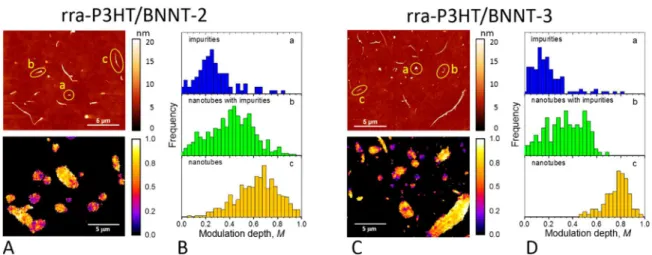
Figure 2.Representative correlated AFM topography and modulation depth value mapping images (A and C) and single-particle modulation depth value histograms (B and D) corresponding to impurities (a), nanotubes with attached impurities (b), and nanotubes (c) for rra-P3HT/BNNT-2 (A and B) and rra-P3HT/BNNT-3 (C and D).
Figure 3.Isolated particle modulation depth value distributions and the best fit asymmetric double sigmoidal curves for rra-P3HT aggregated on selected impurities (A) and nanotubes (B) for BNNT-2 and BNNT-3. All-particle combined modulation depth value distributions as well as the best fit orthogonal decomposition curves (red lines) and sigmoidal curves corresponding to impurities (shaded blue) and nanotubes (shaded orange) for rra-P3HT/BNNT-2 and rra-P3HT/BNNT-3 (C and D, respectively).
ratio and the center values of the components could be used as indicators of relative purity and quality of BNNT materials.
To evaluate feasibility of the decomposition and to develop a decomposition basis set, we first examined in detail modulation depth values for a few typical nanotubes, nanotubes with attached impurities, and impurity particles. Example AFM and photoluminescence modulation depth value mapping images of the three classes of the particles together with corresponding modulation depth histograms are shown in Figure 2for rra-P3HT/BNNT-2 (Figure 2A,B) and rra-P3HT/BNNT-3
(Figure 2C,D). Nanotubes, nanotubes with attached
impur-ities, and impurities for which the corresponding histograms were generated are labeled in the AFM images by a, b, and c, respectively. Clearly, most pixels corresponding to the two selected impurity particles show the modulation depth value smaller than 0.5, while for the vast majority of those corresponding to the two nanotubes, the modulation depth values are greater than 0.5, peaking at approximately 0.7 and 0.8 for rra-P3HT/BNNT-2 and rra-P3HT/BNNT-3, respec-tively. Modulation depth for the nanotubes with attached impurities covers a broad range of values with the mean values intermediate between those for impurities and nanotubes.
Following the initial review of typical single-particle histograms, modulation depth value distributions were generated from PEFM modulation depth value mapping images for sets of selected isolated single nanotubes and impurity particles, both unequivocally classified as such following a thorough examination of corresponding AFM images. Only nanotubes with AFM measured heights in the (1−7) nm range were included. All other objects such as bundled, crossing, or aggregated nanotubes; nanotubes with attached or proximal impurity particles; and all other particles that we could not clearly classify in AFM images as single nanotubes or single impurities were masked out in the modulation depth images. The resulting two-material-com-bined distributions are shown in Figure 3A for impurity particles (shaded blue) andFigure 3B for nanotubes (shaded orange). Contributions from P3HT/BNNT-2 and rra-P3HT/BNNT-3 are shown shaded dark gray and light gray, respectively. Despite our best effort to thoroughly select single isolated nanotubes, the nanotubes distribution appears relatively broad. Because of the dynamic nature of rra-P3HT assembly on nanotubes, polydispersity of polymer chain length, and random distribution of hexyl side chains, one should not expect perfectly ordered, homogeneous aggregation of rra-P3HT on nanotubes resulting in a monodisperse modulation
depth distribution. In addition, because AFM topography imaging of rra-P3HT-covered nanotubes could not always detect small, a few nanometers-in-diameter impurity particles attached to nanotubes nor single atom/molecule structural or chemical defects, these also contributed to broadening of the nanotube modulation depth distribution shown inFigure 3B. Finally, automatic PEFM image processing and analysis also contributed to the distribution broadening.
The nanotube and impurity modulation depth value distributions (Figure 3A,B) were subsequently used to develop decomposition basis functions. Both distributions could be fitted with varying goodness of fit to four-parameter asymmetric functions such as log-normal, modified Gaussian, or skew normal. However, because none of these functions provided a satisfactory fit to both distributions and in the absence of a clear understanding of an expected functional form of these distributions, we chose to use a five-parameter asymmetric double sigmoidal function, y(M), with all five parameters easily relatable to the measured distributions, where = + − × − + − − + − − i k jjj y{zzz Ä Ç ÅÅÅÅÅ ÅÅÅÅÅ ÅÅÅÅÅ ÅÅÅÅ ikjjj y { zzz É Ö ÑÑÑÑÑ ÑÑÑÑÑ ÑÑÑÑÑ ÑÑÑÑ y M( ) C 1 1 exp 1 1 1 exp M x w M x w w w c 21 2 c 21 3 (1)
and M is a modulation depth, C an amplitude, xc a center
value, and w1 a full width at half-maximum; w2 and w3 are
variances of the low- and high-modulation depth value side of the distribution, respectively. The best fit asymmetric double sigmoidal functions for selected isolated impurities (Figure 3A, red line andTable 1) and nanotubes (Figure 3B, red line and
Table 1) were adopted as the basis set for subsequent
orthogonal decomposition of the multiset-combined all-particle modulation depth value distributions (Figure 1E,F). The combined distributions of each of the two materials were fitted to a g(M) function given by
= +
g M( ) fNT NTy ( )M fImp Impy ( )M (2)
where yNT(M) and yImp(M) are the nanotube and impurity
basis functions, respectively, and fNTand fImpare normalized
nanotube and impurity coefficients (fractions) determined in Table 1. Asymmetric Double Sigmoidal Function Best Fit Parameters for the Nanotube and Impurity Basis Sets and for the rra-P3HT/BNNT-2 and rra-P3HT/BNNT-3 Combined Modulation Depth Value Distributionsa
basis sets rra-P3HT/BNNT-2 rra-P3HT/BNNT-3 nanotubes impurities nanotubes impurities nanotubes impurities
fi 0.602 (8) 0.398 (6) 0.775 (6) 0.225 (4) xc 0.662 (10) 0.248 (4) 0.640 (2) 0.299 (3) 0.700 (2) 0.246 (4) w1 0.273 (34) 0.308 (13) [0.273] [0.308] [0.273] [0.308] w2 0.149 (8) 0.050 (2) [0.149] [0.050] [0.149] [0.050] w3 0.067 (3) 0.137 (4) [0.067] [0.137] [0.067] [0.137] C 578 (51) 2166 (75) R2 0.993 0.998 0.987 0.988 aThe parameters C, x
c, and wi(where i = 1, 2, 3) are defined ineq 1. The parameters with their values shown in italic and enclosed in square
brackets were fixed in the deconvolution fit; the same values were used for both materials. fivalues, where i is NT or Imp, are normalized nanotube
and impurity coefficients (fractions) determined in the combined modulation depth value distribution fit (seeeq 2). Numbers in parentheses are one standard deviation of the fit in the units of the last digit shown. R2is the adjusted coefficient of determination.
The Journal of Physical Chemistry Letters pubs.acs.org/JPCL Letter
https://dx.doi.org/10.1021/acs.jpclett.0c01023
J. Phys. Chem. Lett. 2020, 11, 4179−4185
the fits, respectively. The orthogonal decomposition parame-ters are listed in Table 1, and the results are illustrated in panels C and D ofFigure 3 for P3HT/BNNT-2 and rra-P3HT/BNNT-3, respectively, where the best fit functions are shown by red solid lines and the orthogonal components corresponding to impurities and nanotubes are shaded blue and orange, respectively. In the decomposition fits, amplitudes (C) and center values (xc) of the basis functions were adjusted
while the three shape parameters w1, w2, and w3 were
constrained at the basis set values. The center value and the normalized fraction for the nanotube component of the distributions were 0.64 and 60% for rra-P3HT/BNNT-2 and 0.70 and 78% for rra-P3HT/BNNT-3, respectively. The corresponding values for the impurity component were 0.30 and 40% for P3HT/BNNT-2 and 0.25 and 22% for rra-P3HT/BNNT-3, respectively.
As previously mentioned, the modulation depth values nominally range from 0 to 1. However, we observed a small number of pixels with 1 < M < 1.2. This was most likely an artifact of automatic image processing and, perhaps to a lesser extent, an effect of nonuniform illumination. Automatic background correction and background level determination may have resulted in locally overcorrected background, which, in turn, could give rise to modulation depth values for some pixels greater than 1. While such overcorrection could take place anywhere in an image, the areas around the brightest features are most likely to be affected, particularly if two or more nearby particles are not well separated.
The nanotube components of the modulation depth value distributions for rra-P3HT/BNNT-2 and rra-P3HT/BNNT-3 (Figure 3) resemble distributions predicted by Hu et al.15for defect-cylinder (structure VI) and rod (structure IV) model polymer conformations, respectively, while the appearance of impurity components for both materials is consistent with disordered polymer conformation akin to structure V. Higher modulation depth distribution center value for rra-P3HT on BNNT-3 nanotubes as compared with that for BNNT-2 nanotubes, 0.70 versus 0.64, indicates higher conformational order of rra-P3HT on BNNT-3. Therefore, the photo-luminescence modulation depth analysis is consistent with our prior assessment of BNNT-3 as being of higher quality between the two materials14 because nanotubes with less defective walls and fewer nanoscale impurities attached to the nanotube walls allow for planarization of polymer chains with greater conjugation length and, consequently, rra-P3HT aggregation with higher conformational order. The effect of conjugation length on polymer aggregation was studied by Traub et al.21who observed that conjugation length influences folding of polymers composed of conjugated phenyleneviny-lene (PPV) oligomers joined by flexible linkers with stronger interaction between longer conjugated units leading to more ordered conformations. They reported the mean single-molecule modulation depth value for tetraethylene glycol linked polymers with bis(2-ethylhexyl)-p-phenylenevinylene (BEH-PPV) chromophores of seven repeat units equal to 0.75, but only 0.39 for a similar polymer with three repeat units, which indicated a more disordered morphology of the latter. Larger normalized fraction of the nanotube component of the P3HT/BNNT-3 distribution as compared with that for rra-P3HT/BNNT-2, 78% versus 60%, respectively, indicates higher nanotube content (i.e., purity), or more precisely, larger available nanotube surface area in BNNT-3, again complementing our previous assessment of superior BNNT-3
quality.14 Because Park et al.22 have demonstrated that polymer modulation depth values may decrease as excitation intensity increases because of intensity-dependent fluorescence quenching, all our PEFM images were acquired with weak excitation (<40 W/cm2).
Single-molecule modulation depth value distributions for both regioregular and regiorandom P3HT embedded in a poly(methyl methacrylate) matrix were studied by Adachi et al.23 The M values observed in our work for rra-P3HT on boron nitride nanotubes resemble the distribution they observed for single-chain rr-P3HT molecules; however, for single-chain rra-P3HT molecules, they observed a broad distribution spanning the entire 0−1 range. Therefore, we claim that the high modulation depth values observed in our work for rra-P3HT on BNNT result from very strong π−π and electrostatic interaction between the polymer backbone and the nanotube13that can overcome steric repulsion of randomly distributed and oriented hexyl chains and induce ordered aggregation of rra-P3HT.
It should be pointed out that the normalized fraction coefficients represent nanotube/impurity basis function contribution and should not be interpreted as actual nanotube and impurity contents. However, for materials of similar morphology, the fraction coefficients can be used as a relative measure of BNNT material purity (fraction of nanotubes in the material) provided the same sample processing, imaging, and data analysis protocols were followed.
The PEFM images analyzed in this work were recorded at 240× magnification to facilitate correlation with AFM images. We also recorded sets of PEFM images at 150× magnification and conducted preliminary analyses to verify that the lower magnification was sufficient to differentiate between nanotubes and impurities based on modulation depth value distribution, although the ratio of the two components was somewhat different than that for 240× sets of images. Recording PEFM images at lower magnification would potentially have the advantage of allowing for measurement of a larger number of particles per image or, alternatively, reducing the area density of particles to avoid on-substrate aggregation and ensure larger particle separation. However, sets of images recorded at different magnification should not be mixed.
In summary, we have shown that a distribution of modulation depth values as an indicator of conformational order of rra-P3HT aggregated on BNNT tubular and nontubular structures can be used as an indirect descriptor of BNNT material quality. We have demonstrated using two BNNT materials purified by different methods that the modulation depth value distribution can be decomposed into two components: one corresponding to ordered rra-P3HT aggregated on nanotubes and the other to disordered rra-P3HT on impurities. The basis set of the decomposition was developed by independently differentiating nanotubes from nontubular impurities using AFM topography images. While the decomposition does not allow at this point for absolute determination of a mass fraction of impurities, it facilitates relative comparison of material purity and nanotube wall quality that can, for example, be employed to monitor production or purification methodology optimization. The methodology based on PEFM imaging demonstrated in this work validates at the single-particle level the previously demonstrated UV−vis absorption spectroscopy-based material quality assessment method14 and can be integrated in a
material development acceleration platform as an independent assessment method or to supplement the UV−vis method.
■
ASSOCIATED CONTENT*
sı Supporting InformationThe Supporting Information is available free of charge at
https://pubs.acs.org/doi/10.1021/acs.jpclett.0c01023. BNNT synthesis and purification; sample preparation; PEFM and AFM imaging and image processing and analysis; additional AFM and PEFM images (PDF)
■
AUTHOR INFORMATIONCorresponding Author
Zygmunt J. Jakubek − Metrology Research Center, National Research Council Canada, Ottawa, Ontario K1A 0R6, Canada; orcid.org/0000-0003-3307-8464; Email:zygmunt.jakubek@nrc.ca
Authors
Maohui Chen − Metrology Research Center, National Research Council Canada, Ottawa, Ontario K1A 0R6, Canada Yadienka Martinez Rubi − Security and Disruptive
Technologies Research Center, National Research Council Canada, Ottawa, Ontario K1A 0R6, Canada; orcid.org/ 0000-0002-1548-6504
Benoit Simard − Security and Disruptive Technologies Research Center, National Research Council Canada, Ottawa, Ontario K1A 0R6, Canada; orcid.org/0000-0001-6689-4308
Shan Zou − Metrology Research Center, National Research Council Canada, Ottawa, Ontario K1A 0R6, Canada;
orcid.org/0000-0002-2480-6821
Complete contact information is available at:
https://pubs.acs.org/10.1021/acs.jpclett.0c01023
Notes
The authors declare no competing financial interest.
■
ACKNOWLEDGMENTSThe authors are grateful to S. Walker and V. Gies for their assistance on BNNT purification; to K. S. Kim, M. Plunkett, and D. Ruth for the synthesis of BNNT; and to Z. Lu for technical assistance in setting up the polarized excitation fluorescence microscope.
■
REFERENCES(1) Kim, K. S.; Kingston, C. T.; Hrdina, A.; Jakubinek, M. B.; Guan, J.; Plunkett, M.; Simard, B. Hydrogen-Catalyzed, Pilot-Scale Production of Small-Diameter Boron Nitride Nanotubes and Their Macroscopic Assemblies. ACS Nano 2014, 8, 6211−6220.
(2) Lee, C. H.; Bhandari, S.; Tiwari, B.; Yapici, N.; Zhang, D.; Yap, Y. K. Boron Nitride Nanotubes: Recent Advances in Their Synthesis, Functionalization and Applications. Molecules 2016, 21, 922.
(3) Jakubinek, M. B.; Martinez-Rubi, Y.; Kim, K. S.; Jakubek, Z. J.; Homenick, C. M.; Zou, S.; Klug, D.; Ashrafi, B.; Guan, J.; Tamblyn, I.; Walker, S.; Daroszewska, M.; Kingston, C. T.; Simard, B. Develop-ment and Characterization of Commercial Boron Nitride Nanotube Product Forms. Advanced Materials - TechConnect Briefs 2017, 1, 114−117.
(4) Tiano, A. L.; Park, C.; Lee, J. W.; Luong, H. H.; Gibbons, L. J.; Chu, S.-H.; Applin, S. I.; Gnoffo, P.; Lowther, S.; Kim, H. J.; Danehy, P. M.; Inman, J. A.; Jones, S. B.; Kang, J. H.; Sauti, G.; Thibeault, S. A.; Yamakov, V.; Wise, K. E.; Su, J.; Fay, C. C. Boron Nitride Nanotube: Synthesis and Applications, Nanosensors, Biosensors, and
Info-Tech Sensors and Systems, ed. V. K. Varadan. Proc. SPIE 2014,
9060, 906006.
(5) Kim, J. H.; Pham, T. V.; Hwang, J. H.; Kim, C. S.; Kim, M. J. Boron nitride nanotubes: synthesis and applications. Nano
Con-vergence 2018, 5, 17.
(6) Cho, H.; Walker, S.; Plunkett, M.; Ruth, D.; Iannitto, R.; Martinez Rubi, Y.; Kim, K. S.; Homenick, C. M.; Brinkmann, A.; Couillard, M.; Dénommée, S.; Guan, J.; Jakubinek, M. B.; Jakubek, Z. J.; Kingston, C. T.; Simard, B. Scalable Gas-Phase Purification of Boron Nitride Nanotubes by Selective Chlorine Etching. Chem. Mater. 2020,DOI: 10.1021/acs.chemmater.0c00144.
(7) Zhi, C.; Bando, Y.; Tang, C.; Golberg, D. Boron nitride nanotubes. Mater. Sci. Eng. R Rep 2010, 70, 92−111.
(8) Chen, X.; Dmuchowski, C. M.; Park, C.; Fay, C. C.; Ke, C. Quantitative Characterization of Structural and Mechanical Properties of Boron Nitride Nanotubes in High Temperature Environments. Sci.
Rep. 2017, 7, 11388.
(9) Jakubinek, M. B.; Kim, K. S.; Homenick, C.; Kodra, O.; Walker, S.; Simard, B. Assessment of boron nitride nanotube materials using X-ray photoelectron spectroscopy. Can. J. Chem. 2019, 97, 457−464. (10) Jaffrennou, P.; Barjon, J.; Schmid, T.; Museur, L.; Kanaev, A.; Lauret, J.-S.; Zhi, C. Y.; Tang, C.; Bando, Y.; Golberg, D.; Attal-Tretout, B.; Ducastelle, F.; Loiseau, A. Near-band-edge recombina-tions in multiwalled boron nitride nanotubes: Cathodoluminescence and photoluminescence spectroscopy measurements. Phys. Rev. B:
Condens. Matter Mater. Phys. 2008, 77, 235422.
(11) Harrison, H.; Lamb, J. T.; Nowlin, K. S.; Guenthner, A. J.; Ghiassi, K. B.; Kelkar, A. D.; Alston, J. R. Quantification of hexagonal boron nitride impurities in boron nitride nanotubes via FTIR spectroscopy. Nanoscale Adv. 2019, 1, 1693−1701.
(12) Martinez-Rubi, Y.; Jakubek, Z. J.; Jakubinek, M. B.; Kim, K. S.; Cheng, F.; Couillard, M.; Kingston, C.; Simard, B. Self-Assembly and Visualization of Poly(3-hexyl-thiophene) Chain Alignment along Boron Nitride Nanotubes. J. Phys. Chem. C 2015, 119, 26605−26610. (13) Nasrabadi, A. T.; Foroutan, M. Interactions between Polymers and Single-Walled Boron Nitride Nanotubes: A Molecular Dynamics Simulation Approach. J. Phys. Chem. B 2010, 114, 15429−15436.
(14) Martinez Rubi, Y.; Jakubek, Z. J.; Chen, M.; Zou, S.; Simard, B. Quality Assessment of Bulk Boron Nitride Nanotubes for Advancing Research, Commercial and Industrial Applications. ACS Appl. Nano
Mater. 2019, 2, 2054−2063.
(15) Hu, D.; Yu, J.; Wong, K.; Bagchi, B.; Rossky, P. J.; Barbara, P. F. Collapse of stiff conjugated polymers with chemical defects into ordered, cylindrical conformations. Nature 2000, 405, 1030−1033.
(16) Jackson, N. E.; Kohlstedt, K. L.; Savoie, B. M.; Olvera de la Cruz, M.; Schatz, G. C.; Chen, L. X.; Ratner, M. A. Conformational Order in Aggregates of Conjugated Polymers. J. Am. Chem. Soc. 2015,
137, 6254−6262.
(17) Chen, P.-Y.; Rassamesard, A.; Chen, H.-L.; Chen, S.-A. Conformation and Fluorescence Property of Poly(3-hexylthiophene) Isolated Chains Studied by Single Molecule Spectroscopy: Effects of Solvent Quality and Regioregularity. Macromolecules 2013, 46, 5657− 5663.
(18) Hu, Z.; Shao, B.; Geberth, G. T.; Vanden Bout, D. A. Effects of molecular architecture on morphology and photophysics in conjugated polymers: from single molecules to bulks. Chem. Sci. 2018, 9, 1101−1111.
(19) Hu, Z.; Haws, R. T.; Fei, Z.; Boufflet, P.; Heeney, M.; Rossky, P. J.; Vanden Bout, D. A. Impact of backbone fluorination on nanoscale morphology and excitonic coupling in polythiophenes. Proc.
Natl. Acad. Sci. U. S. A. 2017, 114, 5113−5118.
(20) Augustine, J.; Cheung, T.; Gies, V.; Boughton, J.; Chen, M.; Jakubek, Z. J.; Walker, S.; Martinez-Rubi, Y.; Simard, B.; Zou, S. Assessing size-dependent cytotoxicity of boron nitride nanotubes using a novel cardiomyocyte AFM assay. Nanoscale Adv. 2019, 1, 1914−1923.
(21) Traub, M. C.; DuBay, K. H.; Ingle, S. E.; Zhu, X.; Plunkett, K. N.; Reichman, D. R.; Vanden Bout, D. A. Chromophore-Controlled The Journal of Physical Chemistry Letters pubs.acs.org/JPCL Letter
https://dx.doi.org/10.1021/acs.jpclett.0c01023
J. Phys. Chem. Lett. 2020, 11, 4179−4185
Self-Assembly of Highly Ordered Polymer Nanostructures. J. Phys.
Chem. Lett. 2013, 4, 2520−2524.
(22) Park, H.; Kwon, Y.; Kaufman, L. J. Complex Photophysical Behaviors Affect Single Conjugated Molecule Optical Anisotropy Measurements. J. Phys. Chem. C 2019, 123, 1960−1965.
(23) Adachi, T.; Brazard, J.; Ono, R. J.; Hanson, B.; Traub, M. C.; Wu, Z.-Q.; Li, Z.; Bolinger, J. C.; Ganesan, V.; Bielawski, C. W.; Vanden Bout, D. A.; Barbara, P. F. Regioregularity and Single Polythiophene Chain Conformation. J. Phys. Chem. Lett. 2011, 2, 1400−1404.