HAL Id: tel-02945362
https://tel.archives-ouvertes.fr/tel-02945362
Submitted on 22 Sep 2020
HAL is a multi-disciplinary open access
archive for the deposit and dissemination of
sci-entific research documents, whether they are
pub-lished or not. The documents may come from
teaching and research institutions in France or
abroad, or from public or private research centers.
L’archive ouverte pluridisciplinaire HAL, est
destinée au dépôt et à la diffusion de documents
scientifiques de niveau recherche, publiés ou non,
émanant des établissements d’enseignement et de
recherche français ou étrangers, des laboratoires
publics ou privés.
Study on nonlinear multi-dimensional direct laser
writing by using ultrashort high power laser
Chang-Hyun Park
To cite this version:
Chang-Hyun Park. Study on nonlinear multi-dimensional direct laser writing by using ultrashort high
power laser. Physics [physics]. Université de Bordeaux; Yonse Taehakkyo, 2020. English. �NNT :
2020BORD0046�. �tel-02945362�
THÈSE EN COTUTELLE PRÉSENTÉE
POUR OBTENIR LE GRADE DE
DOCTEUR DE L’UNIVERSITÉ DE BORDEAUX
ET DE L’UNIVERSITÉ DE YONSEI
ÉCOLE DOCTORALE DES SCIENCES PHYSIQUES ET DE L’INGÉNIEUR
SPÉCIALITÉ: LASERS, MATIÈRE ET NANOSCIENCES
Par Chang-Hyun PARK
Study on Nonlinear Multi-dimensional
Direct Laser Writing by using Ultrashort High Power Laser
Sous la direction de Lionel CANIONI et de Seung-Han PARK
Soutenue le 8 Juin 2020
Membres du jury :
M. SHIN, Dong-Soo, Professeur à l’Université de Hanyang (Président, Rapporteur)
M. JANG, Joon Ik, Professeur à l’Université de Sogang (Rapporteur)
M. PARK, Seung-Han, Professeur à l’Université de Yonsei (Co-Directeur)
M. CANIONI, Lionel, Professeur à l’Université de Bordeaux (Directeur)
M. PETIT, Yannick, Professeur à l’Université de Bordeaux (Invité)
iii
Table of Contents
Acknowledgment ... vii
감사의 글(Acknowledgment in Korean) ... ix
Abstract ... xiii
List of Figures ... xvii
List of Tables ... xxiii
Chapter 1. Introduction ... 1
1.1 Direct Laser Writing with ultrashort pulse lasers ... 1
1.2 Applications using direct laser writing ... 2
1.3 The scope of this manuscript ... 4
Chapter 2. Direct Laser Writing Experimental System ... 8
2.1 Interaction between fs pulse Laser and Materials ... 8
2.2 Silver-containing glass sample ... 10
2.2.1 General formation process for metallic cluster ... 10
2.2.2 The formation process for Silver-doped Zinc Phosphate glasses ... 11
2.2.3 Modeling for cluster formation of metallic cluster ... 14
2.2.4 Optical properties of silver containing glass ... 25
2.3 Experimental set-up: fs-Laser, AOM and SLM ... 30
2.3.1 femtosecond laser and Experimental set-up ... 30
2.3.2 Acousto-Optic Modulator ... 31
2.3.3 Spatial Light Modulator ... 32
iv
Chapter 3. 1-dimensional DLW and its spatial redistribution of Silver species 35
3.1 Introduction ... 35
3.2 Experimental Methods: used glass sample, laser irradiance, and analyses
... 36
3. 3 NSOM Results and discussion ... 38
3. 4 Simulation and result ... 41
3. 5 Conclusion ... 45
Chapter 4. 2-dimensional DLW and application ... 48
4.1 Introduction ... 48
4.2 Experimental Methods ... 50
4.2.1 Type A DLW for waveguide ... 50
4.2.2 Preparation of samples ... 53
4.2.3 Fabrication of Y-junction ... 53
4.2.4 Measurement of output and optical path difference ... 56
4.3 Result and discussion ... 57
4.3.1 Symmetric Y-junction ... 57
4.3.2 Asymmetric Y-junction ... 59
4.3.3 Modified asymmetric Y-junction ... 64
4.3.4 Near field injection with NSOM fiber tip ... 67
4.4 Conclusion ... 69
Chapter 5. 5-dimensional Optical Data Storage ... 71
v
5.1 Introduction ... 71
5.2 Experimental Methods ... 77
5.2.1 Preparation of sample ... 77
5.2.2 First parameter for expansion of dimension: orientation of ellipse... 77
5.2.3 Second parameter for expansion of dimension: Intensity of
fluorescence ... 82
5.2.4 Fluorescence calibration matrix with 16 intensity levels and 16
orientations of ellipse ... 85
5. 3 Outline of writing and reading process of optical data storage using two
additional parameters with type A DLW ... 86
5. 4 Writing process with 256 levels: 16 levels for fluorescence intensity and 16
levels for orientation of elliptical pattern ... 88
5. 5 Reading process with 256 levels: 16 levels for fluorescence intensity and
16 levels for orientation of ellipse ... 91
5. 6 Reading process with 64 levels: 8 levels for fluorescence intensity and 8
levels for orientation of ellipse ... 105
5. 7 Calculation for optical data storage density ... 114
5. 8 Conclusion ... 116
Chapter 6. Conclusion ... 119
Bibliography ... 123
Résumé ... 131
vii
Acknowledgment
As I stood at the end of the short and long Ph.D. course and looked back at the time of the past 7 years and 6 months, I seemed unable to express all my gratitude for the grace I received. I would like to take this opportunity to express my sincere gratitude.
I sincerely appreciate Prof. PARK accepting me as a disciple in 2013 and for direct and indirect teaching of human aspects, researcher attitude, member roles, and leader qualities. During my Ph.D. the teaching I learned from my professor has not only stayed at that time, but has also been exercised in society, which is driving many seniors, colleagues, and juniors, including myself, to faithfully fulfill their roles in their respective positions. I think, I have a selfish wish for him to be healthy for a long time and to continue this teaching. And it was great opportunity to collaborate with Bordeaux University in France, so I could take a broader view of the world. I will continue to learn and learn the wisdom of life I learned during my master's and doctorate degrees and do my best to fulfill my role as a person.
Starting a co-degree in France, there were many difficulties, including language. I would like to thank Professor Yannick PETIT and Professor Lionel CANIONI for their help. Thank you for your consideration not only in research but also in the extent of the life of a student studying abroad. And I want to thank Professor Inka of SLAM, Professor Bruno, Arthur, Wende, Alain, Delphine, Julian, Laura, Joyce, Sophie and Theo, Thierry of ICMCB for filling up life in Bordeaux. Experiences in Bordeaux will be an unforgettable memory for me.
I also thank my seniors, colleagues, and juniors who have been the most precious and supportive people I've ever met in the lab. We were able to rely on each other at a time when we were wandering about the future, and we were greatly helped by a lot of learning.
viii
I would like to my sincere gratitude to Jae-hyuk KIM, Ga-young KIM, Dae-gyu KIM, Eung-jang LEE, Eun-hee JUNG, Kyung-seok KIM, Jin-myeong MOK, Hong-gyu AHN, Bo-ram KIM, and Sung-ho LEE. During my master's and doctoral programs, my seniors' appearances and roles became a standard for me in order to be a decent junior and a better senior. And I also thank Daeyeon KIM and Young Eun LEE who are my 13th graders. The time I shared with you in Anam and Sinchon was a big help to me. And I'd like to thank Yu-mi JUNG, Young-min KEE, Beom-jun JANG, Si-young NO, Jong-hyun PARK, Gyu-ri BAE, Sang-min LEE, Seong-hyun JEON, Seung-hyun LEE, Woo-young JUNG, Seok-hyun KIM, Joo-eon PARK, Jeong-gu JI, In-joon SEO, Beom-jin KIM, Sang-mook LEE, Young-hwan CHOI, Byeong-yun HAN, Jeong-Woo KIM, Dong-wook SHIN, Jun-hyeong KIM, Chan-su AHN, Ha-rim JEONG, Seong-jae JIN, Yeong-hwan JIN. And I thank Sung-hee HWANG, Sun-young LEE, Eun-ji IM, and Hye-sun LEE for always helping us and taking care of us.
Lastly, I want to thank my parents and younger brothers for unsparing support and encouragement during my university life. Although there were ordeals and difficulties, both big and small, I was able to finish my degree safely thanks to constant faith and encouragement.
In order to reciprocate the grace and faith I have received, I will try to do my best as a disciple, junior, fellow, senior, and family. Again, I express my great gratitude.
ix
감사의 글(Acknowledgment in Korean)
짧고도 길었던 박사과정의 마무리에 우두커니 서서 지난 7년 6개월의 시간을 무심히 돌이켜 보니, 제가 받은 은혜에 대해 감사함을 모두 표현하지 못한 것 같습니다. 이 기회를 빌려 진심 어린 감사함을 표현하고자 합니다. 2013년 저를 제자로 받아주시고, 인간적인 면, 연구자의 자세, 구성원의 역할, 리더의 자질 등을 직ㆍ간접적으로 가르쳐 주신 박승한 교수님께 가장 먼저 감사의 말씀을 전합니다. 연구실 생활을 하는 동안 교수님께 배운 가르침이 그 시간에만 머물지 않고 사회에서도 발휘되어, 저를 포함한 많은 선배님, 동료들, 후배들이 각자의 위치에서 훌륭히 본인의 역할을 충실히 해내는 원동력이 되고 있다 생각합니다. 부디 오랫동안 건강하시어 이러한 가르침이 지속되었으면 하는 이기적인 바램을 가져봅니다. 또한 저게 프랑스의 보르도 대학과 공동학위를 할 수 있는 기회를 주셔서, 제가 세상을 좀 더 넓게 볼 수 있는 계기가 될 수 있었습니다. 석ㆍ박사 학위 기간 동안 배운 삶의 지혜를 꾸준히 익히고 체득하여 한 사람으로써의 몫을 다 할 수 있도록 최선을 다하는 모습을 보여드리겠습니다. 프랑스에서 공동학위를 시작하며 언어를 포함한 어려운 점이 많았습니다. 이에 본인의 일처럼 도와준 Yannick PETIT 교수님과 Lionel CANIONI 교수님께 감사의 말씀을 전합니다. 또한 연구뿐만 아니라 유학생의 삶의 영위하는 범위에서도 섬세한 배려해 주셔서 감사합니다. 그리고 보르도에서의 삶을 더욱 풍성하게 채워준 SLAM의 Inka 교수님, Bruno 교수님, Arthur, Wende, Alain, Delphine, Julian, Laura, Joyce,x
Sophie 그리고 ICMCB의 Theo, Thierry 교수님께 감사한 마음을 전합니다. 보르도에서의 생활은 제게 잊지 못할 소중한 기억이 될 것입니다. 또한 연구실에서 만난 가장 소중하고 힘이 되어준 여러 선배님, 동기, 그리고 후배들에게 감사함을 전합니다. 미래에 대한 불안과 고민으로 방황을 하던 시기에 만나 서로 의지할 수 있었고, 많은 배움으로 큰 도움을 받았습니다. 김재혁, 김가영, 김대규, 이응장, 정은희, 김경석, 목진명, 안홍규, 김보람, 이성호 선배님들께 감사한 마음을 전합니다. 연구실에서 가장 저학기였던 제가 졸업을 앞 둔 최고 학기가 되는 동안, 부끄럽지 않은 후배, 더 좋은 선배가 되기 위해 선배님들의 모습과 역할이 제게는 하나의 기준이 되었습니다. 그리고 13학번 동기인 대연이와 영은이 형에게도 감사의 마음을 전합니다. 안암과 신촌에서 나누었던 시간은 제게 큰 힘이 되었습니다. 그리고 저를 많이 도와주고 따라와준 물리학과 후배 정유미, 기영민, 장범준, 노시영, 박종현, 배규리, 이상민, 전성현, 광과학공학과 후배 이승현, 정우영, 김석현, 박주언, 지정구, 서인준, 김범진, 이상묵, 최영환, 한병윤, 김기환, 종우형, 신동욱 선임님, 정하림, 진영환, 진성재, 안찬수, 김준형에게 감사함을 전합니다. 함께 시간을 보내주어 함께 있어주어, 든든했고, 든든하고, 든든할 것입니다. 그리고 곁에서 항상 저희를 도와주시고 챙겨주신 황성희, 이선영, 임은지, 이혜선 선생님들께 감사한 마음을 전합니다. 마지막으로 15년의 긴 학생 생활을 할 수 있게 지원과 사랑을 아끼지 않으신 부모님과 응원과 격려를 해준 동생에게 감사합니다. 크고 작은 시련과 어려움이 있었지만, 끊임없는 믿음과 격려를 주신 덕분에 학위를 무사히 마칠 수 있었습니다.
xi
제가 받은 은혜와 믿음에 보답하기 위해 제자로, 후배로, 동료로, 선배로, 가족으로써 도리를 다 할 수 있도록 노력하겠습니다. 다시 한 번 큰 감사한 마음을 표현합니다.
xiii
Abstract
In the past 30 years as the pulse width of lasers has been narrowed and high-power lasers have been developed, researches on the interaction between photon and materials using femtosecond lasers have been actively conducted. The high energy density of femtosecond pulsed lasers enables nonlinear photoionization processes in several ways. This paper reports a study of a type Argentum direct laser writing in silver containing zinc phosphate glasses by inducing a nonlinear absorption deformation of femtosecond laser pulses. When silver-containing zinc phosphate glasses are irradiated with femtosecond laser pulses, ring-shaped clusters are formed due to non-linear absorption. The fluorescence properties and the refractive index of the silver cluster induced by this deformation are different from those of the original zinc phosphate glass.
Simultaneous comparisons of chemical micro probes, near-field scanning optical microscopy (NSOM), and numerical modeling were used to analyze the laser-induced silver species distribution. The results significantly strengthen the understanding of material modifications in such glasses in a non-thermal interaction regime. In particular, it has been found that the spatial distribution of species in silver-containing glasses produced by femtosecond laser irradiation has a significant effect on chemical etching selectivity.
The Y-shaped beam splitters, 2D structures made by using type A DLW, was fabricated and its performance was measured. It was confirmed that a waveguide of a general shape in which the refractive index of the core is larger than that of cladding can be produced by using a type A DLW. Since the type A DLW always induces positive refractive index changes
xiv
from 2.7x10⁻³ to 5.1x10⁻³, it is very suitable for making waveguide. A symmetric Y-junction
and various asymmetric Y-junctions were also designed and fabricated using double line waveguides. Their output ratios were measured according to the transition of the inject position. It was confirmed that the output ratio could be varied from 96%-4% to 57%-43% due to the different irradiance in the process of writing between the upper branch and lower branch. So DLW in silver containing zinc phosphate glasses can be utilized easily and quickly to fabricate the desired type of optical device with only the writing process.
Finally, the scope of application was further expanded by investigating 5D optical data storage (ODS) using type A DLW. We have demonstrated 5D optical data storage encoded in orientated type A DLW modifications by using a relatively low laser irradiance compared to conventional DLW. Five dimensions were achieved by adding the orientation of ellipse pattern and fluorescence intensity to 3D position. The ellipse pattern was created by anamorphic focusing, and the orientation was adjusted to 16 levels by employing SLM. In addition, AOM device was used to adjust the femtosecond laser intensity of 16 levels.
To confirm the possibility of the proposed 5D ODS, two different images were simultaneously embedded simultaneously in one image by type A DLW. And it was demonstrated that the two different original images of 4-bit bitmap format were successfully restored. The corresponding reading fidelities of 60.5% and 25.1% were obtained for the orientation direction and fluorescence intensity levels, respectively. In addition, it is shown that the reading accuracy can be greatly improved to 85.0% and 47.1% when 3-bit bitmap format was applied. Using the proposed this technology, we showed a maximum data
xv
density of 14.9 Gb/cm3 can be achieved, and it can reach up to 119.2 Gb/cm3 (using NA =
1.3 oil target).
In conclusion, the fluorescence characteristics of type A DLW in silver containing zinc phosphate glasses were studied, and its utility as a multi-dimension application was confirmed. We believe this technology has great potential for nano-scale patterning in semiconductor and fabrication of micro-scale optical devices.
Key words: Direct Laser Writing (DLW), Femtosecond Laser, Type A DLW, Waveguide, 5D Optical Data Storage (ODS), Laser Patterning, and Laser Lithography
xvii
List of Figures
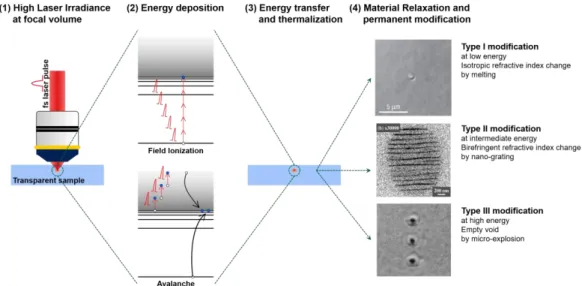
Figure 1. Various applications using direct laser writing ... 4 Figure 2 Time scale of the interaction between photon and material [28] ... 9 Figure 3 The process and results of interaction of fs laser pulse and transparent materials : (1) high laser irradiance at focal volume in transparent material; (2) process of energy deposition by multiphoton absorption and avalanche ionization; (3) process of energy transfer and thermalization; (4) result of material relaxation and permanent modification by melting, nano-grating, and micro-explosion [29]. ... 10 Figure 4 The process for formation of laser-induced ring shape cluster within the
silver-doped phosphate glasses [38] ... 14 Figure 5 Classification of modifications according to laser flux and types of refractive index change [41] ... 25 Figure 6 Configurations of type argentum modification with stationary focus (a) and in the same plane (g). Fluorescence images of writing pattern in the front and side view (b, e). Images obtained by High Reflection Scanning Electron Microscopy(HRSEM) (c, f). [42] ... 26 Figure 7 Comparison of refractive index changes between type I and type A [41] ... 27 Figure 8 Fluorescence properties of silver-containing phosphate glass (a) Fluorescence image of structures engraved on glasses sample with three different chemical composition, (b) Fluorescence intensity according to writing velocity, (c) Spectrum distribution of emitted light when excited with a laser of 405 nm wavelength [28]. 28 Figure 9 Refractive index change for laser irradiance and number of pulses; (a) matrix of structures for 2 parameter changes; (b) Image showing optical path difference for one structure; (c) Graph showing refractive index change for two parameters change [43] ... 29 Figure 10 Experimental Setup Schematic for Direct Laser Writing; fs laser, Acousto-Optic Modulator, Spatial Light Modulator, and XYZ stage... 30 Figure 11 Graph showing the relationship between voltage to both fused silica and laser power at m=0 order ... 31
xviii
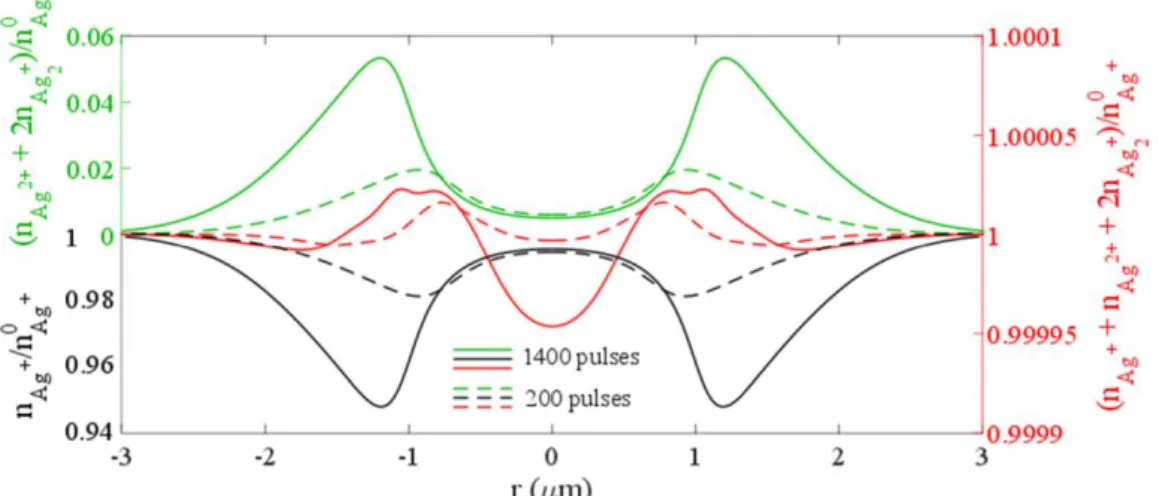
Figure 12 IGOR Program, which is designed to control SLM mask, enables several modes of focusing and precisely adjust the positioning of the laser beam. ... 33 Figure 13 (a) White light image of 1D DLW patters sample after etching process; (b, c) Images obtained by CMOS camera after injection of 405 nm and 632.8 nm laser beam with objective lens. ... 37 Figure 14 Experimental set-up of Near-field Scanning Optical Microscope in illumination mode, with light injection from a tapered optical fiber probe tip (100 nm aperture). 2 laser sources, objective lenses (focusing (20x, 0.40NA) and imaging (40x, 0.60NA)), long pass filter, and single channel photomultiplier detector (PMT). ... 38 Figure 15 (a, d) Image of surface topology obtained from NSOM in illumination mode; (b, e) Image of near field optical signal obtained by NSOM when the silver species are excited by 405 nm laser diode and 632.8 nm He-Ne laser; (c, f) Associated line profiles through center of ring-shape silver cluster ... 39 Figure 16 Numerical modeling of the laser-induced redistribution of silver species (8.8 TW/cm2, Npulse = 200 or 1400), showing the profiles of the silver ions (black line), the
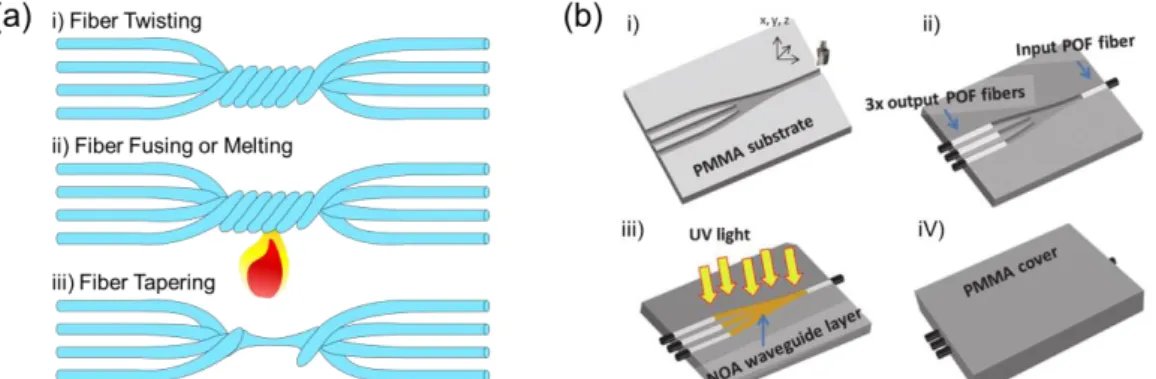
induced silver cluster and hole centers (green line), and all of silver species (red line). ... 42 Figure 17 (a) Experimental topological profile (blue curve) and simulated etching-induced topological profile (red curve) adjusted by optimizing the normalized etching rate distribution (green curve). (b) Silver element distribution by micro-probe measurement (blue curve, from [9]) and NSOM measurement (red curve, from Figure 16 (d)) with respect to the optimized normalized etching rate distribution (green curve). ... 44 Figure 18. Fabrication of optical splitter/coupler. (a) The fused biconical taper process with optical fiber; (b) The fabrication process of the optical beam splitters by casting method ... 49 Figure 19. Schematic for optical device fabrication through Direct Laser Writing (DLW) ...
... 49 Figure 20. (a) Schematic image showing 2D structure fabrication with type A modification; (b) Top and side view of fabricated 2D structure [38] ... 51 Figure 21. (a) Type I waveguide and (b) type A waveguide. (1) The image of Top/Side view of DLW pattern for both type. Various Optical path differences profiles for two types as a function of (2) laser pulse energy and (3) writing speed. ... 52 Figure 22. Experimental/theoretical relationships between (a) the radius of Ag2+ ring
xix
number of pulses/laser irradiance ... 53 Figure 23. Structure schematic of Y-junction.; lt: total length of Y-junction, l1: The length from
the input to the point where it is divided into two branches, l2, l3: Length of curved part
with curvature of 150mm, and l4: Length from the end of the curve to the output .. 55
Figure 24. Experimental setup to measure the output of the Y-junction ... 56 Figure 25. Output image and profile line of symmetric Y-junction ... 57 Figure 26. (a) A white light image of the input of a waveguide made of Type A DLW; (b) the relationship between injection position with 200 nm interval and total power; (c) variation of output ratio for injection position ... 59 Figure 27. Shape of asymmetric Y-junction and applied irradiance for each branch ... 60 Figure 28. (a) Changes of output ratios of lower branch according to injection position for different asymmetric Y-junctions; (b) Output profiles and output ratios for one symmetric and four asymmetric beam splitter, when injection position = 0 ... 61 Figure 29. Index changes and profiles for one symmetric junction and four asymmetric
Y-junctions ... 63 Figure 30. Shape of modified asymmetric Y-junction and applied irradiance for each branch.
... 64 Figure 31. (a) Changes of output ratios of lower branch according to injection position for four modified asymmetric Y-junctions; (b) Output profiles and output ratios for four modified asymmetric beam splitter, when injection position = 0 ... 66 Figure 32. (a) Schematic showing beam injection into waveguide using NSOM probe tip; (b, c) output ratio result when the objective lens and the NSOM probe tip is used to put incident beam in the symmetric Y-junction; (d, e) output ratio result when the objective lens and the NSOM probe tip is used to put incident beam in the asymmetric Y-junction. ... 68 Figure 33. Historical evolution of the information recording in human society... 71 Figure 34 Comparison of features of four ODS mediums; CD, DVD, HD DVD, and Blu-ray
... 72 Figure 35. (a) Holographic Versatile Disc(HVD); (b) Schematic showing how HVD uses two laser beams to store information; (c) Digital Multilayer Disk(DMD); (d) Cross section of DMD layers recorded in a 3D disc ... 73
xx
Figure 36. Experimental results of Min Gu's group using different wavelength laser beam and polarization ... 74 Figure 37. Experimental results from Kazansky's group implementing 5 dimensional ODS by adding orientation of nano-gratings and retardance by using type II type DLW 75 Figure 38. Femtosecond laser tightly focused in the silver containing glass, resulting in subsequent production of fluorescent silver clusters at its periphery. ... 78 Figure 39. Variation of SLM mask and DLW patterns according to the manipulation of coefficient of tangential focusing ... 79 Figure 40. Variations of eccentricity(a) and fluorescence intensity(b) of ellipse-shape DLW pattern according to tangential focusing coefficient ... 80 Figure 41. Images of orientation change of elliptical patterns obtained by SLM phase mask manipulation, corresponding to 24 = 16 orientation-encoded digital levels. ... 81
Figure 42. Fluorescent silver cluster distributions for several depths with respect to the tangential focal plane, respectively corresponding to circular or elliptical fluorescent shapes (confocal microscope imaging (20x, NA = 0.75) with excitation at 405 nm), for symmetrical or anamorphic focusing conditions. ... 82 Figure 43. Fluorescence intensity change(a) and retrieving result of ellipse orientation(b) according to voltage applied to AOM ... 83 Figure 44. Relation between intensity level and fluorescence intensity (a, c) when voltage intervals from 0.6V to 0.8V are divided equally and (b, d) When optimized by dividing fluorescence intensity interval equally ... 84 Figure 45. Measured fluorescence intensity versus incident laser irradiance, to calibrate the 5D decoding process. The inset image shows a fabricated matrix with 16 intensity levels and 16 orientations in the silver-containing glass. ... 86 Figure 46. Flow map showing how intensity part and orientation part are utilized in writing/reading process of 5D optical data storage ... 88 Figure 47. (a) and (b) are the original images of two Nobel laureates encoded in 16
grey-scale levels; (c) is the DLW entangled image by independently addressing the 16 orientation levels of (a) and the 16 irradiance levels of (b); (d) Fluorescence calibration matrix observed by confocal microscopy to retrieve intensity-orientation correlations and to provide the dedicated correction for subsequent fluorescence intensity reading (excitation at 405 nm). ... 90
xxi
Figure 48. (a) Retrieved image from the initial image in Figure 47(a); (b) Retrieved image from the initial image in Figure 47(b); (c) Level difference between Figure 47(a) and 16(a); (d) Level difference between Figure 47(b) and 16(b); (e) Histogram of the level difference between original and decoded levels for the orientation direction; (f) Histogram of the level difference between original and decoded levels for the fluorescence intensity. ... 94 Figure 49. Histogram of retrieving results for each orientation level of orientation decoding; 0°, 11.25°, 22.5°, and 33.75° ... 96 Figure 50. Histogram of retrieving results for each orientation level of orientation decoding; 45°, 56.25°, 67.5°, and 78.75° ... 97 Figure 51. Histogram of retrieving results for each orientation level of orientation decoding; 90°, 101.25°, 112.5°, and 123.75° ... 98 Figure 52. Histogram of retrieving results for each orientation level of orientation decoding; 135°, 146.25°, 157.5°, and 168.75° ... 99 Figure 53. Histogram of retrieving results for each intensity level of intensity decoding; 1, 2, 3, and 4 ... 101 Figure 54. Histogram of retrieving results for each intensity level of intensity decoding; 5, 6, 7, and 8 ... 102 Figure 55. Histogram of retrieving results for each intensity level of intensity decoding; 9, 10, 11, and 12 ... 103 Figure 56. Histogram of retrieving results for each intensity level of intensity decoding; 13, 14, 15, and 16 ... 104 Figure 57. (a) Retrieved image from the initial image in Figure 47(a); (b) Retrieved image from the initial image in Figure 47(b); (c) Level difference between Figure 47(a) and 25(a); (d) Level difference between Figure 47(b) and 25(b); (e) Histogram of the level difference between original and decoded levels for the orientation direction; (f) Histogram of the level difference between original and decoded levels for the fluorescence intensity. ... 106 Figure 58. Histogram of retrieving results for each orientation level of orientation downgrade-decoding; 0°, 22.5°, 45°, and 67.5° ... 109 Figure 59. Histogram of retrieving results for each orientation level of orientation downgrade-decoding; 90°, 112.5°, 135°, and 157.5° ... 110 Figure 60. Histogram of retrieving results for each intensity level of intensity
downgrade-decoding; 1, 2, 3, and 4 ... 112 Figure 61. Histogram of retrieving results for each intensity level of intensity
downgrade-decoding; 5, 6, 7, and 8 ... 113 Figure 62. (a) An image of unit pattern fabricated by using type A DLW; (b) the profile of
xxii
fluorescence intensity along the y-axis (short axis of ellipse); (c) the profile of fluorescence intensity along the x-axis (long axis of ellipse); (d) the profile of fluorescence intensity and Gaussian fitting along the z-axis(depth) at z = 0 focal plane ... 114 Figure 63. Royon's experimental data written at 20 um intervals between layers to overcome crosstalk [76]. ... 115
xxiii
List of Tables
Table 1 The SLM mask which control the phase of laser beam and the DLW patterns in the silver containing glass for different modes of focusing. ... 33 Table 2. The relation between voltage applied to the AOM and Irradiance in the focal plane of an objective lens ... 54 Table 3. Refractive index change and thickness of double line according to the laser irradiance. ... 62 Table 4. Fidelity results calculated from orientation decoding by ODS unit pattern; the bit errors for ΔO=0, ΔO=±1, and ΔO=0, ±1. ... 95 Table 5. Fidelity results calculated from intensity decoding by ODS unit pattern; the bit errors for ΔI=0, ΔI=±1, and ΔI=0, ±1. ... 100 Table 6. Summary of the writing/reading accuracy ... 107 Table 7. Fidelity results calculated from orientation downgrade-decoding by ODS unit pattern; the bit errors for ΔO’=0, ΔO’=±1, and ΔO’=0, ±1. ... 108 Table 8. Fidelity results calculated from intensity downgrade-decoding by ODS unit pattern; the bit errors for ΔI’=0, ΔI’=±1, and ΔI’=0, ±1... 111
1
Chapter 1. Introduction
1.1 Direct Laser Writing with ultrashort pulse lasers
During the active research and development of lasers in the 1960s and 1970s, many experiments were conducted on the interaction between photons and materials. In 1978, Hill K.O. measured the UV radiation damage and the changes of refractive index by irradiating a continuous wave gas laser beam onto Ge-doped silica glass [1]. And using these characteristics, optical devices were fabricated on fibers and thin films. At this time, laser damage caused by visible laser and IR laser induced only a linear effect with low photon energy, which received little attention.
After the development of high energy density femtosecond pulse laser, Hirao et al. induced modifications inside silica and Ge-doped silica glass by using a femtosecond laser of 120 fs, 200 kHz, and 810 nm, and measured an increase in refractive index from 0.01 to 0.035 in 1996 [2]. The femtosecond pulse laser provided a solution to overcome the low photon energy of visible and NIR laser.
The high energy density of femtosecond pulsed lasers enables the nonlinear photoionization processes provide high energy sufficient for the valence electrons to move into the conduction band by following three different ways depending on the intensity and repetition rate of the laser [3,4], (i) Multiphoton ionization, (ii) tunneling ionization, and (iii)
2
avalanche ionization. A few picoseconds after, the laser excited electrons transfer their energy to the lattice, resulting in permanent material deformation. Due to these complex mechanism, femtosecond laser microfabrication can be applied to a wide range of materials.
1.2 Applications using direct laser writing
The peak power of the fs laser beam is high, but the average fluence is relatively low, so it is more studied in laser processing of dielectric materials, polymers, and transparent glasses than laser processing of metals. Although the peak power of the fs laser beam is high, the average power is lower than continuous wave lasers, femtosecond lasers are more used for laser processing of dielectric materials, polymers, and transparent glasses than laser processing of metals, as shown in Figure 1.
Various optics including lens systems, micro resonators, and color filters for IR sensors are designed and manufactured with direct laser writing using ultra-short pulse lasers. In 1994, Michael T. Gale et al. produced continuous-relief micro optical elements (Fresnel microlenses, microlens array, kinoforms, and other continuous-relief phase elements) in photoresists by using CW HeCd laser [5]. He designed, manufactured and measured Fresnel lens with a diameter of 5 mm and a focal length of 10 mm (0.24 N.A.). Micro-lens having a diameter of 30 um up to 1 cm were also fabricated. The fabrication of the optical elements implemented in this paper requires several post-processing steps after direct
3
laser writing. Timo Gissibl et al. produced an ultracompact multi-lens objective by using two photon direct laser writing with 3D printing technology in 2016 [6]. He designed and fabricated singlet, doublet, and triplet with a height of about 115 um and a focal length of 68.3 um on a 170 um thick glass substrate. Naoto Tsutsumi et al. fabricated 3D microstructures and micro-lens arrays using negative photoresist SU-8 with a femtosecond Ti:sapphire pulse laser [7]. Piotr Wasylczyk et al. manufactured transmission phase gratings that serve as color filters in the visible [8]. By focusing the femtosecond laser pulse to the photoresist, each simple diffraction structure had the structure of a regular grid of pillars, and transmission of each grid has a wavelength dependency. In his paper, one basic unit was manufactured with a width of 450 nm and a height of 1.0 um to 2.4 um, which is important factor to determine the wavelength of transmission. Heming Wei et al. designed and produced a sensitive refractometric polymer micro-resonator sensor [9].
Direct laser writing is widely used not only for optics elements, but also for electronics in graphene/metal doped thin films [10–15], lithography [16–18], and micro 3-dimension printers [19,20]. In particular, Joachim Fischer, Min Gu, and Benjamin Harke brought the concept of stimulated emission depletion (STED) fluorescence microscopy to reduce the size of voxels modified by direct laser writing [16,17,21]. Although it has different characteristics depending on the medium, in both experiments, structures of less than 100 nm were fabricated.
4
Figure 1. Various applications using direct laser writing
1.3 The scope of this manuscript
In this paper, a new type of direct laser writing in silver-doped zinc phosphate glasses by using femtosecond pulse laser is introduced. And the properties and multidimensional applications of type Argentum DLW are reported.
5
In chapter 2, the modeling for cluster formation of metallic cluster in silver-containing glass due to femtosecond laser pulses is covered which explains the morphology of silver clusters and distribution of metal species. And this chapter details the experimental set-up used in this paper and the main role of each part.
In chapter 3, based on near-field scanning optical microscopy (NSOM) images, chemical micro-probe analysis, spatial profile after soft etching, and numerical simulations of the silver species redistribution, the fs laser-induced spatial redistribution of silver species of our photosensitive silver-containing phosphate glasses is described correlatively.
Chapter 4 introduces the two-dimensional waveguides fabricated by Type A modifications. In particular, studies on the fabrication, performance and properties of symmetrical junctions and asymmetrical junctions are included. Asymmetric Y-junctions were fabricated by carving the two branches with different irradiance and the output ratios were measured. And it shows interesting results that can be used as an asymmetric splitter.
In Chapter 5, five-dimensional (5D) data storage has been investigated by using type A direct laser writing. A data storage unit of ellipse pattern, produced by anamorphic focusing of femtosecond laser, has been proposed to demonstrate 5D data storage (3D for XYZ, 1D for orientation of ellipse and 1D for fluorescence intensity. In the writing process, two different images of 4-bit bitmap format were embedded in one single image by combining both ellipse pattern orientation and laser irradiance. In the reading process, the two merged original images were successfully decoded by comparing each data storage
6
unit with a calibration matrix and restoring the levels of ellipse orientation and fluorescence intensity simultaneously.
8
Chapter 2. Direct Laser Writing Experimental System
2.1 Interaction between fs pulse Laser and Materials
Since the development of dye lasers in the mid-1980s, fs lasers have been used in a variety of applications including ablation (drilling, cutting, marking), Photo-Lithography, Direct Laser Writing(DLW) , and micro 3D printing recently [22–25]. Ultra-short pulse laser is being developed continuously because the smaller the time scale of laser pulse, the more interaction between photon and material can be studied. For example, an ultrashort pulse laser is required for the mechanical study of molecular switching, the synthesis and decomposition of materials made by photosynthesis of plants, and the process of restoring perturbation due to photoelectric effect [26,27].
The interaction of photon and material depends on the type of material, lattice structure and energy exchange mechanism. Generally, some materials are known to have a process as shown in Figure 2. First, when the energy of photon is transferred to the material due to laser irradiance, multiphoton absorption and ionization proceed in the material. The energy transferred to the electron after the first step due to energy deposition is transferred into the molecules of the material and the vibration of the lattice, or phonon. After that, the perturbation caused by the photon enters into the process of relaxation to the energy equilibrium state. This process returns to equilibrium by heat diffusion, explosion, chemical reactivity, etc. We can induce material modification by irradiance of femtosecond laser
9
pulses and subsequent series of photo-material interactions before local material relaxation occurs.
Figure 2 Time scale of the interaction between photon and material [28]
In addition to the irradiance parameters of the laser, modifications induced by pulse laser can be classified into three types according to morphological changes [29]: (1) type I modification: smooth refractive index change, (2) type II modification: birefringent refractive index modification, (3) type III modification: micro-explosions leading to empty voids. Type I modifications are relatively weak energy and induce smooth and isotropic refractive index changes in the focal volume of the laser. Type II modification is induced when a slightly higher energy laser pulse is irradiated on bulk of fused silica glass. The interference of the laser field and the induced electron plasma wave inscribe a writing pattern in the form of periodic nano-grating, which induces a birefringent refractive index change. Finally, type III modification is induced by the highest energy laser pulses, which leaves a writing pattern of low density or hollow core at the core by micro-explosion in focal volume. Figure 3 shows the sequence of steps and the writing patterns for the three types.
10
Figure 3 The process and results of interaction of fs laser pulse and transparent materials : (1) high laser irradiance at focal volume in transparent material; (2) process of
energy deposition by multiphoton absorption and avalanche ionization; (3) process of energy transfer and thermalization; (4) result of material relaxation and permanent
modification by melting, nano-grating, and micro-explosion [29].
2.2 Silver-containing glass sample
2.2.1 General formation process for metallic cluster
After DLW on a photosensitive glass sample doped with a Nobel metal (i.e. Cu, Au, Ag), the nucleation of the metallic ions and further cluster are created induced under appropriate reduction-oxidation conditions [30]. This glass sample also interacts with the laser pulse through above process shown in Figure 2. In the first step, ionization of the
11
glass occurs while the fs laser pulse is irradiated. The free electrons are then diffused and trapped in the holes, the glassy network, and the doped metal ions [31]. At the same time, free electrons absorb the laser's photon energy and transfer energy to the lattice. The temperature rises from the subsequent pulse train, and the diffusion of metallic species is thermally activated. This leads to the continuous kinetic reaction and clusters of metallic ions begin to form. The cumulative fs pulse causes photo-dissociation to occur in the center of the focal volume, leaving only the metallic cluster at the periphery of beam waist. At the edge of the beam, it is not enough energy to reach photo-dissociation, but it satisfies the conditions which ionization and reduction-oxidation processes occur. The laser-induced redistribution of metallic species causes a forced charge separation inside the glass, forming a static electric field, E⃑⃑ dc. These static electric fields inside the glass bring nonlinear
properties. In particular, the second harmonic generation is derived by providing a second-order susceptibility which was zero before the formation of metallic cluster [32].
2.2.2 The formation process for Silver-doped Zinc Phosphate
glasses
The glass sample used in this experiment was silver containing optical glass based on zinc phosphate glasses. This glass sample is developed and researched by Institut de Chimie de la Matière Condensée de Bordeaux (ICMCB), and its photo-sensitivity, fluorescence property, and spectroscopic are different depending on the chemical composition ratio. The produced glass samples were used for direct laser writing in the
12
Short pulse Lasers Applications and Materials (SLAM) lab at Centre Lasers Intenses et Applications (CELIA).
The silver-ions doped glasses used in this experiment also apply to the cluster formation process of the noble metal described above. Figure 4 shows the process of silver cluster described above, which has ring shape. In the first step, when the fs-laser pulse is irradiated on the silver-containing glass, free electrons are generated as shown in the yellow zone of Figure 4 (a). The generated free electrons form Ag0 by kinetic reaction with
silver ions. Ag0∶ Ag++ e−→ Ag0 At the same time, Ag2+ is generated by a hole trapped in
Ag+. Ag2+∶ Ag++ h+→ Ag2+ However, Ag2+ generated at this time has limited mobility by
surrounding phosphate chains. So it’s mobility is negligibly low compared to that of Ag+.
The reaction to generate Ag0 continues until the concentration of free electrons disappears.
At this time, the distribution of Ag0 and Ag2+ is located in the center of the beam as shown
in green circle in Figure 4 (a).
As shown in Figure 4 (b), the area where Ag0 exists is diffused, and the green circle is
slightly enlarged. As absorbed laser pulse energy is transferred to lattice and molecular, heat diffusion occurs as shown in blue circle of Figure 4 (b) by raising temperature in focal volume. Ag0 ions activated by temperature encounter Ag+ ions, which causes formation of
Ag2+ as shown in Figure 4 (b) red circle. Ag2+∶ Ag0+ Ag+→ Ag2+ This reaction finishes
when Ag0 is destroyed. Then Ag2+ will be distributed in clusters as shown in red circle in
Figure 4 (c).
The sequence of above steps is fast-paced and already terminates before the next pulse, causing all Ag0, e- and h+ to disappear. The next pulse brings photo-dissociation,
13
which begins to destroy the already formed Ag2+ cluster. This dissociation only occurs at
the center where there is sufficient energy, and the silver clusters continue to accumulate in the periphery of the beam. After this series of processes has been repeated, only the ring-shaped cluster is left inside the glass as shown in Figure 4 (d) [33,34]. This Ag2+ cluster
has a high durability and remains almost permanent engraved inside the glass sample [35]. The associated space charge separation in glass produces a static electric field E⃑⃑ dc
as shown in Figure 4 (d) black arrows. In the silver containing glasses, the laser induced-static electric field has high value up to 109 V/m, which almost reaches to the electrical
breakdown of material. And this allows an effective second order nonlinearity has follow value. χeff(2)= 3Edcχ(3) ~ 1 pm/V [36,37]. This brings one- or two- ring shape of second
14
Figure 4 The process for formation of laser-induced ring shape cluster within the silver-doped phosphate glasses [38]
2.2.3 Modeling for cluster formation of metallic cluster
The cluster formation process of the metallic ions can be expressed by the following general modeling equation. Evolution of temperature T, electron concentration ne, hole
concentration nh, and concentration of metallic species nM, static electric field induced by
15 𝜕𝑇 𝜕𝑡 = 𝛤𝐷 𝑡ℎ+ 𝑆𝑡ℎ Equation 1 ∂ne ∂t = ΓD(T, ne) + ΓM(T, ne, E⃑⃑ dc) + ΓK(ne, nh, nM) + ΓI+ ΓDiss(nM) Equation 2 𝜕𝑛ℎ 𝜕𝑡 = ΓK(ne, nh, nM) + ΓI Equation 3 ∂nM ∂t = ΓD(T, nM) + ΓM(T, nM, E⃑⃑ dc) + ΓK(nM, ne, nh) ± ΓDiss(nM) Equation 4 𝜕𝐸⃑ 𝑑𝑐 𝜕𝑡 = Q(nM, 𝑛𝑒, 𝑛ℎ) 𝜀0𝜀𝑑𝑐 Equation 5
where 𝜀0 and 𝜀𝑑𝑐 are permittivity at vacuum and dielectric material. In Equation 1,
𝛤𝐷 𝑡ℎ and 𝑆𝑡ℎ present the hear diffusion and the laser induced heat source respectively.
ΓD(T, ne) and ΓM(T, ne, E⃑⃑ dc) in Equation 2 are terms for the diffusion and the mobility. And
ΓK is term for kinetic reactions of metallic species and ΓI represent the laser induced
electron and hole source in Equation 2 and Equation 3. In Equation 3, the hole mobility term is neglected because of its relatively low impact. In Equation 4, ΓDiss(nM) represents
16
dissociate, the sign has a negative value, whereas when the cluster is formed, the sign has a positive value. Q(nM, 𝑛𝑒, 𝑛ℎ) in Equation 5 describes the self-induced electric charge
redistribution, and 𝐸⃑ 𝑑𝑐 represent the static electric field generated by ring-shape metallic
cluster.
Applying these equations to silver-doped glasses, the metallic species can be represented by the silver ion Ag+, the silver component Ag0, the doubly ionized silver ion
Ag2+, and silver cluster Ag2+. We will not consider the larger silver cluster Agmx+, m > 2. This
is because there is little mobility even if m = 2, and enough information can be obtained up to considering Ag2+. Also we suppose that the Ag+ and Ag0 have mobility, while the Ag2+ and
Ag2+ have no mobility. From these assumptions and conditions, Equation 4 can be written
as the following four equations. 𝜕𝑛𝐴𝑔+ 𝜕𝑡 = Γ𝐷(𝑇, 𝑛𝐴𝑔+) + Γ𝑀(𝑇, 𝑛𝐴𝑔+) + Γ𝐾(𝑛𝐴𝑔+, 𝑛𝑒, 𝑛ℎ, 𝑛𝐴𝑔0, 𝑛𝐴𝑔2+, 𝑛𝐴𝑔2+) + Γ𝐷𝑖𝑠𝑠(𝑛𝐴𝑔2+) Equation 6 𝜕𝑛𝐴𝑔0 𝜕𝑡 = Γ𝐷(𝑇, 𝑛𝐴𝑔0) + Γ𝐾(𝑛𝐴𝑔0, 𝑛𝑒, 𝑛ℎ, 𝑛𝐴𝑔+, 𝑛𝐴𝑔2+, 𝑛𝐴𝑔2+) Equation 7 𝜕𝑛𝐴𝑔2+ 𝜕𝑡 = Γ𝐾(𝑛𝐴𝑔2+, 𝑛𝑒, 𝑛ℎ, 𝑛𝐴𝑔+, 𝑛𝐴𝑔0) Equation 8
17
𝜕𝑛𝐴𝑔
2 +
𝜕𝑡 = Γ𝐾(𝑛𝐴𝑔+, 𝑛𝐴𝑔+, 𝑛𝐴𝑔0) − ΓDiss(𝑛𝐴𝑔2+) Equation 9
The concentration of silver species during cluster formation can be expressed by the above equations.
Absorption of laser pulse energy is mainly explained by multiphoton ionization (MPI), impact ionization, and recombination. In Equation 1 and Equation 2, the laser-induced electron and hole source is expressed as
Γ𝐼= 𝜎𝐾( 𝐼 ℏ𝜔) 𝐾 (𝑛𝑎𝑡0 − 𝑛𝑒) + 𝜎 𝐼 𝑈𝑔 𝑛𝑒− 𝑛𝑒 𝜏𝑟 Equation 10
where I(r, t, z) is the distribution of the laser intensity, experimentally Gaussian distribution. And the first term represents MPI process, the second term is written for impact ionization, and the last term corresponds to the recombination process. In Equation 10, σ is the inverse bremsstrahlung cross section, τr represents electron-hole recombination
time.
The intensity of the laser pulse decreases as follow: 𝜕𝐼 𝜕𝜁 = −𝜎𝐾( 𝐼 ℏ𝜔) 𝐾 (𝑛𝑎𝑡0 − 𝑛𝑒)𝐾ℏ𝜔 − 𝜎𝐼𝑛𝑒 Equation 11
18
where the input laser pulse intensity distribution 𝐼|𝜁=0= 𝐼0Φ(𝑟)𝑒−𝜏
2/𝜏
0 with τ
0=
𝜏𝑝/2√ln 2, τp is the laser pulse duration(FWHM), 𝜁 ∈ [0, 𝐿𝜁]. The time in the frame moving
with group velocity of the laser pulse υg is τ = υg𝑡 − 𝑧, and the position of the laser pulse
in space, correspondingly to its central time slice (τ = 0): ζ = υg𝑡.
Experimentally, the energy absorption is is only about 0.04% to 0.5% when the injection laser irradiance ranges from 2 TW/cm2 to 9 TW/cm2. So the electron and hole
source term after each laser pulse can be approximate as follows: n̅e(r) = n𝑒0Φ(𝑟)𝐾 ,
where n𝑒0= 1017 𝑐𝑚−3 for all considered pulse irradiance. And Φ(𝑟) is term for a
normalized beam shape with radial symmetry, where r is the radial coordinate and K is the order of the multiphoton ionization processes. So for train of laser pulses, the electron and hole source term can be written as follow:
Γ𝐼= ∑ 𝑛̅𝑒(𝑟)𝛿(𝑡 − 𝑛𝑡𝐿) 𝑁𝑝
𝑛=1
Equation 12
where tL= 1/𝜈, 𝑁𝑃 is the number of pulse train, and 𝜈 is the repetition rate of laser
pulse.
Finally the absorption of the laser pulse intensity can be estimated by solving Equation 11 with ne= 𝑛̅𝑒(𝑟) skipping the avalanche term. The radial distribution of the absorbed
19 𝑆(𝑟 ) = 1 𝐿𝜁 ∫ 𝐼𝑎𝑏𝑠(𝑟, 𝜏) +∞ −∞ 𝑑𝜏 Equation 13
where 𝐼𝑎𝑏𝑠(𝑟, 𝜏) = I(r, τ)|𝜁=0− 𝐼(𝑟, 𝜏)|𝜁=𝐿𝜁. The value of the absorbed energy Eabs is
𝐸𝑎𝑏𝑠= ∫ ∫ 𝐼𝑎𝑏𝑠(𝑟, 𝜏)𝑟 𝑑𝑟𝑑𝜏 ∞ 0 ∞ 0 Equation 14
The temperature distribution in space and time is calculated according to
𝜕𝑇 𝜕𝑡 = 𝐷𝑡ℎ∆𝑇 + 1 𝐶𝑃𝜌 ∑ 𝑆(𝑟)𝛿(𝑡 − 𝑛𝑡𝐿) 𝑁𝑃 𝑛=1 Equation 15
where S is the heat source term calculated in Equation 13, 𝐶𝑃 and 𝜌 are specific heat
capacity and the density of the glass, respectively, and 𝑁𝑃 is the number of laser pulses.
𝐷𝑡ℎ is the heat diffusion coefficient in the glass, assumed as a constant. The first term in
this equation represents the temperature diffusion ΓDth in Equation 1, and the second term
corresponds for laser energy absorption Sth in Equation 1.
Diffusion ΓD and mobility ΓM terms of general model for silver ions Ag+ and electron
20
ΓD+ ΓM= ∇(𝐷∇⃑⃑ 𝑛) − ∇(μE⃑⃑ dc𝑛) Equation 16
where D is the diffusion coefficient of the considered species, n is the its concentration, μ = q
kTD is the mobility in the electric field E⃑⃑ dc defined according to the Einstein relation,
and q is the particle charge. Generally, the diffusion process of the metallic species depends on the lattice temperature T. So diffusion coefficient can be expressed as:
𝐷(𝑇) = 𝐷(𝑇0) exp (
𝐸𝑎
𝑘𝑇0
) exp (−𝐸𝑎
𝑘𝑇) Equation 17
where 𝑘 is the Boltzmann constant and 𝐸𝑎= 0.8 eV is the activation energy [39].
The charge distribution Q for particular case of silver-containing glass is calculated as follow:
𝑄 𝑞0
= 𝑛𝐴𝑔++ 2𝑛𝐴𝑔2++ 𝑛𝐴𝑔
2++ 𝑛ℎ− 𝑛𝑒− 𝑛𝐿− Equation 18
where 𝑞0 is the absolute value of the electron charge. 𝑛𝐿− is concentration of the
input silver ion. 𝑛𝐿−= nAg+ 0 .
Here, the kinetic terms 𝛤𝑘 for clustering silver ions can be expressed with the
21
ionized silver ions Ag2+, and silver cluster Ag2+. It all starts with the first femtosecond laser
pulse. This pulse brings the photo-ionization of the glass. Photo-electrons and holes in this process are trapped in the silver ions contained in the glass. Thus there are three competitive kinetic reactions. electron-hole recombination, 𝐴𝑔++ 𝑒−→ 𝐴𝑔0 , and 𝐴𝑔++
ℎ+→ 𝐴𝑔2+ . Ag0, which has relatively high mobility, undergoes a chemical reaction with
silver ions Ag+ again, forming a silver cluster Ag2+. 𝐴𝑔0+ 𝐴𝑔+→ 𝐴𝑔
2+. For electrons and
holes, 𝛤𝑘 in Equation 2 and Equation 3 are as follow:
𝛤𝑘(𝑛𝑒, … ) = −𝐾𝑟𝑛𝑒𝑛ℎ− 𝐾𝑟𝑛𝐴𝑔2+𝑛𝑒− 𝐾𝐴𝑔0𝑛𝐴𝑔+𝑛𝑒 Equation 19
𝛤𝑘(𝑛ℎ, … ) = −𝐾𝑟𝑛𝑒𝑛ℎ− 𝐾𝑟𝑛𝐴𝑔0𝑛ℎ− 𝐾𝐴𝑔2+𝑛𝐴𝑔+𝑛ℎ
Equation 20
Here the first term is for electron-hole recombination and is related to the recombination constant Kr, estimated as Kr=
1
τr𝑛𝑒0 . The second terms are for
recombination of electron-Ag2+ and hole-Ag0. And the last terms represent the electron/hole
trapping by silver ions characterized by thermally activated kinetic constants 𝐾𝐴𝑔0 and
𝐾𝐴𝑔2+.
In Equation 6, the concentration of silver ions 𝑛𝐴𝑔+ expressed as partial derivative of
22
𝛤𝑘(𝑛𝐴𝑔+, … ) = −𝐾𝐴𝑔0𝑛𝐴𝑔+𝑛𝑒− 𝐾𝐴𝑔2+𝑛𝐴𝑔+𝑛ℎ− 𝐾𝐴𝑔2+𝑛𝐴𝑔+𝑛𝐴𝑔0
+ 𝐾𝑟𝑎𝐴𝑔0𝑛ℎ+ 𝐾𝑟𝑛𝐴𝑔2+𝑛𝑒+ 2𝐾𝐴𝑔+𝑛𝐴𝑔2+𝑛𝐴𝑔0
Equation 21
where the first and second terms are for the trapping of free electron and hole respectively. The third term represents the formation of silver cluster Ag2+, and the fourth
and fifth terms correspond to the recombination processes of hole-Ag0 and electron-Ag2+.
Similarly, in Equation 7, Equation 8, and Equation 9, 𝛤𝑘(𝑛𝐴𝑔0, … ) = 𝐾𝐴𝑔0𝑛𝐴𝑔+𝑛𝑒− 𝐾𝐴𝑔2+𝑛𝐴𝑔+𝑛𝐴𝑔0− 𝐾𝑟𝑛𝐴𝑔0𝑛ℎ
− 𝐾𝐴𝑔+𝑛𝐴𝑔2+𝑛𝐴𝑔0
Equation 22
𝛤𝑘(𝑛𝐴𝑔2+, … ) = 𝐾𝐴𝑔2+𝑛𝐴𝑔+𝑛ℎ− 𝐾𝑟𝑛𝐴𝑔2+𝑛𝑒− 𝐾𝐴𝑔+𝑛𝐴𝑔2+𝑛𝐴𝑔0 Equation 23
𝛤𝑘(𝑛𝐴𝑔2+, … ) = 𝐾𝐴𝑔2+𝑛𝐴𝑔+𝑛𝐴𝑔0 Equation 24
The thermal dependence of the kinetic constants is evaluated according to the Arrhenius equation with pre-exponential factor given by the collision theory [40].
𝐾𝐴𝑔(𝑇) = 𝐾𝐴𝑔(𝑇0)√ 𝑇 𝑇0 𝑒𝑥𝑝 (𝐸𝑎 𝑘𝑇0 )𝑒𝑥𝑝 (−𝐸𝑎 𝑘𝑇) Equation 25
23
This dependency also applies to reactions of silver species formation. The 𝐾𝐴𝑔 is the
kinetic constants for all silver species.: 𝐾𝐴𝑔0, 𝐾𝐴𝑔2+, 𝐾𝐴𝑔
2+, 𝐾𝐴𝑔+.
Laser induced silver clusters' dissociation is applied to the general model. The photo-dissociation of metallic cluster is a thermally assisted process determined by the ratio between the photon energy and the dissociation energies of different dissociation processes of the clusters. That is the reason the dissociation coefficient Kdiss is an
experimental parameter derived from the measurements. The decrease of the silver cluster Ag2+ in the center of the laser focal volume is caused by following two factors.: The high
temperature of lattice and the photon energy from the fs laser pulse. Firstly, when lattice reaches a high enough temperature (about 200 K, lower than Tg), the thermal dissolution
of silver cluster can be described by the interplay between the redox potential of the glass composition, ionization of the glass, and the glass temperature. Secondly, photon-dissociation due to high energy laser pulses is explained by multiphoton photon-dissociation.
Considering the dissociation of the smallest silver clusters (Agm+, m > 2), we will take
an empirical approach. Both multiphoton assisted dissociation and high temperature assisted dissociation occur through following chemical pathway.:
24
So dissociation term in Equation 2, Equation 4, Equation 6, and Equation 9 can be written as:
𝛤𝐷𝑖𝑠𝑠= 𝛼𝐷𝑖𝑠𝑠∑ 𝐾𝐷𝑖𝑠𝑠𝑛𝐴𝑔2+𝛿(𝑡 − 𝑛𝑡𝐿) 𝑁𝑝
𝑛=1
Equation 27
where 𝛼𝐷𝑖𝑠𝑠 corresponds to the mass and charge conservation according to the
dissociation pathway (𝛼𝐷𝑖𝑠𝑠= −1 𝑓𝑜𝑟 𝐴𝑔2+, 2 𝑓𝑜𝑟 𝐴𝑔+, 𝑎𝑛𝑑 1 𝑓𝑜𝑟 𝑒−) . The distribution
of laser intensity and the temperature of lattice that induce dissociation are the same as the distribution of irradiated laser intensity. And Dissociation function 𝐾𝐷𝑖𝑠𝑠(𝑟) takes the
form of a step-function by dissociation functionality. In other words, the dissociation function has a unity value at the center of the Gaussian beam and a value close to zero at the periphery of the beam. So 𝐾𝐷𝑖𝑠𝑠(𝑟) is phenomenologically presented as a function of the
absorbed laser pulse energy by the dependence on the source term S in the heat diffusion Equation 15:
𝐾𝑑𝑖𝑠𝑠(𝑟) = 1 − 𝑒𝑥𝑝 [−
𝑆(𝑟)𝑁
𝑆0𝑁 ] Equation 28
The two free parameters 𝑆0 and N are terms for the position and the steepness of the
25
2.2.4 Optical properties of silver containing glass
The writing patterns with silver-cluster created produced above processes has a different properties from the three types of modifications, and is classified separately as type Argentum (so called type A) [41]. Type Argentum requires less laser energy than other types and bring different morphology of refractive index changes. Type I modifications lead to smooth and negative refractive index changes, while Type Argentum is characterized by a positive change refractive index along the silver clusters made. That is, the pattern of the ring shape is created. Figure 5 shows the new position of type Argentum.
Figure 5 Classification of modifications according to laser flux and types of refractive index change [41]
Figure 6 shows the configurations, fluorescence images of confocal microscopy and images of High Resolution Scanning Electron Microscopy(HRSEM) when the laser beam is irradiated on silver containing glass sample. Figure 6 (a) is the configuration that shows the focusing volume when the laser beam is irradiated onto the sample. In the edge of writing zone, the silver cluster is induced. Figure 6 (b) shows the fluorescence image of a laser induced silver cluster at the front and side view. Figure 6 (d) shows the chessboard
26
pattern by moving the sample on the same plane. In Figure 6 (e), the existing writing pattern is erased by secondary writing and rewritten at the overlapping part.
Figure 6 Configurations of type argentum modification with stationary focus (a) and in the same plane (g). Fluorescence images of writing pattern in the front and side view (b, e).
27
Type A modifications also differ in the sign of the refractive index change. In Type I, Figure 7 (a) has a negative change in refractive index, but in Type A it has a positive change as shown in Figure 7 (b) [41].
Figure 7 Comparison of refractive index changes between type I and type A [41]
Silver-doped phosphate glasses have the fluorescence properties shown in Figure 8 [28]. The three glass sample differ in compositions: (expressed in mol percent) (1) Poly-phosphate: 61.14 P2O5 – 21.58 Ga2O3 15.28 Na2O – 2 Ag2O, (2) Pyro-phosphate: 46.6
P2O5 – 16.45 Ga2O3 – 34.95 Na2O – 2 Ag2O, (3) Ortho-phosphate: 51.53 P2O5 – 12.12
Ga2O3 – 51.53 Na2O – 2 Ag2O, keeping the ratio Ga2O3 / P2O5 = 0.35 constant. Samples
of these combinations have common fluorescence emission spectra from λem = 450 nm
to λem = 650 nm when excited with excitation wavelength at λex= 405 nm. The intensity
of fluorescence varies depending on the intensity of irradiance, writing speed, and number of writing pulses. As Figure 8 (b) shows, the faster the writing velocity, the smaller the number of pulses that affect the writing structure, as a result it bring lower fluorescence intensity.
28
Figure 8 Fluorescence properties of silver-containing phosphate glass (a) Fluorescence image of structures engraved on glasses sample with three different chemical composition, (b) Fluorescence intensity according to writing velocity, (c) Spectrum
distribution of emitted light when excited with a laser of 405 nm wavelength [28].
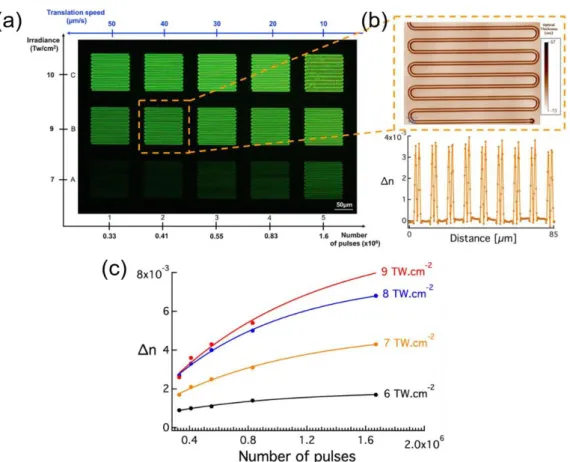
In Figure 9 silver-doped phosphate glasses exhibited refractive index change ranging from 0.9 × 10⁻³ to 8 × 10⁻³ when irradiated with fs pulse laser from 6 TW/cm2 to
9 TW/cm2 [43]. The variation in refractive index also depends on the laser irradiance,
writing speed, and number of writing pulses. The larger the irradiance and the more the number of pulses (i.e. the lower the writing speed), the larger the refractive index change and the greater the fluorescence intensity.
29
Figure 9 Refractive index change for laser irradiance and number of pulses; (a) matrix of structures for 2 parameter changes; (b) Image showing optical path difference for one
30
2.3 Experimental set-up: fs-Laser, AOM and SLM
2.3.1 femtosecond laser and Experimental set-up
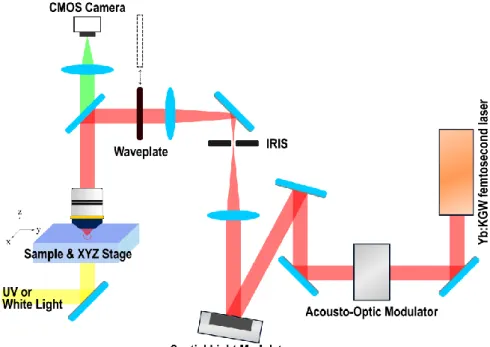
Yb:KGW femtosecond laser (T-pulse 200, Amplitude system, 9.8 MHz repetition rate, average power 2.4 W, 390 fs pulse FWHM duration and operating at 1030 nm) was used for DLW. Figure 10 shows the complete experimental set-up for DLW with Acousto-Optic Modulator, Spatial Light Modulator, and XYZ stage. When writing, mainly Zeiss air objective (20x, NA = 0.75) and Mitutoyo air objective (20x, NA = 0.40) were used for focusing. Newport company's XPS was used for XYZ positioning of the sample within few nano-meter resolution.
Figure 10 Experimental Setup Schematic for Direct Laser Writing; fs laser, Acousto-Optic Modulator, Spatial Light Modulator, and XYZ stage.
31
2.3.2 Acousto-Optic Modulator
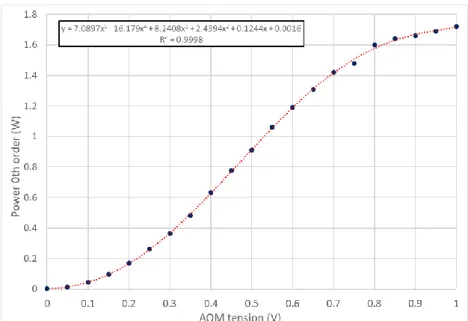
The power of the laser beam can be controlled by adjusting the voltage applied to the Acousto-Optic Modulator (AOM). The voltage across the material of the AOM controls the intensity of sound, and the intensity of sound modulates the intensity of the diffracted beam. In this study, fused silica was used as an acousto-material and a product operating at a velocity of 5960 m/s (model number: AMQ80-A0.7-L1030.1064-Z20, AA Opto-Electronic company). As the voltage across the fused silica can be adjusted from 0 V to 1 V, so the laser power that is diffracted into m = 0 order can be varied from 0 W to 1.80 W. At this time, the applied voltage and output power do not have a linear relationship but look like sigmoid function shown as Figure 11. Therefore, we can inversely calculate the irradiance to the sample from the applied voltage.
Figure 11 Graph showing the relationship between voltage to both fused silica and laser power at m=0 order
32
2.3.3 Spatial Light Modulator
The laser beam passing through the AOM can be adjusted two-dimensionally at the focal plane of the objective lens via the Spatial Light Modulator(SLM). That is, the spatial distribution of light such as the phase, polarization state, and propagation direction can be modulated according to the information we need. In this study, liquid-crystal-silicon SLM (LCOS, X10468-03, 800 × 600 pixel, Hamamatsu Photonics) was used to control the wavefront of the laser beam. Figure 12 show a program coded by IGOR program to control phase on SLM mask. With this program, symmetrical focusing, asymmetrical focusing, Hermite-Gaussian focusing, and Laguerre-Gaussian focusing were enabled, and parameters were set to precisely manipulate the focusing position and spatial shape of the beam. Table 1 The SLM mask which control the phase of laser beam and the DLW patterns in the silver containing glass for different modes of focusing. Table 1 shows the SLM mask for respective focusing mode and DLW patterns in silver containing glass.
33
Figure 12 IGOR Program, which is designed to control SLM mask, enables several modes of focusing and precisely adjust the positioning of the laser beam.
Symmetrical focusing Anamorphic focusing Hermite-Gaussian focusing Laguerre-Gaussian focusing SLM Phase mask DLW patterns in silver doped glass
Table 1 The SLM mask which control the phase of laser beam and the DLW patterns in the silver containing glass for different modes of focusing.
35
Chapter 3. 1-dimensional DLW and its spatial
redistribution of Silver species
3.1 Introduction
Femtosecond (fs) laser modification technology of materials has made tremendous progress over the past decade, to access a large panel of applications that require special optical, physical and/or chemical properties associated with integrated bulk or surface functionalities [44]. While considering laser-induced element redistribution, most of the reported literature deals with processes in thermal regime with temperature increase above glass fusion [45,46]. Additional potentialities rely on the innovative synthesis of prepared materials with photosensitive agents [34]. In this framework, controlling the photosensitive agents under laser irradiation in a non-thermal regime, as well as the spatial redistribution and chemical evolution due to activated chemical reactivity, is of prime importance to achieve reliable nano- and micro-scale material changes with high optical quality. Such control and understanding is highly challenging since it involves multi-scale material changes, which requires correlative investigation approaches.
In chapter 3, based on near-field scanning optical microscopy (NSOM) images, chemical micro-probe analysis, spatial profile after soft etching, and numerical simulations of the silver species redistribution, the fs laser-induced spatial redistribution of silver species of our photosensitive silver-containing phosphate glasses is described correlatively.
![Figure 2 Time scale of the interaction between photon and material [28]](https://thumb-eu.123doks.com/thumbv2/123doknet/12708188.355931/34.892.161.741.309.550/figure-time-scale-interaction-photon-material.webp)
![Figure 4 The process for formation of laser-induced ring shape cluster within the silver- silver-doped phosphate glasses [38]](https://thumb-eu.123doks.com/thumbv2/123doknet/12708188.355931/39.892.167.731.225.636/figure-process-formation-induced-cluster-silver-phosphate-glasses.webp)
![Figure 7 Comparison of refractive index changes between type I and type A [41]](https://thumb-eu.123doks.com/thumbv2/123doknet/12708188.355931/52.892.210.694.343.564/figure-comparison-refractive-index-changes-type-i-type.webp)