HAL Id: inria-00404323
https://hal.inria.fr/inria-00404323
Submitted on 16 Jul 2009
HAL is a multi-disciplinary open access
archive for the deposit and dissemination of
sci-entific research documents, whether they are
pub-lished or not. The documents may come from
teaching and research institutions in France or
abroad, or from public or private research centers.
L’archive ouverte pluridisciplinaire HAL, est
destinée au dépôt et à la diffusion de documents
scientifiques de niveau recherche, publiés ou non,
émanant des établissements d’enseignement et de
recherche français ou étrangers, des laboratoires
publics ou privés.
A hypergraph-based model for graph clustering:
application to image indexing
Salim Jouili, Salvatore Tabbone
To cite this version:
Salim Jouili, Salvatore Tabbone. A hypergraph-based model for graph clustering: application to image
indexing. The 13th International Conference on Computer Analysis of Images and Patterns, Sep 2009,
Munster, Germany. pp.360-368, �10.1007/978-3-642-03767-2_44�. �inria-00404323�
application to image indexing
Salim Jouili and Salvatore Tabbone
LORIA UMR 7503 - University of Nancy 2 BP 239, 54506 Vandoeuvre-l`es-Nancy Cedex, France
{salim.jouili,tabbone}@loria.fr
Abstract. In this paper, we introduce a prototype-based clustering al-gorithm dealing with graphs. We propose a hypergraph-based model for graph data sets by allowing clusters overlapping. More precisely, in this representation one graph can be assigned to more than one cluster. Us-ing the concept of the graph median and a given threshold, the pro-posed algorithm detects automatically the number of classes in the graph database. We consider clusters as hyperedges in our hypergraph model and we define a retrieval technique indexing the database with hyperedge centroids. This model is interesting to travel the data set and efficient to cluster and retrieve graphs.
1
Introduction
Graphs give a universal and flexible framework to describe the structure and the relationship between objects. They are useful in many different application domains like pattern recognition, computer vision and image analysis. For exam-ple in the context of content-based image retrieval, the user formulate a visual query. The user’s target is seldom represented by a whole image which should not be processed like a one unit, because it is generally composed by a set of visual regions carrying out some semantics. Then, the graphs, by their natures, propose an adjusted solution for this task. Moreover, to reduce the number of graphs to be computed for matching or indexing tasks it is generally required to cluster objects. By this way, clustering similar images becomes equivalent to look for those graph representations that are similar to each other in a database. In this context, it is natural to apply clustering techniques to graphs. Clustering large set of graphs is still widely unexplored and is one of the most challenging problems in structural pattern recognition. In the recent years, some investiga-tions on graph clustering and the organization of graph databases have been revitalized in [6, 10, 13, 22]. Graph clustering problems rely in the organization of large structural databases, in discovering shape categories and view structure of objects, or in the construction of nearest neighbor classifiers. In this perspec-tive, we propose a hypergraph model to cluster a set of graphs. A hypergraph [3] H=(ϑ, ξ) consists of a set of vertices ϑ and a set of hyperedges ξ; each hyper-edge is a subset of vertices. We can note that the difference between an hyper-edge in a graph and a hyperedge in a hypergraph is that the former is always a subset of
2 Salim Jouili and Salvatore Tabbone
one or two vertices, and in the latter, the subset of vertices can be of arbitrary cardinality. In our model, we represent each graph by a vertex and each cluster by a hyperedge. The degree of a vertex is the number of hyperedges it belongs to, and the degree of a hyperedge is the number of vertices it contains. We de-note the maximum degree of a vertex v by ∆ϑ(v ) and the maximum degree of a
hyperedge h by ∆ξ(h). Recently, the hypergraph has been used, in the pattern
recognition domain, for object representation [15], similarity measures [5], and object clustering [1]. In this paper we establish a hypergraph-based model for a graph database, we process as follows: firstly, a clustering technique based on the prototype selection is proposed to cluster the graph set into k independent clusters (k is detected automatically using a given threshold). Secondly, these clusters will be overlapped to define the final hypergraph structure. The idea of clusters overlapping is in the same vein as the works in [4, 24] but the represen-tation is different here. In fact from a set of experiments, we have remarked that the hypergraph structure provides a framework to retrieve and to browse graphs. This also leads to high clustering rate and improves the retrieval performance.
2
The proposed Hypergraph model
Since, we have focus our work in that one graph can belongs to several clus-ters, we consider that the proposed hypergraph is connected (1-edge-connected ). Therefore, each graph Giin the proposed structure is assigned to ∆ϑ(Gi) clusters
and each cluster Cj contains ∆ξ(Cj) graphs. However, a key problem in
struc-turing a set of graphs into a hypergraph is the determination of the number of clusters (hyperedges) and the determination of related graphs (similar graphs) that can be grouped as hyperedges. In this perspective, we consider that the number of hyperedges is equal to the size of a representative set, defined on a selection of the most representative graphs in the whole set. We denote each selected graph as a hyperedge centroid. The selection of these graphs is similar to the problem of Prototype Selection [2, 17, 23]. K. Riesen and al. [17] enumer-ate some techniques to select prototypes from a training set. These techniques require a specification of the number of prototypes and there are no premises for determining automatically this number. Therefore, if we are in a unsuper-vised context where no information about the number of representative graphs is available, this number will be determined empirically. In this perspective, Spath [23] proposes an algorithm using leaders and distance based threshold where the number of selected prototype is inversely proportional to the selected threshold. However, the Leader algorithm [23] is sensitive to the selection of the initial prototype which is selected randomly among the input data. To overcome this problem, we introduce a representative graphs (hyperedge centroids) selection based on a peeling-off strategy. This method can be viewed as an improvement of the Leader algorithm and the K -Centers. After the selection of the hyperedge centroids, we define the hypergraph structure by assigning each graph to the corresponding hyperedges. Then the browsing and the retrieval of the graphs will be transposed into the hypergraph structure.
Hyperedge centroids selection. As stated above, the hyperedge centroids se-lection is similar to the Prototype Sese-lection problem. Therefore, we aim to select a set of graphs which capture the most significant aspects of a set of graphs. We introduce an improvement for the Leader algorithm [23]. The proposed algorithm proceeds as follows:
1. Select the median graph [11] Gm from the unassigned graphs in the whole
set of graphs S. Then the furthest graph Gpk (which has not been
previ-ously assigned) to Gm, becomes the centroids of the cluster Ck. In the first
iteration, the graph Gpk is the initial selected prototype.
2. Distances of every unassigned graph gi∈ S {Gpk} are compared with that
of the last selected prototype Gpk. If the distances d(gi, Gpk) and d(gi, gj
∈Ck) are less than a predefined threshold T, the graph gi is assigned to the
cluster Ck with the centroid Gpk, and gi is tagged as assigned.
3. Recompute the median graph Gmk of Ck, if Gmk 6= Gpk, replace Gpk by
Gmk. If any replacements is done, go to the next step, otherwise all gj are
tagged as unassigned, ∀gj ∈ Ck, then return to step 2.
4. While S contains an unassigned graphs return to step 1, otherwise stop. Given a threshold T, the algorithm clusters the set of graphs with an intra-class inertia (Ii) less or equal to T. This property is performed on the step 2. In addition, this algorithm ensures the selection of the prototypes which are given by the centers of the resulted clusters. Futhermore, it guarantees a certain separability between classes of one partition. By using an edit distance d, we can formulate the between-class inertia (Ib) of a partition C composed of two classes C1,C2by the Ward [25] criterion:
Ib(C1, C2) =
η1× η2
η1+ η2
d2gc1,gc2 (1)
where gci is the centroid of the class Ci and ηi is the number of members of Ci.
The analysis of this formula shows that there is a strong dependence between the interclass inertia and the centroid. However, we know that the distance between two centroids is higher than the threshold T and Ii ≤ T. Moreover, by fixing the initial selected prototype as the furthest graph to the median graph of the graph set, multiple runs of the algorithm produce identical results. We denote this clustering algorithm by D-hypergraph (disconnected hypergraph).
The hypergraph-based representation. Let S be the whole set of graphs and P be the set of selected prototypes P (P ⊂S ). Classical clustering techniques find for each graph g∈ S P its nearest neighbor pi ∈ P and add the graph to the
cluster Ci corresponding to the prototype pi. In fact, if a graph g presents a
similar distances to two prototypes pi and pj, g is added to the cluster with the
nearest prototype even though the difference between the two distances is very minor. Moreover, the provided clusters are disjoint and can be exploited for a retrieval task as used in [18–21], but it will be difficult to find an algorithm for browsing the whole set of graphs through disjoint clusters.
4 Salim Jouili and Salvatore Tabbone
On the contrary, we propose a hypergraph-based model which allows the overlapping of clusters. In fact, henceforth the clusters will be viewed as hyper-edges of hypergraph and the graphs as the vertices. Firstly, for each selected prototype pi a hyperedge hi is defined with a centroid pi. Secondly, every
hy-peredge is defined as follows : each graph g∈ S P is added to the hyhy-peredges with the nearest prototypes to g (their distances to g is less than the threshold T used in the previous algorithm). We denote this procedure by C-hypergraph (connected hypergraph).
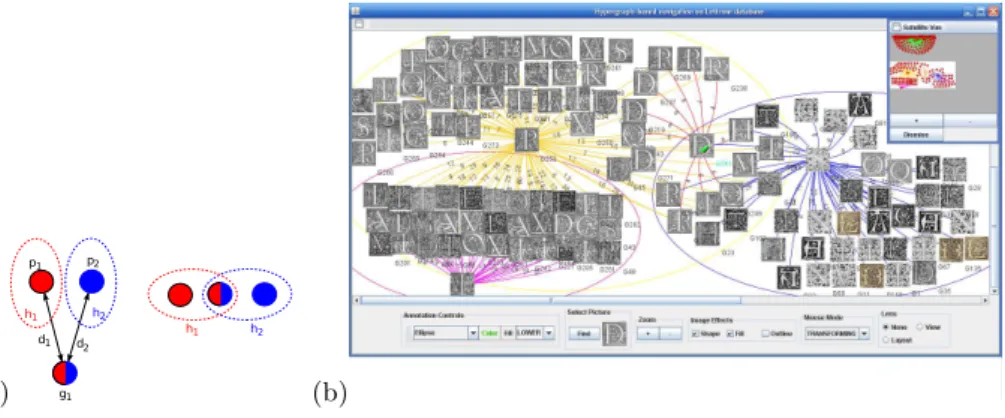
Figure 1(a) illustrates our motivation. In the leftmost part of the figure di=d(pi, g1) and we suppose that d1 and d2 are less or equal than T, so the
graph g1 shares some informations with p1and p2 (informations are illustrated
in colors). With the hypergraph model we will able to assign g1 to the both
hyperedges h1 and h2. The rightmost part of the figure 1(a) describes how two
hyperedges (clusters) can overlap with one graph in common. Here, ∆ϑ(g1)=2
and ∆ξ(h1)=∆ξ(h2)=2.
(a) (b)
Fig. 1.Illustration of the hypergraph-based representation
Once all the hyperedges are defined from the graphs, we recompute, for each hyperedge, the generalized median graph which will be the new hyperedge cen-troids. The aim of this step is to update the hyperedge centroid after the hy-pergraph construction step and to maintain it including as much information as possible of the graphs in the corresponding hyperedge. We have chosen to use the generalized median graph to define the centroid of a cluster (unlike the Minimum Common Supergraph [6]) because it is less expensive in a viewpoint of computational time.
Interrogation and Navigation of hypergraph-based model of a set of graphs. Classically, interrogation of a set of graphs consists in searching the most similar graphs to a given query. This retrieval task ranks the graphs in an increasing distance order from the query. As remarked by a few works in the literature [18–21], this method do not exploit sophistically the distances, and the authors propose a clustering-based retrieval technique to improve the retrieval
results. Here, we introduce a procedure which involves the hypergraph-based model presented previously. The main idea is to find the most similar hyperedge centroid to a given graph query. Then, we look for the most similar graphs within the hyperedge which it centroid is the most similar to the query. We can describe the retrieval procedure into the hypergraph model as follows:
1. For a query graph gq, compute the set of distances between gq and each
hyperedge centroid.
2. Get the nearest hyperedge centroid pi to gq.
3. Retrieve the most similar graphs gj to gq, where gj ∈ hi and hi is the
hyperedge with the centroid pi.
This hypergraph-based model can be exploited to travel through the hyper-graph. Once the previous retrieval procedure is performed, the user can browse the set of graphs, through a graphical interface (see figure 1(b), where the clus-ters (hyperedges) are represented by overlapped ellipses), by performing a walk among the hyperedges.
3
Experiments
The clustering evaluation. In this first part of the experiments, our contri-bution is evaluated in a graph clustering context. Here, our contricontri-bution is used within two algorithms. The first one is the prototype-based clustering with-out connection of the hyperedges in the hypergraph (denoted D-Hypergraph as disconnected hypergraph). The second one allows the overlapping of the hy-peredges (denoted C-Hypergraph as connected hypergraph). We drawn a com-parison within a K-means algorithm. To this aim we have used three image databases, the first one is the well-known COIL database [14] which contains different views of 3D objects. The images in COIL are converted into graphs by feature points extraction using the Harris interest points [9] and Delaunay tri-angulation. The second is the well-known GREC [16, 7] database which consists of graphs representing symbols from architectural and electronic drawings. Here the ending points (ie corners, intersections and circles) are represented by nodes which are connected by undirected edges and labeled as lines or arcs. Finally, we have performed the clustering evaluation on an ornamental letters data set which contains lettrine (graphical object) extracted from digitized ancient doc-uments1. Since one lettrine contains a lot of information (i.e. texture, decorated
background, letters), the graphs are extracted from a region-based segmentation [8] of the lettrine. The nodes of the graph are represented by the regions and the edges describe their adjacency relationships. The graph distance measure used on the clustering is the graph matching measure based on the node signatures [12]. The clustering results are evaluated by the Rand index, the Dunn index and the Davies-Bouldin index. The Rand index measures how closely the clusters cre-ated by the clustering algorithm match the ground truth. The Dunn index is a
1 Provided by the CESR - University of Tours on the context of the ANR Navidomass
6 Salim Jouili and Salvatore Tabbone
measure of the compactness and separation of the clusters and unlike the Rand index, the Dunn index is not normalized. The Davies-Bouldin index is a function of intra-cluster compactness and inter-cluster separation. We note that a good clustering provides a smaller Davies-Bouldin index and a higher Rand and Dunn indexes. In this experiment the threshold T, used by our method, is defined as the mean of distances between graphs in the same database. The number of classes k used by the K-means is defined in accordance with the ground truth.
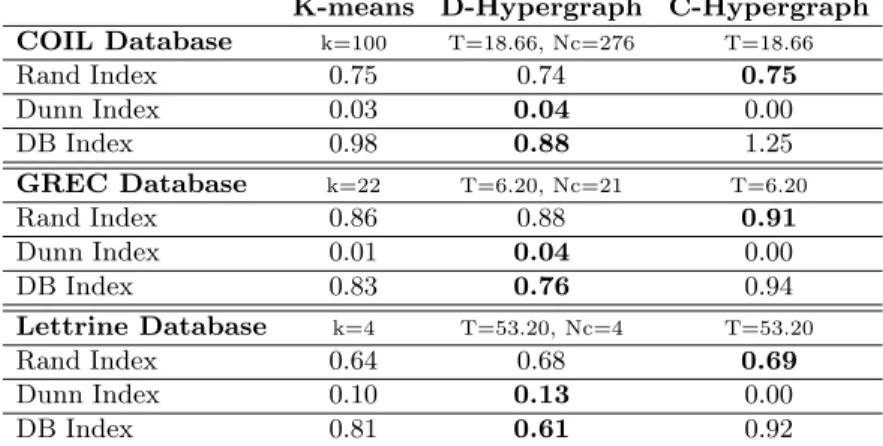
Table 1 shows the results of the three cluster validity indexes. From these results, it is clear that our disconnected hypergraph produces clusters more com-pact and well separated. We note that when the C-Hypergraph is performed the Dunn index take the value 0, because some graphs share clusters and the mini-mum between-class distance becomes 0. Moreover, in a viewpoint of similarity to the ground truth, our model provides better results for the GREC and the Let-trine database, and we can remark also that the Rand index of the C-Hypergraph for the three databases are higher than the Rand index of the D-Hypergraph. Therefore, the connected hypergraph fits better the ground truth and encourages us to exploit the hypergraph-based structure for the graph retrieval problem.
K-means D-Hypergraph C-Hypergraph COIL Database k=100 T=18.66, Nc=276 T=18.66 Rand Index 0.75 0.74 0.75 Dunn Index 0.03 0.04 0.00 DB Index 0.98 0.88 1.25 GREC Database k=22 T=6.20, Nc=21 T=6.20 Rand Index 0.86 0.88 0.91 Dunn Index 0.01 0.04 0.00 DB Index 0.83 0.76 0.94 Lettrine Database k=4 T=53.20, Nc=4 T=53.20 Rand Index 0.64 0.68 0.69 Dunn Index 0.10 0.13 0.00 DB Index 0.81 0.61 0.92
Table 1.Clustering evaluation and comparison with K-means(Nc: the number of detected clusters)
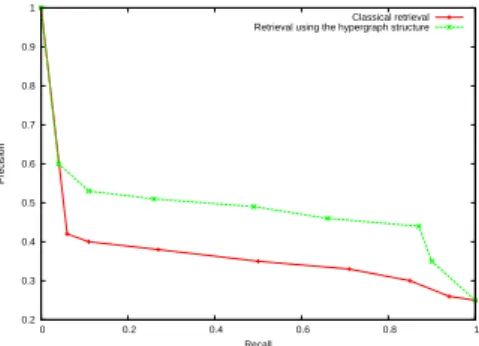
Evaluation of the retrieval with the hypergraph-based model. In this part of the experiments, we investigate the retrieval in the hypergraphs by per-forming the algorithm detailed previously on the Ornamental letters database. We provide a comparison with a classical retrieval task in which the graph query is compared to all the graphs in the database and then the most similar (the nearest ones) are retrieved. In the proposed approach, the hyperedges centroids are the entries of the database. That is to say, firstly the query graph is com-pared only to the hyperedge centroids. Then, the retrieval is performed among the graphs which belong to the hyperedge with the nearest centroid to the query. We used the receiver-operating curve (ROC) to measure retrieval performances. The ROC curves are formed by Precision rate against Recall rate, and drawn
in the figure 2. By analyzing the two curves, we can remark that the results are better when the retrieval is performed only in one hyperedge. Furthermore, the hypergraph-based model is less time-consuming than the classic technique since it does not compare the query with all graphs in the set but only with graphs in an appropriate clusters. 0.2 0.3 0.4 0.5 0.6 0.7 0.8 0.9 1 0 0.2 0.4 0.6 0.8 1 Precision Recall Classical retrieval Retrieval using the hypergraph structure
Fig. 2.Precision-Recall curves: comparison between classical retrieval and hypergraph-based retrieval
4
Conclusion
In this paper we have investigated how the hypergraph structure can be used for the purpose of graph database representation. We have proposed a prototype-based method to cluster graphs and to select automatically the prototypes which collect as much information as possible from the graph set without a predefined number of clusters. The major task of this work is to allow the multi-assignment of one graph, i.e. one graph can be assigned to more than one cluster. We have also shown that our hypergraph-based model improve the retrieval and can be used to navigate into a graph database.
Acknowledgments. This research is partially supported by the French Na-tional Research Agency project NAVIDOMASS referenced under ANR-06-MCDA-012 and Lorraine region. The authors would like to thank Ines Mili for useful programming contribution.
References
1. S. Agarwal, J. Lim, L. Zelnik-Manor, P. Perona, D. J. Kriegman, and S. Belongie. Beyond pairwise clustering. In IEEE CVPR, pages 838–845, 2005.
2. T. R. Babu and M. N. Murty. Comparaison of genetic algorithm based prototype selection schemes. Pattern Recognition, 34:523–525, 2001.
3. C. Berge. Graphes et Hypergraphes. Paris Dunod, 1970.
4. J. C. Bezdek, M. R. Pal, J. Keller, and R. Krisnapuram. Fuzzy Models and Algo-rithms for Pattern Recognition and Image Processing. Kluwer Academic Publish-ers, Norwell, MA, USA, 1999.
8 Salim Jouili and Salvatore Tabbone
5. H. Bunke, P. J. Dickinson, M. Kraetzl, M. Neuhaus, and M. Stettler. Matching of hypergraphs - algorithms, applications, and experiments. In H. Bunke, A. Kan-del, and M. Last, editors, Applied Pattern Recognition, volume 91 of Studies in Computational Intelligence, pages 131–154. Springer, 2008.
6. H. Bunke, P. Foggia, C. Guidobaldi, and M. Vento. Graph clustering using the weighted minimum common supergraph. IAPR Workshop GbRPR 2003, LNCS 2726, pages 235–246, 2003.
7. P. Dosch and E. Valveny. Report on the second symbol recognition contest. In IAPR Workshop on GREC, LNCS 3926, pages 381–397, 2005.
8. P. F. Felzenszwalb and D. P. Huttenlocher. Efficient graph-based image segmen-tation. International Journal of Computer Vision, 59(2):167–181, 2004.
9. C. Harris and M. Stephens. A combined corner and edge detection. In Proceedings of The Fourth Alvey Vision Conference, pages 147–151, 1988.
10. A. Hlaoui and S. Wang. A graph clustering algorithm with applications to content-based image retrieval. ICMLC, 2003, 3:1855–1861, 2003.
11. X. Jiang, A. Munger, and H. Bunke. On median graphs:properties, algorithms, and applications. IEEE TPAMI, 23(10):1144–1151, 2001.
12. S. Jouili and S. Tabbone. Graph matching using node signatures. In IAPR Work-shop on GbRPR, LNCS 5534, pages 154–163, 2009.
13. B. Luo, R. C. Wilson, and E. R. Hancock. Spectral feature vectors for graph clustering. IAPR Workshop on S+SSPR, LNCS 2396, pages 83–93, 2002. 14. S. Nene, S. Nayar, and H. Murase. Columbia object image library (coil-100).
technical report, Columbia Univ., 1996.
15. P. Ren, R. C. Wilson, and E. R. Hancock. Spectral embedding of feature hyper-graphs. In IAPR Workshop S+SSPR, LNCS 5342, pages 308–317, 2008.
16. K. Riesen and H. Bunke. Iam graph database repository for graph based pattern recognition and machine learning. In IAPR Workshop on S+SSPR, LNCS 5342, pages 287–297, 2008.
17. K. Riesen, M. Neuhaus, and H. Bunke. Graph embedding in vector spaces by means of prototype selection. IAPR Workshop on GbRPR, LNCS 4538, pages 383–393, 2007.
18. A. Robles-Kelly and E. R. Hancock. Graph edit distance from spectral seriation. IEEE TPAMI, 27(3):365–378, 2005.
19. T. B. Sebastian, P. N. Klein, and B. B. Kimia. Shock-based indexing into large shape databases. In 7th European Conference on Computer Vision, LNCS 2352, pages 731–746, 2002.
20. K. Sengupta and K. Boyer. Organizing large structural modelbases. IEEE TPAMI, 17(4):321–332, Apr 1995.
21. L. G. Shapiro and R. M. Haralick. Organization of relational models for scene analysis. IEEE TPAMI, PAMI-4(6):595–602, Nov. 1982.
22. A. Shokoufandeh and S. J. Dickinson. A unified framework for indexing and match-ing hierarchical shape structures. In 4th Int. Workshop on Visual Form, LNCS 2059, pages 67–84, 2001.
23. H. Spath. Cluster analysis algorithms for data reduction and classification of objects. Ellis Horwood Limited, West Sussex, 1980.
24. A. Torsello, S. R. Bul`o, and M. Pelillo. Beyond partitions: Allowing overlapping groups in pairwise clustering. In ICPR, pages 1–4. IEEE, 2008.
25. J. H. Ward. Hierarchical grouping to optimize an objective function. Journal of the American Statistical Association, 58(301):236–244, 1963.