HAL Id: hal-03060552
https://hal.archives-ouvertes.fr/hal-03060552
Submitted on 14 Dec 2020
HAL is a multi-disciplinary open access
archive for the deposit and dissemination of
sci-entific research documents, whether they are
pub-lished or not. The documents may come from
teaching and research institutions in France or
abroad, or from public or private research centers.
L’archive ouverte pluridisciplinaire HAL, est
destinée au dépôt et à la diffusion de documents
scientifiques de niveau recherche, publiés ou non,
émanant des établissements d’enseignement et de
recherche français ou étrangers, des laboratoires
publics ou privés.
High‑field superconductivity
in C‑doped MgB
2
bulk samples
prepared by a rapid synthesis route
D. Matera
1, M. Bonura
1*, R. Černý
1, S. McKeown Walker
1,2, F. Buta
1, D. LeBoeuf
3, X. Chaud
3,
E. Giannini
1& C. Senatore
1The upper critical field sets the thermodynamic limit to superconductivity. A big gap is present between the upper‑critical‑field values measured in MgB2 polycrystalline bulk superconductors and those of thin films, where values as high as ~ 50 T have been achieved at 4.2 K. Filling this gap would unlock the potential of MgB2 for magnet applications. This work presents the results of an extensive experimental campaign on MgB2 bulk samples, which has been guided by a Design of Experiment. We modeled the dependence of the upper critical field on the main synthesis parameters and established a new record (~ 35 T at 4.2 K) preparing C‑doped bulk samples by a non‑conventional rapid‑synthesis route. This value appears to be an upper boundary for the upper critical field in bulk samples. Structural disorder in films seems to act selectively on one of the two bands where superconductivity in MgB2 takes place: this enhances the upper critical field while reducing the critical temperature only by few Kelvins. On the other hand, the critical temperature in bulk samples decreases monotonically when structural disorder increases, and this imposes a limit to the maximum achievable upper critical field.
The MgB2 superconductor has significant potential for practical applications. The main points of strength are
its critical temperature close to 40 K, which may allow operating in cryogen-free environments, the low cost of precursor materials, and the ease of manufacture. However, today’s applications are limited to market niches, mainly constituted by low-field magnetic-resonance-imaging magnets and current leads1–6. The upper critical
field, HC2, is well below 20 T at 4.2 K in polycrystalline binary MgB2, whilst it can exceed 50 T in carbon-doped
films7,8. This value is about twice the H
C2 of Nb3Sn, which is largely used in magnet applications and is considered
one of the most promising candidates to realize next-generation particle-accelerator magnets9. In spite of the
considerable efforts undertaken to reproduce the same results in polycrystalline bulk materials and wires, the highest µ0HC2 achieved so far is ~ 34 T at 4.2 K, as measured in a double-walled-carbon-nanotube (DWCNT)
doped bulk sample10.
MgB2 has a planar structure with honeycomb B layers separated by Mg atoms. Strong sp2 hybrid σ bonding
within the in-plane B atoms gives rise to the 2-dimensional σ band. Boron pz orbitals lead to the 3-dimensional
π band11,12. Superconductivity takes place on the two bands with different energy gaps of ~ 2.2 meV (π band)
and ~ 7.0 meV (σ band) at 0 K13. Both superconducting gaps vanish at the bulk critical temperature T
C14.
Struc-tural disorder can induce charge-carrier scattering on different channels: intraband scattering in each of the σ and π bands, and interband scattering between them15. Enhanced interband scattering leads to a decrease of T
C, whilst
theoretical models predict that HC2 can be significantly improved at low temperatures by selectively increasing
the π-band intraband scattering15,16. Nanoscale disorder can be tuned by chemical doping8,10,17, irradiation16,18,
and preparation conditions18,19. In the case of MgB
2, C proved to be the most effective way to enhance HC2 by
doping10,20,21. C is not expected to have the same effect on the MgB
2 crystal structure in films and bulk samples22,23,
and this may lead to variations in the scattering rates19,22,24. To date, the scenario that leads to record-high H
C2
in films is unclear. The out-of-equilibrium environment typical of film-growth processing may play a key role in enhancing HC2. Indeed, µ0HC2(4.2 K) as high as ~ 44.5 T was measured in a binary film25, indicating that C
doping is not an exclusive way to achieve very high HC2.
This work presents a systematic study of the effects of the synthesis conditions on HC2 for C-doped bulk
samples. We employed a rapid-synthesis route, which allowed us to explore ranges of variation of the synthesis conditions not achievable with traditional techniques. By means of a Design of Experiment, we defined the
OPEN
1Department of Quantum Matter Physics (DQMP), University of Geneva, Geneva, Switzerland. 2Laboratory of
Advanced Technology (LTA), Geneva, Switzerland. 3LNCMI, CNRS, EMFL, INSA Toulouse, Université Grenoble
HC2 response surface as a function of the main variables of the manufacturing route and thus determined the
synthesis-parameter ranges that maximize HC2. We found that, in spite of an enhanced substitution rate of C in
Mg(B1−xCx)2, µ0HC2 appears bounded to maximum values of ~ 26 T and ~ 35 T at 10 K and 4.2 K, respectively.
These figures constitute new records for HC2 in bulk samples but remain far below what is achievable by the
mate-rial in film form. We show that in bulk samples, HC2 and TC correlate well with the lattice constant a. HC2 values
of bulk samples (from this work and from the literature) on which disorder has been introduced by different sources can be estimated with an uncertainty below ~ ± 20% by knowing TC. The rapid-synthesis route allowed
the production of samples with very-high irreversibility fields (HIrr). This is an important result for applications
because HIrr defines the maximum field at which superconductors can be operated in magnets. The potential
scalability for large volume productions of wires and bulk materials is another point of strength of this technique.
Results
The MgB2 bulk sample manufacturing process consists of a combination of the Internal Magnesium Diffusion
(IMD) and the Powder-in-Closed-Tube (PiCT) techniques26,27. Samples prepared by IMD are typically
character-ized by high electrical connectivity28. The PiCT technique allows in turn achieving a high density of the reacted
MgB2 phase and a high reproducibility of the sample properties27. Samples were reacted using a laboratory-made
induction furnace, which allowed us to heat with ramp rates as high as ~ 1000 °C/min and to quench the reaction process by injecting high-pressure Ar on the sample crucible. We prepared few binary MgB2 samples as reference,
and ~ 50 C-doped samples, most of them with a nominal composition Mg(B0.9C0.1)2. Indeed, x = 0.1 was proven
to maximize HC2 in Mg(B1−xCx)2 polycrystalline samples in the case of DWCNT10, which is the C-dopant used
in this work. Details about the manufacturing process are reported in section Methods.
Based on a previous work of ours29, we identified five synthesis parameters whose variation has a major effect
on the samples’ superconducting properties, namely the heating ramp rate (HR), the dwell temperature (Td), the
dwell time (t), the pressure of the Ar-gas quenching jet (ArP), and the pressure applied to the precursors before synthesis (P). These variables reciprocally interact in the determination of HC2, making the quest for the “best”
synthesis conditions very challenging. The Design of Experiment (DoE) is a statistical tool used to determine the effects of experimental factors on a desired output in a system. It offers a set of advantages over the traditional one-variable-at-a-time approach since it can help to resolve parameter interactions and provide detailed maps of the system behavior30. We used two types of DoE in this work. First, we carried out a screening DoE with the aim
of identifying the area of the synthesis-parameter space where the highest HC2 values are localized. We prepared
11 samples, which were characterized in terms of TC, ΔTC, HC2, Hirr, and lattice parameters a and c. HC2 and HIrr
were evaluated at 10 K, for two main reasons. The first one is conceptual, as the key interest in MgB2 for magnet
technology is for cryocooled systems operating above 4.2 K. The second one is practical and mainly related to the magnetic-field range (0–21 T) available at the University of Geneva, where most of the measurements were per-formed. The main properties of the samples prepared in the frame of the screening DoE are reported in Table 1. Based on this preliminary investigation, we performed a Response-Surface-Methodology (RSM) DoE, which is used to produce a detailed mathematical model of the process behavior as a function of the input variables30,31.
The RSM DoE required the preparation of 26 samples, which were all investigated at the University of Geneva. A sample selection was further characterized up to 35 T in an extended temperature range down to ~ 2.5 K at the LNCMI (Grenoble, France). The superconducting and structural properties of the samples prepared in the frame of the RSM DoE are reported in Table 2. Details on both DoEs, including comments on the experimental reproducibility, are reported in Methods.
We used data from Table 2 to evaluate the HC2 response surface as a function of the synthesis parameters. The
best-fit surface was assessed with the software STATISTICA from StatSoft neglecting third-order interactions between the synthesis parameters31, as per the following quadratic polynomial:
superconducting transition width ΔTC, irreversibility field Hirr at 10 K, upper critical field HC2 at 10 K, lattice
The best-fit values of the coefficients “ Ai ” were evaluated by the least squares method and are listed in Table 3.
For the RSM-DoE, we kept the Ar-jet pressure constant to its maximum value.
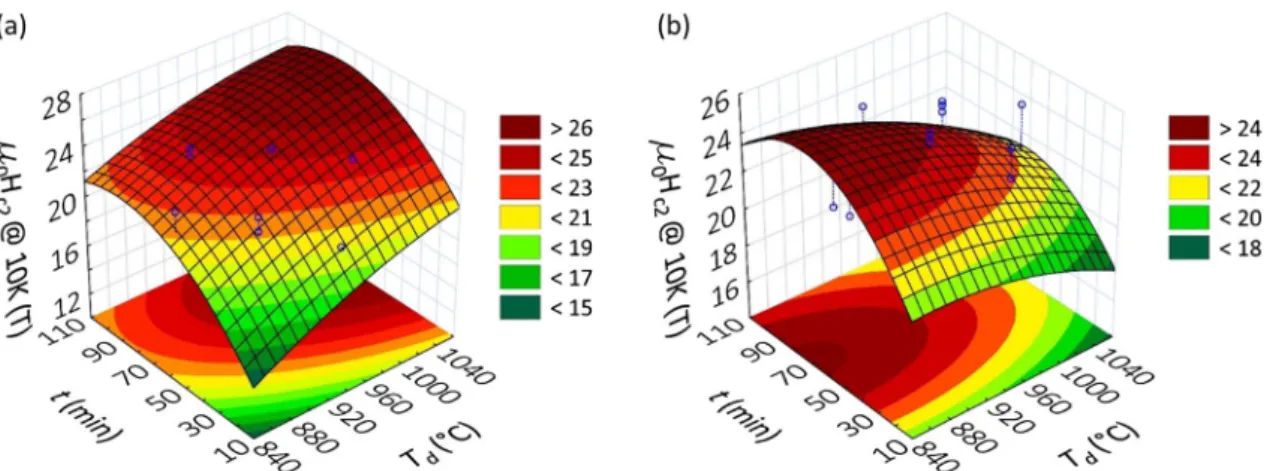
Equation (1) allowed us to identify the input-parameter combinations that maximize HC2 at 10 K. HC2(Td,H
R,t,P) presents maxima in two synthesis-parameter regions characterized by: (1) high reaction temperature and
low pressure (Td > 900 °C and P < 250 MPa), (2) low reaction temperature and high pressure (Td < 900 °C and
P > 250 MPa). In order to allow the visualization the two maxima, panels (a) and (b) of Fig. 1 report two slices of the HC2(Td,HR,t,P) response surface performed at HR = 700 °C/min and P = 125 MPa, HR = 1000 °C/min and
P = 375 MPa, respectively. The highest maximum (µ0HC2 ~ 26 T) is expected when combining high Td and low P.
Based on the predictions of the RSM DoE, we prepared further 7 samples selecting synthesis conditions favorable for HC2. Details about the preparation conditions for this “post-DoE” batch are reported in Table 10 of Methods.
Superconducting and lattice parameters are reported in Table 4.
The manufacturing process adopted in this work includes the flattening by uniaxial pressing of the SS tube filled with the precursors. It has been shown that non-hydrostatic cold-deformation processes may lead to a (1) µ0HC2(Td, HR, t, P) = A0+A1Td+A2Td2+A3HR + A4HR2+A5t + A6t2
+A7P + A8P2+A9TdHR + A10Tdt + A11TdP + A12HRt
+A13HRP + A14tP.
Table 2. Main properties of the 26 samples of the Response-Surface-Methodology Design of Experiment:
critical temperature TC, superconducting transition width ΔTC, irreversibility field Hirr at 10 K, upper critical
field HC2 at 10 K, lattice parameters a and c. The estimated standard deviation for a and c is 0.0001 Å for all
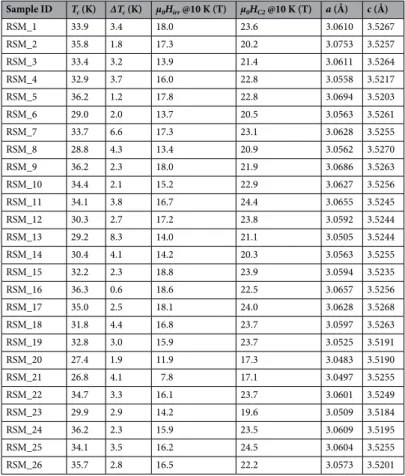
samples. Sample ID Tc (K) ΔTc (K) μ0Hirr @10 K (T) μ0HC2 @10 K (T) a (Å) c (Å) RSM_1 33.9 3.4 18.0 23.6 3.0610 3.5267 RSM_2 35.8 1.8 17.3 20.2 3.0753 3.5257 RSM_3 33.4 3.2 13.9 21.4 3.0611 3.5264 RSM_4 32.9 3.7 16.0 22.8 3.0558 3.5217 RSM_5 36.2 1.2 17.8 22.8 3.0694 3.5203 RSM_6 29.0 2.0 13.7 20.5 3.0563 3.5261 RSM_7 33.7 6.6 17.3 23.1 3.0628 3.5255 RSM_8 28.8 4.3 13.4 20.9 3.0562 3.5270 RSM_9 36.2 2.3 18.0 21.9 3.0686 3.5263 RSM_10 34.4 2.1 15.2 22.9 3.0627 3.5256 RSM_11 34.1 3.8 16.7 24.4 3.0655 3.5245 RSM_12 30.3 2.7 17.2 23.8 3.0592 3.5244 RSM_13 29.2 8.3 14.0 21.1 3.0505 3.5244 RSM_14 30.4 4.1 14.2 20.3 3.0563 3.5255 RSM_15 32.2 2.3 18.8 23.9 3.0594 3.5235 RSM_16 36.3 0.6 18.6 22.5 3.0657 3.5256 RSM_17 35.0 2.5 18.1 24.0 3.0628 3.5268 RSM_18 31.8 4.4 16.8 23.7 3.0597 3.5263 RSM_19 32.8 3.0 15.9 23.7 3.0525 3.5191 RSM_20 27.4 1.9 11.9 17.3 3.0483 3.5190 RSM_21 26.8 4.1 7.8 17.1 3.0497 3.5255 RSM_22 34.7 3.3 16.1 23.7 3.0601 3.5249 RSM_23 29.9 2.9 14.2 19.6 3.0509 3.5184 RSM_24 36.2 2.3 15.9 23.5 3.0609 3.5195 RSM_25 34.1 3.5 16.2 24.5 3.0604 3.5255 RSM_26 35.7 2.8 16.5 22.2 3.0573 3.5201
Table 3. Best-fit values of the coefficients Ai of the HC2 response surface at 10 K, as per Eq. (1).
A0 = − 9.978E+01 T A5 = 3.251E−01 T min−1 A10 = − 1.062E−04 T °C−1 min−1
A1 = 1.912E−01 T °C−1 A6 = − 1.285E−03 T min−1 A11 = − 1.388E−04 T °C−1 MPa−1
A2 = − 6.767E−05 T °C−2 A7 = 1.063E−01 T MPa−1 A12 = 1.646E−05 T °C−1
A3 = 1.575E−02 T min °C−1 A8 = 1.141E−05 T MPa−2 A13 = 3.447E−05 T min °C−1 MPa−1
partial texturing of the MgB2 crystallite c-axis along the applied-pressure direction32,33. All samples from this
study were investigated with the magnetic field perpendicular (⊥) to the uniaxial-pressure direction. Selected samples with the best in-field performances were further investigated for magnetic fields parallel (//) to the pres-sure direction. This short list includes samples from the RSM DoE (samples RSM_1, RSM_17, RSM_25) and from the post-RSM-DoE batch (samples M_1 and M_3). Obtained HC2 and HIrr, as evaluated at 10 K for the two
orientations of the field, are reported in Table 5. In polycrystalline samples, R(H) measurements allow one to probe HC2 for fields perpendicular to the crystallographic c axis, HC2⊥c , regardless of the applied-field direction.
Since H⊥c C2>H
//c
C2 , upon decreasing the applied field R(H) starts devting from its normal state value as soon as
H ≤ H⊥c
C2 , because grains with the c-axis perpendicular to the external-field direction become superconducting
and do not contribute to the electrical resistance anymore. The variability between HC2 values of Table 5 measured
for the two field orientations is below ~ 5% and has to be considered as an experimental uncertainty inherent to the procedure adopted to determine HC2. HIrr is expected to be independent of the magnetic-field orientation in
untextured samples, whilst a dependence is expected in textured or weakly-textured specimens34. In particular,
Figure 1. HC2(Td,t) response surface at 10 K in the synthesis-parameter ranges where the DoE predicts the
presence of relative maxima. Panel (a) is a slice of the HC2(Td,HR,t,P) surface for fixed values of HR (700 °C/min,
“0” in coded units) and P (125 MPa, “α−” in coded units). From this plot it is deduced that at low pressure HC2
is maximized for Td 950 °C and 60 min t 90 min. Panel (b) is a slice of HC2(Td,HR,t,P) for fixed values of
HR (1000 °C/min, “+” in coded units) and P (375 MPa, “α+” in coded units). From this plot it is deduced that at
high pressure HC2 is maximized for Td 950 °C and 60 min t 90 min.
Table 4. Superconductivity and lattice parameters of the “post-RSM-DoE” sample batch. Estimated standard
deviation for a and c is 0.0001 Å for all samples.
Sample ID Tc (K) ΔTc (K) Hirr @10 K (T) HC2 @10 K (T) a (Å) c (Å) M_1 35.2 2.2 20.0 24.9 3.0579 3.5232 M_2 33.7 5.7 11.8 23.2 3.0610 3.5266 M_3 35.9 1.7 19.1 23.7 3.0754 3.5258 M_4 37.3 0.6 16.2 20.2 3.0813 3.5257 M_5 36.9 0.9 16.4 21.8 3.0777 3.5265 M_6 37.2 0.6 14.4 19.2 3.0807 3.5268 M_7 37.4 0.7 16.7 22.1 3.0811 3.5297
Table 5. HIrr and HC2 values as measured in a selection of samples for two different orientations of the
magnetic field, parallel and perpendicular to the uniaxial pressure direction.
Sample ID µ0Hirr (10 K) ⊥ (T) µ0Hirr (10 K) // (T) µ0HC2 (10 K) ⊥ (T) µ0HC2 (10 K) // (T)
RSM_1 18.0 18.8 23.6 23.0
RSM_17 18.1 17.0 24.0 24.9
RSM_25 16.2 16.7 24.5 23.4
M_1 20.0 17.1 24.9 26.2
higher HIrr should be measured when H is perpendicular to the uniaxial-pressure direction34. In the case of the
sample M_1, we measured HIrr higher by ~ 15% in this orientation. This difference is above the measurement
uncertainty of ~ 5% and is an indication of weak c-axis texturing along the applied-pressure direction34.
Discussion
Record high H
C2and H
Irr.
Figure 2 presents the temperature (T) dependence of HC2 (panel (a)) and HIrr(panel (b)) for the best-performing samples from this work listed in Table 5. For comparison, we included in the plot the curves corresponding to the polycrystalline sample with the highest HC2 from [10], which was prepared
with a nominal C content x = 0.1 (hereafter, we refer to this sample as “[10]_0.1”). No texturing is expected for [10]_0.1 as it was reacted in the absence of any external pressure. We highlighted in the graph two zones associ-ated with temperatures higher (white background) or lower (grey background) than 4 K. At T ≥ 4 K, the rapid-synthesis route allowed us to achieve HC2 values comparable with the record-high HC2 of [10]_0.1, for various
combinations of the synthesis parameters. This is good news because it indicates that the synthesis conditions leading to μ0HC2 above 30 T at 4.2 K and above 23 T at 10 K can be adapted to consider specific manufacturing
requirements. Furthermore, data from [10] represent the result of a single experiment that was never replicated. At T ≥ 4 K, HC2 measured in the sample M_1 in parallel field overcomes that of the sample [10]_0.1 and thus
set a new record for HC2 in MgB2 bulk samples. At T < 4 K, the HC2(T) curves of samples from this work stay all
below that of [10]_0.1. Furthermore, we do not observe any sudden increase of HC2 at T 2 K. The temperature
dependence of HIrr is reported in Fig. 2b. Samples reacted by the rapid-synthesis route exhibit higher HIrr with
respect to [10]_0.1. The difference is up to ~ 8 T in the case of the sample M_1. This result is important for appli-cations since HIrr defines the operational limits in superconducting magnets. HIrr seems to extrapolate linearly
down to T = 0 K. In the case of untextured MgB2 bulk samples prepared by standard synthesis routes, it is
typi-cally observed HIrr ~ 0.5 HC235,36. Data of Tables 1, 2 and 4 allow one to deduce that ~ 70% of the samples from
this work have HIrr 0.7 HC2. In the framework of the anisotropic Ginzburg–Landau theory, HIrr of untextured
samples is described by:
(2) HIrr= HC2⊥c γ2−1 p2 c+1 ,
Figure 2. Temperature dependence of the upper critical field (a) and of the irreversibility field (b) for the
best-performing samples from this work. Data of the record-high HC2 bulk sample from10 are reported for
where γ=H⊥c
C2/H
//c
C2 is the upper-critical field anisotropy, and pc is the percolation threshold, which represents the
minimum superconducting-grain fraction for a continuous path through the superconductor34,37. In granular
superconductors, pc depends on the coordination number, i.e., on the average number of grain first neighbors
(that in turn depends on the grain packing density), but also on the presence of insulating spurious phases. pc
can thus be considered as an indicator of the electrical connectivity, K, in a superconductor: the higher pc, the
lower K. Data of Table 5 show that the difference in HIrr measured for the two orientations of H is clearly above
the experimental uncertainty only in the case of the sample M_1. For the other samples listed in Table 5, we can in a first approximation assume that texturing effects are negligible and make use of Eq. (2) to evaluate pc. The
low-temperature value of γ can be estimated from the sample critical temperature by the following empirical expression valid also for C-doped samples, which was derived in18,38 comparing results obtained in a large set
of samples with different TC:
Here tc = Tc/Tc0 and Tc0 = 39.43 K is the TC expectation for samples in the clean limit18,38. Having estimated γ ,
pc can be calculated by Eq. (2) using for HC2⊥c and HIrr the experimental results reported in Table 5, averaging the
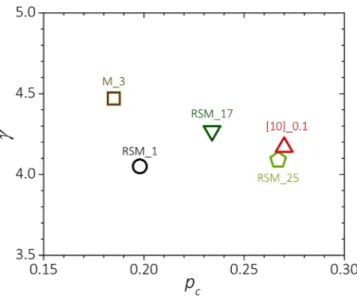
values obtained in the two field orientations. Figure 3 reports pc and γ evaluated at 10 K using Eqs. (2) and (3).
Samples prepared by the rapid-synthesis route have pc smaller than that of sample [10]_0.1. Reported values are
more generally low even when compared with further results from the literature for pc , which is typically 0.25
for C-doped samples37–40. This result indicates that the higher H
Irr measured in the samples prepared with the
rapid synthesis route has to be ascribed to a better electrical connectivity between the superconducting grains. This conclusion is further supported by the high values measured for the sample mass density. About 90% of the samples prepared in this work have mass density 2.1 g/cm3, which is ~ 80% of the theoretical value for MgB
241.
Effects of C doping on the crystal structure and electronic properties.
We evaluated by X-ray powder diffraction experiments the a and c lattice parameters for all the samples produced in this campaign. Values are reported in Tables 1, 2 and 4. On the atomic scale, C can be substituted for B in the MgB2 crystalstructure, or remain interstitial within B rings22,23. Using the MgB
2 phase as a reference state, the enthalpy of
formation at 0 K is negative in the case of C substitution, positive for interstitial C23. Therefore, substitutional
insertion is energetically favored. C atoms can also be segregated outside the superconducting grains, thus impacting extrinsic superconducting properties such as grain connectivity or vortex pinning21,42. Experimental
and theoretical works have shown that lattice parameter a decreases upon augmenting x in bulk Mg(B1−xCx)2
samples, whilst c remains nearly constant22,23. In Mg(B
1−xCx)2 films, both a and c are observed to increase with
the C-doping content22,23. Figure 4a reports the experimental dependence of a on the nominal amount of C
doping. We included in this chart a binary sample (BIN-STD_1) and three IMD bulk samples reacted in our laboratory using a conventional muffle furnace (STD_0.01, STD_0.025, STD_0.1), binary and DWCNT-doped samples from [10] ([10]_ BIN, [10]_0.01, [10]_0.025, [10]_0.05, [10]_0.1), and a selection of samples from the RSM DoE, that are representative of the a variability in our experiment. Samples reacted with conventional fur-naces both from this work and from the literature show that a decreases upon increasing the nominal amount of C. However, a saturates at values approaching ~ 3.065 Å for x ~ 0.1, as also reported in42–45. The rapid-synthesis
route leads to a large variability of a in spite of the same nominal doping (x = 0.1). Very interestingly, most of (3) γ = t 2 c +16.7tc(1 −tc) 3.88 − 3.724tc .
Figure 3. Low-temperature upper-critical-field anisotropy (γ) and percolation threshold pC calculated as
described in the text for the samples RSM_1, RSM_17, RSM_25, M_3 from this work and the record-high-HC2
the samples prepared with this process have a < 3.065 Å, indicating that the rapid-synthesis route allows for the substitution of a larger fraction of C into the B sites, at a same nominal doping. As a general trend, we found that low a values are typically associated with high Td. The fact that high dwell temperatures are beneficial for C
sub-stitution in MgB2 agrees with further results from the literature44,46. A dedicated study would be needed to draw
definitive conclusions about the microscopic mechanisms that lead to a more efficient C substitution when using the rapid-synthesis route. On the other hand, we can infer that the rapid heating and cooling (quench), which are unique characteristics of the employed route, play a certain role in enhancing the C-substitution efficiency with respect to conventional synthesis methods. In particular, it is possible that the C segregation out of the grains during a slow cooldown is hindered by the post-reaction quench.
Comparison between neutron-diffraction experiments and X-ray analyses has previously demonstrated that the actual level of C substitution in Mg(B1–xCx)2 can be estimated as x≈7.5⋅Δ(c/a), where Δ(c/a) is the change
in c/a compared to a pure sample21,44,47. The variation of a as a function of the actual substituted-C content is
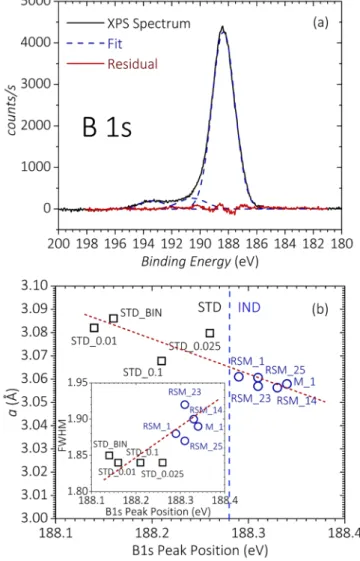
reported in Fig. 4b. Effective C substitution up to 90% of the nominal DWCNT content is reached with the rapid-synthesis route. The effectiveness of this route in substituting C for B is further confirmed by XPS, which we carried out on a batch of five samples prepared by the rapid-synthesis route (RSM_1, RSM_14, RSM_23, RSM_25, M_1) and four samples prepared using a standard furnace (STD_BIN, STD_0.01, STD_0.025, STD_0.1). Fig-ure 5a shows the B 1s spectrum for the sample M_1, together with the result of least squares fitting of the spectrum considering pure Gaussian-line shapes, in agreement with previous reports48,49. The B 1s spectrum is
composed of three peaks centered at ~ 188.3 eV, ~ 190.5 eV and ~ 193.5 eV. In agreement with other XPS reports, we assign the main peak located at 188.3 eV to B in MgB2, and the two peaks at 193.5 eV and 190.5 eV to B2O3
and other contaminants of B, respectively11,48,50,51. The B 1s spectra of all measured samples are qualitatively
similar and show only a single broad peak associated with MgB2 or Mg(B1−xCx)2. Interestingly, as shown in
Fig. 5b, the binding energy of this peak increases as the a lattice constant contracts. Samples reacted with the rapid-synthesis route which have a < 3.065 Å exhibit a B 1s peak position located at up to ~ 0.2 eV higher bind-ing energy compared to the samples with the larger a values. This bindbind-ing-energy change can be attributed to
Figure 4. Dependence of the a lattice parameter on the nominal C content (a) and with the effective substituted
C content (b). The two panels include data from this work and from10. Lattice parameter uncertainty is smaller
the shift of the Fermi level due to the additional electrons doped into the system when substituting C for B20,47.
Therefore, Fig. 5b provides further evidence that substitutional C doping is higher for the samples prepared by the rapid-synthesis route. Since, as shown in Fig. 4, effective substitution in our samples is always less than 0.1, the maximum Fermi-level shift of ~ 0.2 eV is consistent with the value of ~ 0.3 eV theoretically predicted for effective x = 0.152. The inset of Fig. 5b reports the best-fit values of the full width at half maximum (FWHM) as
a function of the peak position for the B 1s peak attributed to MgB2. The FWHM increases with the binding
energy, which could be due to an increasing contribution from a peak component associated with B-C bonding, further confirming the increased substitution of C in the MgB2 lattice.
Correlation between H
C2and T
Cwith the a lattice parameter.
Substituted, interstitial orintergranu-lar C can affect differently the intraband and interband scattering rates. C substitution should primarily lead to an increase of the σ-band intraband scattering, whilst grain boundaries should affect the scattering rates on both σ and π bands24. No study reports on the role of the energetically unfavorable interstitial C on the scattering
rates. The lattice parameter a can be used as a sort of caliper to measure the C substitution in the MgB2 lattice.
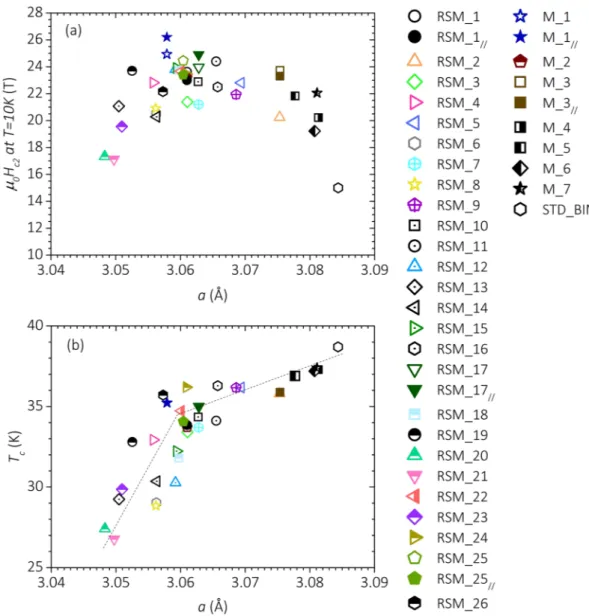
Figure 6a shows the correlation between HC2 at 10 K and a for all samples investigated in this study. Starting from
the binary sample located at the bottom-right corner of the chart, one observes that HC2 initially increases upon
lowering a, it reaches a maximum when a ~ 3.06 Å and finally decreases for a 3.06 Å. The enhancement of HC2
upon increasing the effective C doping has to be mainly ascribed to an increased intraband scattering, as further documented in the literature15,16,20. The introduction of C atoms in the MgB
2 structure also leads to a reduction
of TC, which is steeper for a 3.06 Å as shown in Fig. 6b. Band filling due to electron doping is expected to
lower TC53. In particular, a linear decrease of TC with x in Mg(B1−xCx)2 is theoretically predicted for doping levels
up to x ~ 0.15, if changes in the bands and phonon spectrum due to the elemental doping are considered53. Our
Figure 5. (a) XPS B 1s spectrum of sample M_1 along with the Gaussian-peak best-fit curves. A linear
background has been subtracted from the raw spectrum before fitting. (b) Variation of the lattice parameter
a with the main-peak position of the B 1s spectrum. The inset shows the correlation between the main-peak
experimental observation that the slope of the TC vs a dependence changes for a 3.06 Å, which corresponds to
x ~ 0.08, suggests that the effects of interband scattering cannot be ruled out in our series of samples, at least for
those samples with a 3.06 Å. The enhancement of the interband scattering rate because of substitution of C for B has been further documented in the literature15,53. In spite of the loss in condensation energy due to the lower
TC, moderate levels of lattice deformation characterized by a in the range ~ 3.06 Å to ~ 3.08 Å lead to a net gain in
terms of HC2. A further decrease of the lattice parameter a (a 3.06 Å) results in a reduction of HC2. Analogous
conclusions are drawn when analyzing the evolution of HC2 at 4.2 K with a.
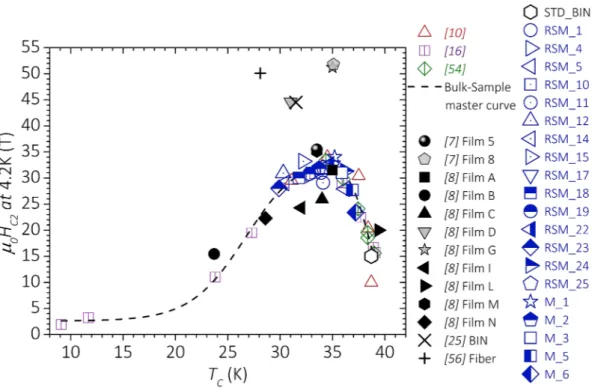
Figure 7 reports the correlation between HC2(4.2 K) and TC. We included in the chart all samples from this
work investigated at T = 4.2 K and data available in the literature for C-doped10,54 and irradiated bulk samples16,55.
A binary bulk prepared in our laboratory (STD_BIN) was added as a reference. In order to allow a comparison with the results obtained in films, we also included data of C-doped films7,8, of a high-disorder binary film25,
and of a 0.75 μm-thick polycrystalline coated conductor deposited on SiC fibers that all showed µ0HC2 ~ 50 T56.
In the case of the films, we reported only HC2 data measured with the field parallel to the surface (the highest
values). Indeed, R(H) experiments carried out on polycrystalline samples provide an estimation of H⊥c C234. In
bulk samples, HC2 is maximized when TC is in the range 34 K ± 2 K, regardless of the specific source of disorder
(C doping, irradiation, synthesis conditions). All experimental HC2(4.2 K) data of bulk samples can be predicted
from TC with an uncertainty below ~ ± 20% by an asymmetric 2-sigma function (dashed curve in Fig. 7):
(4) µ0HC2(4.2K) = A+B∗ 1/ 1 + exp(−(TC−T0+w1/2)/w2) ∗ 1 − 1/ 1 + exp(−(TC−T0−w1/2)/w3) .
Figure 6. Correlation between HC2 at 10 K (a) and TC (b) with the lattice parameter a. The highest HC2 values
are achieved when a is ~ 3.06 Å. For the same a value, a marked change in the slope of the TC vs a dependence is
The parameters’ best-fit values and their statistical errors, as determined by least squares fitting, are A = 2.6 T ± 1.5 T, B = 31.2 T ± 2.4 T, T0 = 32.5 K ± 0.3 K, w1 = 12.0 K ± 0.7 K, w2 = 2.4 K ± 0.5 K, w3 = 1.1 K ± 0.2 K.
The dashed curve of Fig. 7 can be considered as an empiric master curve for the HC2 vs TC dependence in MgB2
bulk samples in which disorder has been induced by doping, irradiation or synthesis conditions. At odds with what observed in bulk MgB2, a large variability of HC2 is found for films with similar TC. No correlation between
HC2 and the lattice constants a or c is reported for C-doped films7,8. What is thus the origin of the very-high
upper critical field (μ0HC2(4.2 K) > 40 T) measured in MgB2 films? We found that only three samples out of all the
C-doped films reported in the literature have measured HC2(4 K) values distinctly above the bulk-sample master
curve7,8. C doping cannot be considered the only key to achieve high H
C2 because the binary film from25 prepared
by pulsed-laser deposition showed μ0HC2(4.2 K) ~ 44.5 T. Therefore, even if this and other studies prove that C
doping can significantly enhance HC2 with respect to binary samples, there has to be a specific “type of disorder”
able to unlock much higher HC2 values. The two-band theory suggests that HC2 can be significantly enhanced
at low temperatures if the π band is dirtier than the σ band15. In this case, an upward curvature of H
C2 vs T is
expected. Contrary to what reported in10, our results do not give evidence of an upward curvature of H
C2(T)
at low T. This indicates that C substitution in Mg(B1−xCx)2 does not selectively increase the π-band intraband
scattering rate, in agreement with theoretical expectations24. In view of the lower amount of substituted C in the
samples from10 with respect to those from this work, one could argue that interstitial C is at the origin of the
observed upward curvature. However, the presence of interstitial C was not proven in10 and C should be more
probably segregated outside the superconducting grains45. We found that the films of Fig. 7 that have H
C2 above
the bulk-sample master curve share a fiber texture, which is characterized by a rotational degree of freedom of the crystallographic a axis around the c axis57. No information about the type of texture is reported for the film
8 from7, which has μ
0HC2(4.2 K) ~ 52 T. Zhu et al. observed in their film a tilt at the nanometric scale of the c axis
induced by C doping and pointed it out as the possible cause of the very-high HC224. This kind of disorder may
likely perturb the B pz orbitals from which the π band arises12,24, and possibly enhances selectively the intraband
scattering in this band. It is possible that the same kind of lattice distortion is achieved in those of the C-doped films that present a fiber texture along the c axis. c-axis disorder due to nanometric inclusions was also reported for the binary MgB2 film showing record-high HC225,58. Further studies about the correlation between
micro-structural properties of films and HC2 should be carried out to achieve a more complete understanding of the
mechanisms responsible of the record HC2 values. This study points out that in bulk samples the introduction
of disorder by different sources enhances both the intraband and interband scattering rates leading to an upper limit for μ0HC2(4.2 K) of ~ 35 T. In the case of the thin films and of the coated conductor deposited on SiC fibers,
it is another type of structural defect that leads to μ0HC2(4.2 K) ~ 50 T, while keeping TC above 25 K.
Figure 7. Correlation between HC2 (4.2 K) and TC for bulk samples from this work and from the literature. The
dashed line represents the best fit curve of all experimental data obtained in bulk samples, as described in the text.
Conclusions
We presented the results of a wide experimental campaign to investigate the role of carbon doping in the enhance-ment of HC2 in MgB2 bulk samples. The main purpose of this work was understanding whether the very-high
μ0HC2 values of ~ 50 T at 4.2 K, as observed in disordered films, can also be achieved in polycrystalline samples.
This would allow widening the application domain of MgB2 in magnet technology. Based on theoretical and
experimental evidences that structural disorder is the key to enhance HC2, we produced samples by a
rapid-synthesis route, which allowed us to explore ranges of variation of the rapid-synthesis conditions not achievable with traditional techniques. In particular, we quenched the synthesis process with the idea of freezing the system in out-of-equilibrium configurations. The study was guided by a Design of Experiment. This statistical tool allowed us to characterize the HC2 surface response as a function of the synthesis parameters. We defined different regions
of the synthesis-parameter space that maximize HC2. Experimental HC2 data reflected with good precision and
reproducibility the predictions of the DoE. X-ray and XPS analyses demonstrated that the rapid-synthesis route allows us to reach levels of C substitution in the B sites not achievable with conventional manufacturing routes for bulk samples. Furthermore, we documented record-high HIrr resulting from a good electrical connectivity
between superconducting grains. This is an important result of this work, since HIrr represents the maximum field
at which a superconductor can be operated in superconducting magnets. In spite of the enhanced degree of C sub-stitution, µ0HC2 appears to be bounded to maximum values of ~ 26 T and ~ 35 T at 10 K and 4.2 K, respectively. TC
and HC2 correlate well with the contraction of the a lattice parameter. TC decreases monotonously upon increasing
the structural disorder but its variation becomes much steeper for a 3.06 Å. This value of the lattice parameter
a corresponds to the maximum of HC2, too. We also analyzed results reported in the literature for MgB2 in the
form of films and coated conductors. Contrary to the case of bulk samples, it is not possible to define a master curve that allows estimating HC2 from TC. The two-band theory for HC2 demands for selective high scattering in
the π band in order to achieve µ0HC2(4.2 K) as high as ~ 50 T. Our results indicate that C doping creates defects
that act both as intraband and interband scattering centers, which respectively affect HC2 and TC. Furthermore,
we did not observe any clear evidence of an upward curvature of HC2 at low T, as expected in the case of a π
band much dirtier than the σ band. The type of disorder present in the films that showed very-high HC2 cannot
be the same realized by C doping in bulk samples. Further investigations are needed to achieve a comprehensive understanding of this matter. Lattice deformations that produce a tilt of the c axis, which selectively affect the B pz orbitals from which the π band arises, may be the key to achieve record-high µ0HC2 in the 50 T range at 4.2 K.
Methods
Sample preparation.
In-situ MgB2 bulk samples were prepared using amorphous 99+% purity B powders,99.9+% purity Mg turnings and 90+% purity DWCNT as precursors. We added 50 wt.% Mg excess to the rea-gents with respect to the stoichiometric ratio Mg:B = 1:2, as we previously proved that this is beneficial to the electrical connectivity of the samples41. Precursors were handled in glove box under inert atmosphere (pure
Ar) to prevent oxygen contaminations. B powders (mixed with the DWCNT in the case of doped samples) were sandwiched between two Mg pellets inside an AISI-316-L stainless (SS) tube. The tube ends were closed by hydraulic press and sealed by Tungsten-Inert-Gas welding. The central part of the tube was subsequently submitted to uniaxial pressure in order to further densify the precursors before the reaction. Samples were reacted using a laboratory-made induction furnace described in29. The SS tube is inserted at the center of a
water-cooled Cu coil, which is located inside a sealed chamber filled with Ar. The Cu coil induces currents in the SS crucible that acts as a susceptor. This allows reacting the precursors within the SS sheath with ramp rates as high as ~ 1000 °C/min. After the reaction dwell time, the synthesis process can be quenched by injecting Ar-gas at high pressure (up to 1.5 MPa). The sample temperature was recorded during the reaction using a pyrometer calibrated in the range 500–1200 °C. After reaction, we removed the SS sheath and cut samples of the desired size and shape by spark erosion. Typical dimensions of the samples used for electrical transport and structural characterizations are ~ 5 × 2 × 1 mm3.
Screening DoE.
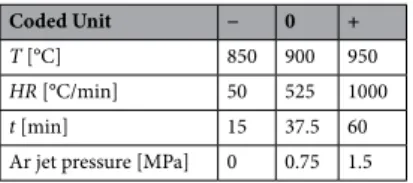
We selected a 2 k−1 fractional factorial design for the screening DoE59. 2 is the number oflevels for each factor (“−” and “ + ” in coded units) and k the number of factors or input variables. At this first stage, we let only 4 of the 5 input parameters vary, namely: heating ramp rate (HR), dwell temperature (Td), dwell
time (t), pressure of the Ar-gas quenching jet (ArP). 2 k−1 provides the number of experiments to be performed,
which is 8 in our case. To this set of experiments, we added a “center point” (“0” in coded units) that represents the center value of all factors’ ranges. We replicated this run three times, preparing 11 samples in total. Tables 6
and 7 report the range of variation of the synthesis parameters and the specific samples’ synthesis conditions, respectively. Experiments were run in randomized order to guard against systematic biases.
Samples SCR_1, SCR_6 and SCR_11 are three replicas of the DoE “center point”. Replicating the center point in a DoE provides a measure of process stability and reproducibility30. We found variations by ~ 1% for T
C, ~ 40%
for ΔTc., ~ 2% for HIrr and ~ 4% for HC2. The large spread of data found for ΔTc does not seem to play a role in
the variability of HC2. The highest HC2 values were found in samples whose synthesis process was quenched
by injecting Ar gas at the highest pressure (1.5 MPa). This outcome agrees with results found in binary MgB2
samples prepared with the same technique29. Precursors did not react to form bulk samples when combining
the lowest reaction temperature (850 °C) with the shortest dwell time (15 min). Therefore, it was not possible to characterize samples SCR_3 and SCR_5.
Response‑surface‑methodology DoE.
We selected a 2k full factorial design augmented with centerpoints and axial points (denoted by α+ and α− in coded units). Axial points are outside the input-parameter hypercube defined by the “−” and “ + ” levels. They are fundamental to build a second-order polynomial for the
determination of the response surface 31,59. We used the following four input variables: heating ramp rate (HR),
dwell temperature (Td), dwell time (t), pressure applied to the precursors before synthesis (P). On the basis of
the screening-DoE results, we fixed the Ar-jet pressure to 1.5 MPa. In view of the the low variability observed for HC2 in the screening DoE, we performed only two replicas of the DoE center point (samples RSM_1 and
RSM_7). Therefore, we performed 26 runs in total, composed by the 16 corners from the full factorial block (24),
2 replications of the center point and 8 (2k) axial points. We run the DoE in randomized order. The two center-point replicas provided comparable values for all the investigated parameters but ΔTC, which varies by ~ 3.2 K in
the two samples. Tables 8 and 9 report the range of variation of the synthesis parameters for all samples prepared in the frame of this DoE. The RSM DoE allowed us to evaluate the response surface of HC2(10 K) as a function
of the four input variables. Based on the surface response predictions, we prepared further 7 samples with the aim of maximizing HC2 and verifing the predictions of the DoE. Preparations conditions for samples belonging
to this “post-RSM-DoE batch” are reported in Table 10. Samples M_1 and M_2 are localized in proximity of the high-Td and low-P maximum of the synthesis-parameter space, samples M_3 and M_4 to the low-Td and
high-P one. The response surface extrapolates towards high µ0HC2 of ~ 25 T at pressures higher than the upper
boundary of the explored range (P > 375 MPa) for Td < 900 °C. Samples M_5, M_6 and M_7 were prepared
fol-lowing this indication for different combinations of HR and t. These samples resulted fragmented once extracted from the SS sheath, most probably because of the excessive stress exerted by the SS-crucible walls on the reacted MgB2 bulk sample during the post-reaction quench. However, it was still possible to characterize them. We did
not investigate HC2 in an extrapolated high-Td region above 1050 °C, which according to the DoE could lead to
µ0HC2 ~ 27 T. Temperatures of ~ 1050 °C represent an upper limit for the mechanical strength of the
2-mm-thick-wall SS crucible, which has to withstand the internal overpressure from the Mg vapors. HC2 values of samples
M_1, M_2 and M_3 reproduce the RSM-DoE expectations with a precision within ~ 10%. Discrepancies up to ~ 25% are found for the three samples (M_5, M_6 and M_7) prepared at very high pressure, out of the DoE synthesis-parameter space. Synthesis conditions of M_4 vary from those of M_3 only for the dwell time (50 min in the place of 90 min). However, this sample showed a lower µ0HC2 (by ~ 3.5 T) and a higher TC (by ~ 1.4 K) with
Table 7. Synthesis conditions (in coded units) of all the samples prepared for the Screening DoE. Coded units
refer to Table 6. SCR_4 3 − − + + SCR_5 1 − − − − SCR_6 0 0 0 0 0 SCR_7 2 + − + − SCR_8 4 + − − + SCR_9 5 − + + − SCR_10 6 + + − − SCR_11 0 0 0 0 0
Table 8. Range of variation of the synthesis parameters for the Response-Surface-Methodology DoE. Factors Coded Units α− − 0 + α+ T [°C] 850 900 950 1000 1050 HR [°C/min] 100 400 700 1000 1300 t [min] 20 40 60 80 100 P [MPa] 125 187.5 250 321.5 375
respect to M_3, indicating that the dwell time plays an important role in enhancing the C-doping efficiency at low Td < 900 °C.
In‑field electrical transport characterization.
We investigated the samples’ electrical resistance (R) as a function of T and H by standard 4-wire measurements. Most of the samples were tested at the University of Geneva using a laboratory-made low-noise probe60,61. We also designed and commissioned at the University ofGeneva a dedicated low-noise probe to fit the 35 T magnet bore of the LNCMI facility in Grenoble. Both probes allow measuring up to 4 samples at the same time and choosing the samples’ orientation with respect to the H direction. Each sample was powered with excitation current in the range 1–10 mA in order to avoid heating effects. The voltage drop was amplified to increase the signal-to-noise ratio and measured with a nanovoltmeter. To determine the field dependence of the electrical resistance R(H), we swept the field at a constant rate of ~ 1 T/ min. The probing current density was ~ 5 × 10⁻² A/cm2. The R(H) dependence was investigated for fixed T values
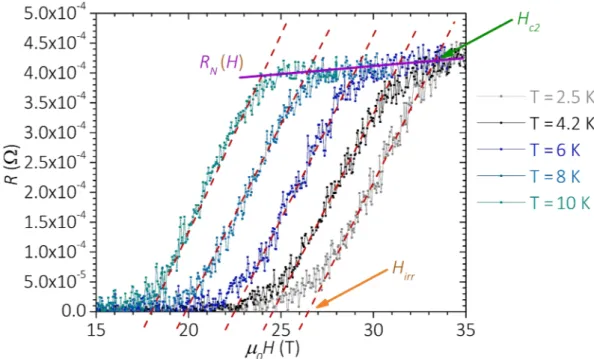
stabilized with a precision of ± 10 mK. The R(H) curves, as measured at different temperatures in the sample RSM_17, are reported in Fig. 8 for the sake of clarity. HC2 and HIrr were evaluated from the intersection of the
linear fit of the superconducting transition with the normal-state RN(H) and the R = 0 lines, respectively. The
Table 9. Synthesis conditions (in coded units) of all the samples prepared for the
Response-Surface-Methodology DoE. Coded units refer to Table 8.
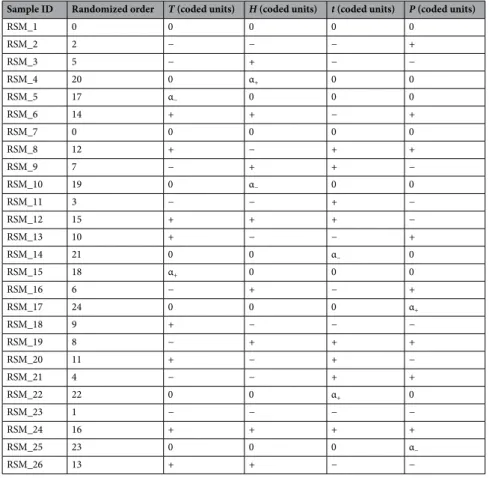
Sample ID Randomized order T (coded units) H (coded units) t (coded units) P (coded units)
RSM_1 0 0 0 0 0 RSM_2 2 − − − + RSM_3 5 − + − − RSM_4 20 0 α+ 0 0 RSM_5 17 α− 0 0 0 RSM_6 14 + + − + RSM_7 0 0 0 0 0 RSM_8 12 + − + + RSM_9 7 − + + − RSM_10 19 0 α− 0 0 RSM_11 3 − − + − RSM_12 15 + + + − RSM_13 10 + − − + RSM_14 21 0 0 α− 0 RSM_15 18 α+ 0 0 0 RSM_16 6 − + − + RSM_17 24 0 0 0 α+ RSM_18 9 + − − − RSM_19 8 − + + + RSM_20 11 + − + − RSM_21 4 − − + + RSM_22 22 0 0 α+ 0 RSM_23 1 − − − − RSM_24 16 + + + + RSM_25 23 0 0 0 α− RSM_26 13 + + − −
Table 10. Synthesis conditions (in coded units) for the 7 samples of the post-RSM-DoE batch. Coded units
refer to Table 8.
Sample ID T (coded unit) HR (coded unit) t (coded unit) P (coded unit)
M_1 + 0 0.9 α+ α− M_2 + − 0.9 α+ α− M_3 α− + 0.9 α+ α+ M_4 α− + 0.5 α+ α+ M_5 α− + 0.9 α+ 2α+ M_6 α− + 1.2 α+ 2α+ M_7 α− 0 0.9 α+ 2α+
sample critical temperature (TC) was evaluated from the R(T) curves acquired at H = 0. TC is defined as the
tem-perature at which the derivative dR/dT has a maximum. The width of the superconducting transition is defined as ΔTC = T90%–T10%, where T90% and T10% are the temperatures at which R(T) is 90% and 10% of the normal state
value just above the onset of the superconducting transition, respectively.
Microstructural and electronic characterization.
The samples’ microstructural properties were inves-tigated by X-ray diffraction (XRD) and scanning electron microscopy (SEM) measurements. XRD patterns were collected on the PANalytical Empyrean powder diffractometer with the Bragg–Brentano geometry using the Cu Kα1 monochromatic radiation in the 2θ range between 20° and 120°. We performed a Rietveld refinement on the X-ray patterns by means of the FullProf Suite62 in order to evaluate the MgB2 lattice parameters (a, c).
XPS measurements were performed using a Physical Electronics VersaProbe III system with a hemispherical analyser and monochromated Al Kα source. The energy scale linearity was calibrated with Au4f7/2 at 83.86 eV and Cu2p3/2 932.59 eV and data were referenced to the Ag3d5/2 peak at 368.36 eV. All data were measured at room temperature with a pass energy of 55 eV, at a take of angle of 45° and angular acceptance angle of +/− 20°. The samples were electrically grounded during measurement. The X-ray beam size on the sample was ~ 100 µm with a power of 25 W and chamber pressure was less than 1 × 10⁻⁸ mbar. All samples were polished with
sandpa-per to remove a surface layer of at least ~ 200 μm in order to remove the layer of material at the surface resulting from spark-erosion cutting. Samples were sputter cleaned in-situ with 2 kV Argon ions for 18 min. Consistently with previous studies, we verified that sputter cleaning duration did not alter significantly the binding energy or FWHM of the MgB2 B 1s peak50. Sample measurement order was randomized and measurements performed on
multiple sample positions over multiple experimental runs produced consistent results. Received: 12 August 2020; Accepted: 30 September 2020
References
1. Ballarino, A. Development of superconducting links for the large hadron collider machine. Supercond. Sci. Technol. 27, 044024 (2014).
2. Sugano, M. et al. Characterization of mechanical properties of MgB2 conductor for the superconducting link project at CERN.
IEEE Trans. Appl. Supercond. 25, 4801004 (2015).
3. Konstantopoulou, K. Electro-mechanical characterization of MgB2 wires for the Superconducting link project at CERN. Supercond.
Sci. Technol. 29, 084005 (2016).
4. Lvovsky, Y. et al. Novel technologies and configurations of superconducting magnets for MRI. Supercond. Sci. Technol. 26, 093001 (2013).
5. Iwasa, Y. Towards liquid-helium-free, persistent-mode MgB2 MRI magnets: FBML experience. Supercond. Sci. Technol. 30, 053001 (2017).
Figure 8. Resistance as a function of the magnetic field for fixed temperatures in the range 2.5–10 K. HIrr(T)
and HC2(T) are defined as the magnetic field values corresponding to the intersection of the linear fit of the
superconducting transition (dashed lines) with the superconducting −R=0− and the normal-state resistance −RN(H)− lines, respectively.
6. Patel, D. et al. MgB2 for MRI applications: dual sintering induced performance variations in in situ and IMD processed MgB2 conductors. J. Mater. Chem. C 8, 2507–2516 (2020).
7. Ferdeghini, C. et al. Upper critical fields up to 60 T in dirty Magnesium Diboride thin films. IEEE Trans. Appl. Supercond. 15, 3234 (2005).
8. Braccini, V. et al. High-field superconductivity in alloyed. Phys. Rev. B 71, 012504 (2005).
9. Tommasini, D. Nb3Sn accelerator dipole magnet needs for a future circular collider. In Nb3Sn Accelerator Magnets. Springer, Cham,
pp. 427–439 (2019).
10. Serquis, A. et al. Correlated enhancement of Hc2 and Jc in carbon nanotube doped MgB2. Supercond. Sci. Technol. 20, L12–L15 (2007).
11. Talapatra, A. et al. X-ray photoelectron spectroscopy studies of MgB2 for valence state of Mg. Physica C 419, 141–147 (2005). 12. Kortus, J. et al. Superconductivity of metallic boron in MgB2. Phys. Rev. Lett. 86(20), 4656 (2001).
13. Eskildsen, M. R. et al. Vortex imaging in the π band of magnesium diboride. Phys. Rev. Lett. 89(18), 187003 (2002). 14. Iavarone, M. et al. Two-band superconductivity in MgB2. Phys. Rev. Lett. 89(18), 187002 (2002).
15. Gurevich, A. Enhancement of the upper critical field by nonmagnetic impurities in dirty two-gap superconductors. Phys. Rev. B 67, 184515 (2003).
16. Tarantini, C. et al. Effects of neutron irradiation on polycrystalline Mg11B
2. Phys. Rev. B 79, 134518 (2006).
17. Collings, E. W. et al. Prospects for improving the instrinsic and extrinsic properties of magnesium diboride superconducting strands. Supercond. Sci. Technol. 21, 103001 (2008).
18. Eisterer, M. Magnetic properties and critical currents of MgB2. Supercond. Sci. Technol. 20, R47–R73 (2007). 19. Zhu, Y. et al. Nanoscale disorder in pure and doped MgB2 thin films. Supercond. Sci. Technol. 23, 095008 (2010).
20. Angst, M., Bud’ko, S. L., Wilke, R. H. T. & Canfield, P. C. Difference between Al and C doping in anisotropic upper critical field development in MgB2. Phys. Rev. B 71, 144512 (2005).
21. Serquis, A., Pasquini, G. & Civale, L. Carbon nanotubes addition effects on MgB2 superconducting properties. In Electronic
Proper-ties of Carbon Nanotubes, 447–472 (InTech, 2011).
22. Bengtson, A. K. et al. Impact of substitutional and interstitial carbon defects on lattice parameters in MgB2. J. Appl. Phys. 107, 023902 (2010).
23. Saengdeejing, A. et al. Effects of carbon in MgB2 thin films: Intrinsic or extrinsic. Appl. Phys. Lett. 90, 151920 (2007).
24. Zhu, Y. et al. Nanoscale disorder in high critical field, carbon-doped MgB2 hybrid physical–chemical vapor deposition thin films.
Appl. Phys. Lett. 91, 082513 (2007).
25. Gurevich, A. et al. Very high upper critical fields in MgB2 produced by selective tuning of impurity scattering. Supercond. Sci.
Technol. 17, 278–286 (2004).
26. Giunchi, G. High density MgB2 obtained by reactive liquid Mg infiltration. Int. J. Mod. Phys. B 17, 453–460 (2003).
27. Yamamoto, A. et al. Synthesis of high Jc MgB2 bulks with high reproducibility by a modified powder-in-tube method. Supercond.
Sci. Technol. 17, 921–925 (2004).
28. Xu, D. et al. Microstructure and superconducting properties of nanocarbon-doped internal Mg diffusion-processed MgB2 wires fabricated using different boron powders. Supercond. Sci. Technol. 29, 045009 (2016).
29. Matera, D. et al. Rapid synthesis of MgB2 by inductive heating. IEEE Trans. Appl. Supercond. 28(47), 6200405 (2018).
30. Bowden, G. D. et al. A design of experiments (DoE) approach accelerates the optimization of copper-mediated 18F-fluorination reactions of arylstannanes. Sci. Rep. 9, 11370 (2019).
31. Box, G. E. P. & Draper, N. R. A Basis for the Selection of a Response Surface Design (Taylor & Francis, Milon Park, 2012). 32. Häßler, W. Anisotropy of the critical current in MgB2 tapes made of high energy milled precursor powder. Supercond. Sci. Technol.
23, 065011 (2010).
33. Lezza, P. Texture gradients in Fe-sheathed ex situ produced MgB2 tapes. Supercond. Sci. Technol. 19, 286 (2006).
34. Eisterer, M. The influence of weak texture on the critical currents in polycrystalline MgB2. Supercond. Sci. Technol. 23, 034006 (2010).
35. Gümbel, A. et al. Improved superconducting properties in nanocrystalline bulk MgB2. Appl. Phys. Lett. 80(15), 2725 (2002). 36. Yamamoto, A. et al. Universal relationship between crystallinity and irreversibility field of MgB2. Appl. Phys. Lett. 86, 212502
(2005).
37. Eisterer, M. et al. Current percolation and anisotropy in polycrystalline. Phys. Rev. Lett. 90, 247002 (2003).
38. Eisterer, M., Emhofer, J., Sorta, S., Zehetmayer, M. & Weber, H. W. Connectivity and critical currents in polycrystalline MgB2.
Supercond. Sci. Technol. 22, 034016 (2009).
39. Yamamoto, A. et al. Limiting factors of normal-state conductivity in superconducting MgB2: an application of mean-field theory for a site percolation problem. Supercond. Sci. Technol. 20, 658 (2007).
40. Grinenko, V. et al. Superconductivity in porous MgB2. Solid State Commun. 138, 461–465 (2006).
41. Matera, D. et al. Electrical connectivity in MgB2: the role of precursors and processing routes in controlling voids and detrimental secondary phases. IEEE Trans. Appl. Supercond. 27, 6200806 (2017).
42. Serrano, G. et al. SiC and carbon nanotube distinctive effects on the superconducting properties of bulk MgB2. J. Appl. Phys. 103, 023907 (2008).
43. Serranno, G. & Serquis, A. Single wall carbon nanotubes addition effects on the superconducting properties of MgB2. Int. J. Mod.
Phys. B 23(17), 3465–3469 (2009).
44. Avdeev, M., Jorgensen, J. D., Ribeiro, R. A., Bud’ko, S. L. & Canfield, P. C. Crystal chemistry of carbon-substituted MgB2. Physica
C 387(3–4), 301–306 (2003).
45. Wei, J. et al. Structure and superconductivity of MgB2-carbon nanotube composites. Mater. Chem. Phys. 78, 785–790 (2003). 46. Dou, S. X., Yeoh, W. K., Horvat, J. & Ionescu, M. Effect of carbon nanotube doping on critical current density of MgB2
supercon-ductor. Appl. Phys. Lett. 83(24), 4996 (2003).
47. Wilke, R. H. T. et al. Systematic effects of carbon doping on the superconducting properties of Mg(B1-xCx)2. Phys. Rev. Lett. 92(21), 217003 (2004).
48. Answal, D. K. Degradation behavior of MgB2 superconductor. Physica C 363, 208–214 (2001).
49. Zhang, D., Davalle, D. M., O’Brien, W. L. & McIlroy, D. N. The chemical composition of as-grown and surface treated amorphous boron carbon thin films by means of NEXAFS and XPS. Surf. Sci. 461, 16–22 (2000).
50. Garg, K. B. et al. Core level photoemission study of polycrystalline MgB2. Solid State Commun. 131, 343–347 (2004).
51. Ueda, A., Yamamoto, H. & Naito, M. Synthesis and photoemission study of as-grown superconducting MgB2 thin films. Physica
C 378–381, 225–228 (2002).
52. Kasinathan, D., Lee, K.-W. & Pickett, W. E. On heavy carbon doping of MgB2. Physica C 424, 116–124 (2005).
53. Kortus, J., Dolgov, O. V., Kremer, R. K. & Golubov, A. A. Band filling and interband scattering effects in MgB2: carbon versus aluminum doping. Phys. Rev. Lett. 94, 027002 (2005).
54. Wilke, R. H. T. et al. Synthesis and optimization of Mg(B1-xCx)2 wire segments. Physica C 424, 1–16 (2005).
55. Gandikota, R. et al. Effect of damage by 2 MeV He ions and annealing on Hc2 in MgB2 thin films. Appl. Phys. Lett. 87, 072507 (2005).
56. Ferrando, V. et al. High upper critical field and irreversibility field in MgB2 coated-conductor fibers. Appl. Phys. Lett. 87, 252509 (2005).
Brighi, who helped us to define the best setup for collecting the XRD patterns. Many thanks to Dr. G. Bovone for the very fruitful scientific discussions and to Dr. A. Fête for his suggestions on the Design of Experiment.
Author contributions
D.M. and M.B. contributed equally to this paper. D.M. manufactured the samples, conducted the DoEs, per-formed the X-ray and current-transport experiments, analyzed the XPS spectra, and prepared the figures of the manuscript. M.B. organized the results of the different experimental campaigns, prepared the manuscript, and contributed to the current-transport experiments. R.Č. supervised the X-ray experiments and analyses. S.M.W. performed the XPS experiments and supervised the XPS analysis. F.B. helped with the current-transport meas-urements. D.L. and X.C. contributed to set up the current-transport experiment at the LNCMI in Grenoble. E.G. supervised the preparation of the samples with the inductive furnace. C.S. directed and supervised the whole research, contributed to the manuscript preparation and to the measurement campaign performed in Grenoble. All authors reviewed the manuscript.
Competing interests
The authors declare no competing interests.
Additional information
Correspondence and requests for materials should be addressed to M.B. Reprints and permissions information is available at www.nature.com/reprints.
Publisher’s note Springer Nature remains neutral with regard to jurisdictional claims in published maps and
institutional affiliations.
Open Access This article is licensed under a Creative Commons Attribution 4.0 International
License, which permits use, sharing, adaptation, distribution and reproduction in any medium or format, as long as you give appropriate credit to the original author(s) and the source, provide a link to the Creative Commons licence, and indicate if changes were made. The images or other third party material in this article are included in the article’s Creative Commons licence, unless indicated otherwise in a credit line to the material. If material is not included in the article’s Creative Commons licence and your intended use is not permitted by statutory regulation or exceeds the permitted use, you will need to obtain permission directly from the copyright holder. To view a copy of this licence, visit http://creat iveco mmons .org/licen ses/by/4.0/.