HAL Id: hal-01415120
https://hal.archives-ouvertes.fr/hal-01415120
Submitted on 14 Dec 2016
HAL is a multi-disciplinary open access
archive for the deposit and dissemination of
sci-entific research documents, whether they are
pub-lished or not. The documents may come from
teaching and research institutions in France or
abroad, or from public or private research centers.
L’archive ouverte pluridisciplinaire HAL, est
destinée au dépôt et à la diffusion de documents
scientifiques de niveau recherche, publiés ou non,
émanant des établissements d’enseignement et de
recherche français ou étrangers, des laboratoires
publics ou privés.
Optical diagnostics of dusty plasmas during nanoparticle
growth
Maxime Mikikian, Safa Labidi, Erik von Wahl, Jean-François Lagrange,
Thomas Lecas, Véronique Massereau-Guilbaud, Isabelle Géraud-Grenier, Eva
Kovacevic, Johannes Berndt, Holger Kersten, et al.
To cite this version:
Maxime Mikikian, Safa Labidi, Erik von Wahl, Jean-François Lagrange, Thomas Lecas, et al.. Optical
diagnostics of dusty plasmas during nanoparticle growth. Plasma Physics and Controlled Fusion, IOP
Publishing, 2017, 59 (1), pp.014034. �10.1088/0741-3335/59/1/014034�. �hal-01415120�
nanoparticle growth
M Mikikian1 , S Labidi1 , E von Wahl2 , J F Lagrange3 ‡, T Lecas1 , V Massereau-Guilbaud3 , I G´eraud-Grenier3 , E Kovacevic1 , J Berndt1 , H Kersten2 and T Gibert1 1GREMI, UMR7344 CNRS/Univ. Orl´eans, F-45067 Orl´eans, France
2
University of Kiel, IEAP, D-24118 Kiel, Germany
3
GREMI, UMR7344 CNRS/Univ. Orl´eans, F-18020 Bourges, France E-mail: maxime.mikikian@univ-orleans.fr
20 September 2016 Abstract.
Carbon-based thin films deposited on surfaces exposed to a typical capacitively-coupled RF plasma are sources of molecular precursors at the origin of nanoparticle growth. This growth leads to drastic changes of the plasma characteristics. Thus, a precise understanding of the dusty plasma structure and dynamics is required to control the plasma evolution and the nanoparticle growth. Optical diagnostics can reveal some particular features occurring in these kinds of plasmas. High-speed imaging of the plasma glow shows that instabilities induced by nanoparticle growth can be constituted of small brighter plasma regions (plasmoids) that rotate around the electrodes. A single bigger region of enhanced emission is also of particular interest: the void, a main central dust-free region, has very distinct plasma properties than the surrounding dusty region. This particularity is emphasized using optical emission spectroscopy with spatiotemporal resolution. Emission profiles are obtained for the buffer gas and the carbonaceous molecules giving insights on the changes of the electron energy distribution function during dust particle growth. Dense clouds of nanoparticles are shown to be easily formed from two different thin films, one constituted of polymer and the other one created by the plasma decomposition of ethanol.
Optical diagnostics of dusty plasmas during nanoparticle growth 2 1. Introduction
Dusty plasmas are fascinating media revealing very complex interactions between dust particles and between dust particles and the plasma. The presence of nanoparticles or dust particles in a plasma is a quite common situation. These large particles (with respect to ions and electrons) can be deliberately produced by using appropriate plasma chemistries and conditions or unintentionally obtained due to an uncontrolled nucleation in the gas phase or the injection of wall or electrode fragments. These multicomponent plasmas are then called dusty (or complex) plasmas [1–3] and the presence of this additional massive species induces the existence of many new phenomena. Dusty plasmas are easily encountered in many different fields as in astrophysics [4–7], thermonuclear fusion plasmas [8–10] and industrial plasmas [11, 12]. The knowledge of chemical and physical processes at the origin of nanoparticle formation, growth and dynamics is thus of major interest and needs to be investigated both theoretically and experimentally.
Capacitively-coupled radio-frequency (ccrf) dis-charges are convenient setups to implement precise in-situ diagnostics that can reveal the fundamental pro-cesses involved in dusty plasmas. In order to form nanoparticles, two main approaches are used, either through the injection of a molecular precursor or by sputtering a thin film deposited on the electrodes. Sev-eral molecular precursors can be used, originally in the gas state (Silane [11, 13], HMDSO [14, 15], acety-lene [16–20], or methane [6, 21–23]. When dust parti-cles are obtained by sputtering a thin film, the plasma ions impinging the surfaces exposed to the plasma are injecting reactive species in the gas phase. Then, these molecules behave in a rather similar way than an in-jected reactive gas and enter in reaction pathways lead-ing to nanoparticle growth. Many materials can be easily sputtered in this way: graphite [24–26], tungsten [25, 27], polymers [3, 28] or other materials [25, 29, 30]. In the present study, thin film sputtering is the chosen method to grow dense nanoparticle clouds. As nanoparticles are growing in the plasma, they get electrically charged and strongly disturb the electron distribution function. Thus, changes in plasma and discharge characteristics contain a footprint of the growth process. These modifications can be detected using non-intrusive optical diagnostics. In this paper, we show that normal or high-speed imaging and optical emission spectroscopy with spatiotemporal resolution are interesting techniques to reveal some impressive phenomena occurring in dusty plasmas. A focus is proposed on particular instabilities (rotating plasmoids) occurring during dust particle growth and on the complex dust cloud structure containing a central dust-free region (the void) with different plasma
properties. More generally, this work shows that dense dust particle clouds can be easily obtained from thin film sputtering.
2. High-speed imaging of plasma emission instabilities during dust particle growth
Due to the presence of dust particles affecting the plasma equilibrium, dusty plasmas are media where many different types of instabilities can appear. Usually, these instabilities can be detected easily by any plasma or discharge diagnostics. In some particular cases, high-speed imaging is able to reveal unstable phenomena that are not detectable with other diagnostics. It is for example the case of a particular behavior that we called the carousel instability [31] and consisting of millimeter size regions of enhanced emission (plasmoids) rotating around the electrode circumference. These experiments are performed in the PKE-Nefedov reactor, a ccrf discharge in push-pull mode (both electrodes are powered), where nanoparticles are grown by sputtering a thin film composed of polymer microparticles (melamine formaldehyde) and grown nanoparticles from previous experiments. This film present on the electrodes is sputtered by an Ar plasma created at ∼ 4 W and ∼ 1.5 mbar (without gas flow).
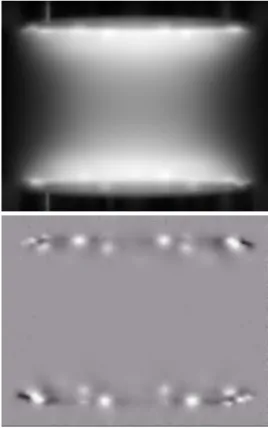
The carousel instability is not well-detected by the diagnostics integrating global changes of plasma or discharge properties. Indeed, the plasma is not globally changing during the rotation of these regions, it is just the places of enhanced emission that are moved. Plasmoids have been observed in several typical laboratory discharges [31–38] but their origin is still unclear. They seem to be favored by electric field disturbances as they are observed in grid holes [37] or preferentially close to guard rings encircling electrodes [31–33]. In this last case, the number of plasmoids can vary and their regular rotation around the circumference of the electrodes has been reported [31–33]. Other kinds of rotating instabilities are known to occur in dusty or electronegative plasmas that are related to the void rotation [25, 39, 40], to rotating plasmoids in the middle of the interelectrode region [38] or to a more general rotation of the entire plasma [41]. In the present experiments, the regular rotation of plasmoids has been obtained during dust particle growth instabilities (DPGI) [25, 28, 39, 42, 43] and detected thanks to high-speed imaging at a few thousands frames per second (fps). An example is given in figure 1 where 8 plasmoids in the vicinity of each electrode are rotating clockwise. This figure shows an extracted raw image from the movie taken at 5000 fps and the filtered image where the background plasma emission has been removed. As it can be seen,
Figure 1. Rotating plasmoids during DPGI. Eight plasmoids in front of each electrode are moving with a clockwise rotation. Raw image and the filtered one after background subtraction. The background is obtained by averaging plasma emission over time (at least during a complete plasmoid rotation).
plasmoids are difficult to detect in the raw image as their light is superimposed on the bright presheath emission. The 8 plasmoids have a typical size of about 3 mm and they take the path around the electrodes in about 25 ms corresponding to a typical speed ∼ 5 m/s. This relatively high speed confirms the difficulty to detect them using classical 25 fps cameras.
This carousel instability is quite tricky to obtain as the occurrence and the number of plasmoids is highly fluctuating during DPGI. In addition, they are not always rotating so clearly and more irregular behaviors can be observed [33].
During an experiment, a single plasmoid rotating around the bottom electrode has been obtained. A slight change in the applied RF power changed its rotation speed. A change from 3.3 W to 4 W with steps of about 0.1 W, leads to a slight gradual increase of the speed from 7 m/s up to 7.4 m/s. Even if this change is relatively small, it is significant and further experiments are required to better characterize the dynamics and structure of these plasmoids. Indeed, several questions arise from these observations. They are related to the origin of the plasmoids, the physical phenomenon inducing their rotation (as no magnetic field is voluntarily applied), the presence or not of
nanoparticles inside the plasmoids (are they similar to usual voids observed in dusty plasmas?) and finally to the plasma properties inside them. In this context, future experiments will be conducted using different laser diagnostics to improve our understanding of this surprising phenomenon.
3. Imaging of the dust cloud: the void
In many discharges, especially in ccrf discharges, a main dust-free region appears in the center of the plasma [3, 20, 25, 44–51]. This void is the consequence of an equilibrium between an outward ion drag force pushing away the negatively charged dust particles and an inward electric force [45]. This region has been studied with micrometer size dust particles under microgravity conditions [47, 52] or using an additional force like thermophoresis in on-ground experiments [53]. In dust forming plasmas, due to the submicron size of the dust particles, the gravity is not the predominant force and this region can be observed more easily. This region is of particular interest as it is involved in fundamental aspects of dust particle growth and plasma stability. Indeed, it has been shown that this dust-free space enables the growth of successive generations of dust particles while a new nucleation cannot occur in regions already filled with dust particles [14, 17, 21, 46, 48, 54–56]. The abrupt transition between these two regions creates a relatively unstable equilibrium characterized by the occurrence of a wide variety of self-excited instabilities of the void [45, 57–60].
The plasma properties inside the void are drastically different from the dust containing plasma surrounding it. This difference is easily observed to the naked eye by just looking at the plasma glow. When the grown dust particle density is relatively high, the void appears to be a region of enhanced emission [39, 51, 61] as shown in figure 2. The light emission properties are connected to the plasma parameters, especially to the electron density and temperature, and to the species created in the volume. In sputtering discharges as in the PKE-Nefedov reactor, the emission from produced molecules has also to be taken into account in addition to the buffer gas emission. Optical Emission Spectroscopy (OES) is then a very useful non intrusive diagnostics to get insights on the plasma properties in the dusty region and inside the void. 4. Optical emission spectroscopy during dust particle growth
Optical emission spectroscopy is a relatively simple diagnostics to implement in many plasma discharges. Nevertheless, the analysis of the obtained spectra is
Optical diagnostics of dusty plasmas during nanoparticle growth 4
Figure 2. Picture of the plasma glow emission in the presence of grown dust particles except in the central part of the plasma where a very bright dust-free region (void) is formed.
always relatively challenging. Its application to dusty plasmas can provide interesting information on the plasma changes induced by the growing dust particles [61]. As the structure of a growing dust particle cloud is changing continuously, a spatiotemporal analysis of the plasma emission is required. For this purpose, two optical lenses concentrate the light of the 3 cm high plasma on a bundle of 32 optical fibers mounted on a 1 cm vertical line. The plasma emission is then analyzed by a spectrometer with a focal length of 500 mm and a CCD detector of 400x1340 pixels. A 600 lines/mm grating is used as a good compromise between wavelength resolution and observed range.
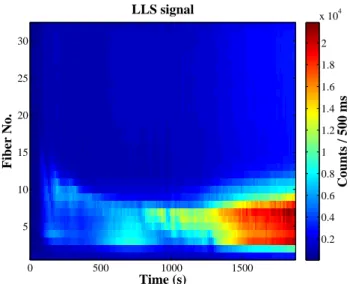
Before analyzing directly the plasma emission, the spectrometer is used to follow dust particle growth by looking at the signal at 685 nm corresponding to the light scattered by the nanoparticle cloud illuminated by a laser sheet. As shown in figure 3, a Laser Light Scattering (LLS) signal starts to be detected at around 80 s after the plasma ignition. It is observed nearly simultaneously in the plasma center (fiber 20) and bottom edge (the laser light sheet was not optimized to observe the upper part of the interelectrode space). As dust particles are growing, they start moving downwards (from ∼ 200 s to ∼ 1000 s) due to gravity leaving a huge central dust-free region. Then, they accumulate in the discharge bottom part between the sheath and the plasma center.
Knowing the dust cloud spatial distribution in the discharge, the atomic and molecular species present in the plasma can be considered. As dust particle growth is obtained from the sputtering of a melamine formaldehyde film, several carbonaceous molecules are observed as C2(Swan band system around 516.52 nm),
CN (violet system around 388.34 nm) and CH (Ger¨o band around 431.42 nm). OES in the visible range
Time (s) Fiber No. LLS signal 0 500 1000 1500 5 10 15 20 25 30 Counts / 500 ms 0.2 0.4 0.6 0.8 1 1.2 1.4 1.6 1.8 2 x 10⁴
Figure 3. Laser Light scattering signal at 685 nm collected by the 32 fibers and the optical emission spectrometer. Dust particles start to be detected at about 100 s close to the plasma center. As they grow, the gravity drags them downwards close to the presheath region where they accumulate.
cannot provide information on higher mass molecules. Those can be investigated using mass spectrometry [2, 16,23] or absorption techniques [5,17,23,62], the latter being also able to give absolute species concentration. While the spatiotemporal evolution of CH is more difficult to connect to dust particle growth, CN and C2 behave similarly in a way that can be connected
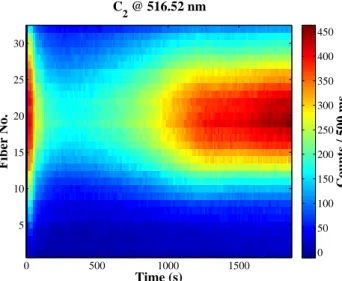
to dust particle growth kinetics. As shown in figure 4, the strong C2 emission is mainly located in the
plasma center region and not in the presheath regions. The emission intensity rapidly increases in the plasma center as soon as the plasma is ignited. After 50 s, the intensity starts to decrease until 300 s also corresponding to the time where the high emission region has the smallest size. Then, a continuous increase in the emission intensity is observed. In first approximation, the line intensity is connected to the species density. More precisely, to the population of the upper level of the observed transition, which is function of the electron density and energy. Self-absorption is considered as constant during the experiment. As carbon is involved in dust particle growth, its density is highly changing during this process and the evolution in figure 4 can be due: first to an important increase of the carbon species density due to plasma sputtering, then to an important consumption of C2 due to dust
particle growth, and finally to an equilibrium between carbon molecule production and a smaller consumption in the slow surface deposition phase of the growth [2]. Two hypotheses could be suggested to explain the fact that the C2 emission is mainly observed in the
center. First, growing dust particles present in the rest of the plasma can trap C2 molecules in their vicinity
Time (s) Fiber No. C 2 @ 516.52 nm 0 500 1000 1500 5 10 15 20 25 30 Counts / 500 ms 0 50 100 150 200 250 300 350 400 450
Figure 4.Intensity of the head of the C2Swan band system at
516.52 nm as a function of time for the 32 fibers.
leading to a smaller C2emission in these dusty regions.
Secondly, the void can be a region of smaller electron energy while presheaths are known to be the places of electron heating in particular when dust particles accumulate in these regions. As the excitation energy of C2 is small (∼ 2.4 eV) compared to argon, C2
could be more easily excited in the regions of colder electrons. Indeed, by comparing figures 3 and 4, it clearly appears that regions of low C2 emission are
in accordance with dusty regions evidenced by LLS. The fact that the void region contains smaller energy electrons is in accordance with previous experimental [61] and simulation works [63].
To better understand the evolution of the carbon molecule lines, several typical argon lines have been analyzed. The lines well-known to be mainly populated from the ground state by high energy electrons (as for example the 750.59 nm line requires at least 13.48 eV) have a higher emission in the presheath regions and a much weaker one in the plasma center, as expected. In addition, these lines have an increasing emission as dust particles are growing, especially in the bottom part of the interelectrode space where they accumulate. This is consistent with the considered higher electron temperature in plasmas containing dust particles [63– 70]. The above observation and the results presented in figure 4 tend to show that the dust particle presence in the plasma and the formation of the void, drastically affect the electron energy distribution function. It shows that the electron population in the void seems to be colder than in dusty regions.
In order to confirm this assumption, the ratio between two argon lines is calculated in figure 5. This ratio has been shown to be an easy method for providing information on the electron energy
Time (s) Fiber No. Ar 420.1/419.8 200 400 600 800 1000 1200 1400 1600 1800 5 10 15 20 25 30 1 1.5 2 2.5 3 3.5
Figure 5.Ratio of the 420.19 nm and 419.95 nm argon lines as a function of time for the 32 fibers.
distribution function [71–73]. These two lines at 419.95 nm and 420.19 nm (419.83 nm and 420.07 nm in air) have roughly the same ground-state optical emission cross-sections and thus their excitation due to high-energy electrons is similar. In contrast, their excitation through metastable levels is clearly different, the 420.19 line being highly favored by this process. As shown in figure 5, this ratio is close to 1 in the presheath region where dust particles tend to accumulate while it can be as strong as 3.5 in the void region. The fact that this ratio evolves during dust particle growth and its spatial distribution, confirm that higher energy electrons are mainly in the dusty regions and low energy electrons able to induce emission through metastables, are more present in the dust-free region. While a complete understanding of the time evolution of this ratio during dust particle growth has to be further improved, it is a clear confirmation of the presence of colder electrons in the void (compared to electrons in the dusty regions). 5. Dust particle growth in the ”soot” experiment
A new experimental setup has been developed in GREMI to study dust particle growth in various chemistries. This setup has been built in the framework of a project related to soot formation
from biofuels. The objective is to study in
controlled conditions, the possible formation of soot particles from a simple and typical liquid like ethanol (C2H5OH). The new chamber is 40 cm in diameter and
the electrodes are 20 cm in diameter. As in usual ccrf discharge, one electrode (the upper one) is powered with a rf generator 0-300 W, while the other one is
Optical diagnostics of dusty plasmas during nanoparticle growth 6
Figure 6. Dust cloud illuminated by a green laser at 532 nm. Dust particles are grown by sputtering a carbon-based deposited layer with an argon plasma. The thin film was the result of ethanol decomposition in an argon/ethanol plasma.
grounded. The distance between the two electrodes can be adjusted up to a distance of 10 cm. Several reactive gases can be injected, like acetylene, and the reactor is also equipped with a Controlled Evaporator Mixer allowing the injection of argon (or other gases) mixed with a vaporized liquid.
Currently, only several discharge conditions have been explored as many parameters can be tuned: rf power, total pressure, argon flow, ethanol percentage, distance between the electrodes. The formation of nanoparticles directly in the gas phase has not been obtained up to now. Nevertheless, during the Ar/ethanol plasma, the ethanol decomposition leads to the formation of a dense brown film on the electrodes. Then, a pure Ar plasma is created and the argon ion bombardment on this carbon based film induces the injection of precursors in the gas phase. As in the PKE-Nefedov reactor these molecules lead to the formation of nanoparticles easily detected through the change in the electrical characteristics of the discharge. Once they have grown to a few tens of nanometers, LLS using a laser sheet (at 532 nm) is able to reveal their presence in between the electrodes as shown in figure 6. A dense cloud is clearly visible even outside the interelectrode region. It contains different dust particle generations that are not mixed and shows two symmetric lobes. A void region cannot be clearly evidenced in this cloud, suggesting that either the discharge parameters or the reactor geometry do not favor the void appearance. It is noted that, in conditions that need to be confirmed, two symmetric voids (in each lobes) have been observed.
As in the PKE-Nefedov reactor, different types of complex instabilities have been observed, including rotating instabilities. Figure 7 shows the central part of the dust cloud containing dust particles of different sizes that are moved during a rotating instability. The very preliminary results obtained in this new reactor are promising for studying different gas chemistries leading to direct (in the gas phase) or indirect (through the sputtering of a layer formed by decomposing a gas or a vaporized liquid) nanoparticle growth. New inputs in complex plasma instabilities are also
Figure 7. Zoom in a grown dust particle cloud during plasma instabilities. Several dust particle generations are observed giving a complex cloud shape. The electrode center is localized by the maintaining tube seen in the upper part of the image. The distance between the electrodes is ∼ 4 cm.
expected. Ethanol mixtures will be first tested and many diagnostics have been installed in order to characterize the physics and the chemistry of this particular mixture plasma: an electrical probe to measure all rf parameters, a Langmuir probe with an automated linear drive, an energy resolved mass spectrometer, an optical emission spectrometer, a illuminating system with a green laser at 532 nm and both a standard CCD camera and a high-speed camera. Ex-situ diagnostics of the deposited films and grown nanoparticles will be also conducted.
6. Conclusions
These experiments show that nanoparticles can be easily obtained in typical ccrf discharges as soon as a thin film is deposited on the electrodes. These results emphasize that possible nanoparticle formation has to be considered in plasma processes using gases favoring thin film deposition or with easily sputtered plasma facing components. Unwanted dust particle growth can take place affecting considerably the plasma properties and structure, and in some conditions giving birth to uncontrolled plasma instabilities. Dusty plasmas are media revealing a rich variety of complex phenomena with a strong spatiotemporal dependence. These aspects can be detected and analyzed using appropriate optical diagnostics taking into account this dependency.
Acknowledgments
The authors would like to thank A. Petit, H. Ra-bat, S. Dozias, J. Simonneau and E. Jordano for technical assistance. The PKE-Nefedov chamber has been made available by the Max-Planck-Institute for Extraterrestrial Physics, Germany, under the
fund-ing of DLR/BMBF under Grant No. 50WM9852.
The work on the PKE-Nefedov reactor was partly supported by the French National Research Agency (ANR) project INDIGO no
ANR-11-JS09-010-01 and by the PHC PROCOPE project no
30790RL from Min-ist`eres des Affaires Etrang`eres et du D´eveloppement International (MAEDI) et de l’Education Nationale de l’Enseignement Sup´erieur et de la Recherche (MENESR). The soot experiment was partly funded by Region Centre project SuB-PPM no
2013-00085493, by the European Union FEDER project no
40321 and by the GREMI laboratory.
References
[1] Shukla P K and Eliasson B 2009 Rev. Mod. Phys. 81 25 [2] Berndt J, Kovaˇcevi´c E, Stefanovi´c I, Stepanovic O, Hong
S H, Boufendi L and Winter J 2009 Contrib. Plasma
Phys. 49107
[3] Mikikian M, Cou¨edel L, Cavarroc M, Tessier Y and Boufendi L 2010 Eur. Phys. J. Appl. Phys. 49 13106 [4] Goertz C K 1989 Rev. Geophys. 27 271
[5] Kovaˇcevi´c E, Stefanovi´c I, Berndt J, Pendleton Y J and Winter J 2005 ApJ 623 242
[6] Sciamma-O’Brien E, Dahoo P, Hadamcik E, Carrasco N, Quirico E, Szopa C and Cernogora G 2012 Icarus 218 356
[7] Meyer-Vernet N, Mann I, Chat G L, Schippers P, Belheouane S, Issautier K, Lecacheux A, Maksimovic M, Pantellini F and Zaslavsky A 2015 Plasma Phys. Control.
Fusion 57014015
[8] Winter J 2004 Plasma Phys. Control. Fusion 46 B583 [9] Arnas C, Martin C, Roubin P, P´egouri´e B, Temmerman
G D, Hassouni K, Michau A, Lombardi G and Bonnin X 2010 Plasma Phys. Control. Fusion 52 124007
[10] Krasheninnikov S I, Smirnov R D and Rudakov D L 2011
Plasma Phys. Control. Fusion 53083001
[11] Roth R M, Spears K G, Stein G D and Wong G 1985 Appl.
Phys. Lett. 46253
[12] Kortshagen U 2016 Plasma Chem. Plasma Process. 36 73 [13] Hollenstein C, Dorier J L, Dutta J, Sansonnens L and
Howling A A 1994 Plasma Sources Sci. Technol. 3 278 [14] Despax B, Makasheva K and Caquineau H 2012 J. Appl.
Phys. 112093302
[15] Garofano V, Stafford L, Despax B, Clergereaux R and Makasheva K 2015 Appl. Phys. Lett. 107 183104 [16] Deschenaux C, Affolter A, Magni D, Hollenstein C and
Fayet P 1999 J. Phys. D: Appl. Phys. 32 1876
[17] Hundt M, Sadler P, Levchenko I, Wolter M, Kersten H and Ostrikov K 2011 J. Appl. Phys. 109 123305
[18] Greiner F, Carstensen J, Kohler N, Pilch I, Ketelsen H, Knist S and Piel A 2012 Plasma Sources Sci. Technol. 21065005
[19] Kovaˇcevi´c E, Berndt J, Strunskus T and Boufendi L 2012
J. Appl. Phys. 112013303
[20] Stefanovic I, Sikimic B, Aschinger A, Berndt J, Kovacevic E and Winter J 2015 J. Phys. D: Appl. Phys. 48 385202
[21] Schauer J C, Hong S and Winter J 2004 Plasma Sources
Sci. Technol. 13636
[22] Massereau-Guilbaud V, Pereira J, G´eraud-Grenier I and Plain A 2009 J. Appl. Phys. 105 033302
[23] Ouaras K, Delacqua L C, Lombardi G, R¨opcke J, Wartel M, Bonnin X, Redolfi M and Hassouni K 2014 J. Plasma
Phys. 80833
[24] Ganguly B, Garscadden A, Williams J and Haaland P 1993
J. Vac. Sci. Technol. A 111119
[25] Praburam G and Goree J 1996 Phys. Plasmas 3 1212 [26] Arnas C, Michau A, Lombardi G, Cou¨edel L and Kumar K
K 2013 Phys. Plasmas 20 013705
[27] K K K, Cou¨edel L and Arnas C 2013 Phys. Plasmas 20 043707
[28] Tawidian H, Lecas T and Mikikian M 2014 Plasma Sources
Sci. Technol. 23065009
[29] Jellum G M and Graves D B 1990 J. Appl. Phys. 67 6490 [30] Selwyn G S, McKillop J S, Haller K L and Wu J J 1990 J.
Vac. Sci. Technol. A 81726
[31] Mikikian M, Cou¨edel L, Tessier Y and Boufendi L 2011
IEEE Trans. Plasma Sci. 392748
[32] Schulze J, Luggenh¨olscher D and Czarnetzki U 2008 IEEE
Trans. Plasma Sci. 361402
[33] Tawidian H, Mikikian M, Cou¨edel L and Lecas T 2011 Eur.
Phys. J. Appl. Phys. 5624018
[34] Mikikian M, Tawidian H and Lecas T 2012 Phys. Rev. Lett. 109254007
[35] Tawidian H, Lecas T and Mikikian M 2013 IEEE Trans.
Plasma Sci. 41754
[36] Mikikian M, Tawidian H and Lecas T 2014 IEEE Trans.
Plasma Sci. 422670
[37] Chesaux M, Howling A A and Hollenstein C 2013 Plasma
Sources Sci. Technol. 22055006
[38] Lagrange J F, G´eraud-Grenier I, Faubert F and Massereau-Guilbaud V 2015 J. Appl. Phys. 118 163302
[39] Samsonov D and Goree J 1999 Phys. Rev. E 59 1047 [40] Schulze M, von Keudell A and Awakowicz P 2006 Plasma
Sources Sci. Technol. 15556
[41] Wegner T, K¨ullig C and Meichsner J 2014 IEEE Trans.
Plasma Sci. 422572
[42] Mikikian M, Cavarroc M, Cou¨edel L and Boufendi L 2006
Phys. Plasmas 13092103
[43] Mikikian M, Cou¨edel L, Cavarroc M, Tessier Y and Boufendi L 2008 IEEE Trans. Plasma Sci. 36 1012 [44] Dorier J L, Hollenstein C and Howling A 1995 J. Vac. Sci.
Technol. A 13918
[45] Goree J, Morfill G E, Tsytovich V N and Vladimirov S V 1999 Phys. Rev. E 59 7055
[46] Mikikian M, Boufendi L, Bouchoule A, Thomas H M, Morfill G E, Nefedov A P, Fortov V E and the PKE-Nefedov Team 2003 New J. Phys. 5 19
[47] Wolter M, Melzer A, Arp O, Klindworth M and Piel A 2007
Phys. Plasmas 14123707
[48] Cavarroc M, Mikikian M, Tessier Y and Boufendi L 2008
Phys. Rev. Lett. 100045001
[49] Tadsen B, Greiner F and Piel A 2014 Phys. Plasmas 21 103704
[50] van de Wetering F M J H, Brooimans R J C, Nijdam S, Beckers J and Kroesen G M W 2015 J. Phys. D: Appl.
Phys. 48035204
[51] Qin Y, Kortshagen U R and Aydil E S 2016 J. Phys. D:
Appl. Phys. 49085203
[52] Morfill G E, Thomas H M, Konopka U, Rothermel H, Zuzic M, Ivlev A and Goree J 1999 Phys. Rev. Lett. 83 1598 [53] Rothermel H, Hagl T, Morfill G E, Thoma M H and Thomas
H M 2002 Phys. Rev. Lett. 89 175001
[54] Mikikian M, Cavarroc M, Cou¨edel L, Tessier Y and Boufendi L 2010 Pure Appl. Chem. 82 1273
[55] Hinz A M, von Wahl E, Faupel F, Strunskus T and Kersten H 2015 J. Phys. D: Appl. Phys. 48 055203
Optical diagnostics of dusty plasmas during nanoparticle growth 8
[56] van de Wetering F M J H, Nijdam S and Beckers J 2016
Appl. Phys. Lett. 109043105
[57] Mikikian M, Cou¨edel L, Cavarroc M, Tessier Y and Boufendi L 2007 New J. Phys. 9 268
[58] Mikikian M, Cou¨edel L, Cavarroc M, Tessier Y and Boufendi L 2010 Phys. Rev. Lett. 105 075002
[59] Heidemann R J, Cou¨edel L, Zhdanov S K, S¨utterlin K R, Schwabe M, Thomas H M, Ivlev A V, Hagl T, Morfill G E, Fortov V E, Molotkov V I, Petrov O F, Lipaev A I, Tokarev V, Reiter T and Vinogradov P 2011 Phys.
Plasmas 18053701
[60] Pustylnik M Y, Ivlev A V, Sadeghi N, Heidemann R, Mitic S, Thomas H M and Morfill G E 2012 Phys. Plasmas 19 103701
[61] Samsonov D and Goree J 1999 IEEE Trans. Plasma Sci. 2776
[62] Hempel F, Lopatik D, Sikimic B, Stefanovi´c I, Winter J and R¨opcke J 2012 Plasma Sources Sci. Technol. 21 055001 [63] Land V and Goedheer W J 2007 New J. Phys. 9 246 [64] Bouchoule A and Boufendi L 1994 Plasma Sources Sci.
Technol. 3292
[65] Denysenko I, Ostrikov K, Yu M Y and Azarenkov N A 2006
Phys. Rev. E 74036402
[66] Denysenko I, Berndt J, Kovacevic E, Stefanovic I, Selenin V and Winter J 2006 Phys. Plasmas 13 073507 [67] Massereau-Guilbaud V, G´eraud-Grenier I, Lagrange J F,
Tawidian H and Mikikian M 2013 IEEE Trans. Plasma
Sci. 41816
[68] Killer C, Bandelow G, Matyash K, Schneider R and Melzer A 2013 Physics of Plasmas 20 083704
[69] Bilik N, Anthony R, Merritt B A, Aydil E S and Kortshagen U R 2015 J. Phys. D: Appl. Phys. 48 105204
[70] Wegner T, Hinz A M, Faupel F, Strunskus T, Kersten H and Meichsner J 2016 Appl. Phys. Lett. 108 063108 [71] Boffard J B, Jung R O, Lin C C, Aneskavich L E and Wendt
A E 2012 J. Phys. D: Appl. Phys. 45 045201
[72] Boffard J B, Wang S, Lin C C and Wendt A E 2015 Plasma
Sources Sci. Technol. 24065005
[73] Franek J B, Nogami S H, Demidov V I, Koepke M E and Barnat E V 2015 Plasma Sources Sci. Technol. 24 034009