HAL Id: hal-01963841
https://hal-amu.archives-ouvertes.fr/hal-01963841
Submitted on 21 Dec 2018
HAL is a multi-disciplinary open access
archive for the deposit and dissemination of
sci-entific research documents, whether they are
pub-lished or not. The documents may come from
teaching and research institutions in France or
abroad, or from public or private research centers.
L’archive ouverte pluridisciplinaire HAL, est
destinée au dépôt et à la diffusion de documents
scientifiques de niveau recherche, publiés ou non,
émanant des établissements d’enseignement et de
recherche français ou étrangers, des laboratoires
publics ou privés.
Distributed under a Creative Commons Attribution| 4.0 International License
and GABAergic striatal interneurons is abolished in
Parkinson disease
N. Lozovaya, S. Eftekhari, R. Cloarec, L. Gouty-Colomer, A. Dufour, B.
Riffault, M. Billon-Grand, A. Pons-Bennaceur, N. Oumar, N. Burnashev, et al.
To cite this version:
N. Lozovaya, S. Eftekhari, R. Cloarec, L. Gouty-Colomer, A. Dufour, et al.. GABAergic inhibition in
dual-transmission cholinergic and GABAergic striatal interneurons is abolished in Parkinson disease.
Nature Communications, Nature Publishing Group, 2018, 9 (1), �10.1038/s41467-018-03802-y�.
�hal-01963841�
GABAergic inhibition in dual-transmission
cholinergic and GABAergic striatal interneurons is
abolished in Parkinson disease
N. Lozovaya
1
, S. Eftekhari
2
, R. Cloarec
2
, L.A. Gouty-Colomer
2
, A. Dufour
2
, B. Riffault
2
, M. Billon-Grand
2
,
A. Pons-Bennaceur
3
, N. Oumar
1
, N. Burnashev
3
, Y. Ben-Ari
1,2
& C. Hammond
1,3
We report that half striatal cholinergic interneurons are dual transmitter cholinergic and
GABAergic interneurons (CGINs) expressing ChAT, GAD65, Lhx7, and Lhx6 mRNAs, labeled
with GAD and VGAT, generating monosynaptic dual cholinergic/GABAergic currents and an
inhibitory pause response. Dopamine deprivation increases CGINs ongoing activity and
abolishes GABAergic inhibition including the cortico-striatal pause because of high [Cl
−]i
levels. Dopamine deprivation also dramatically increases CGINs dendritic arbors and
monosynaptic interconnections probability, suggesting the formation of a dense CGINs
network. The NKCC1 chloride importer antagonist bumetanide, which reduces [Cl
−]i
levels,
restores GABAergic inhibition, the cortico-striatal pause-rebound response, and attenuates
motor effects of dopamine deprivation. Therefore, most of the striatal cholinergic excitatory
drive is balanced by a concomitant powerful GABAergic inhibition that is impaired by
dopamine deprivation. The attenuation by bumetanide of cardinal features of Parkinson’s
disease paves the way to a novel therapeutic strategy based on a restoration of low [Cl
−]i
levels and GABAergic inhibition.
DOI: 10.1038/s41467-018-03802-y
OPEN
1B&A Therapeutics, Ben-Ari Institute of Neuroarcheology, Batiment Beret-Delaage, zone Luminy entreprises, 13288 Marseille, Cedex 09, France.
2Neurochlore, Ben-Ari Institute of Neuroarcheology, Batiment Beret-Delaage, Zone Luminy Biotech Entreprises, 13288 Marseille, Cedex 09, France.3INMED,
INSERM U901 and Aix-Marseille University, 13273 Marseille, Cedex 09, France. These authors contributed equally: Y. Ben-Ari, C. Hammond. These authors jointly supervised this work: Y. Ben-Ari, C. Hammond. Correspondence and requests for materials should be addressed to
Y.B-A. (email:ben-ari@batherapeutics.com)
123456789
C
holinergic interneurons are key modulators of striatal
microcircuit function and instrumental in the processing
and reinforcement of goal-directed and habitual
reward-related behaviors
1–6. Cholinergic interneurons that are the only
intrinsic excitatory neurons in the striatum,
fire regularly
2,5–8.
They are also the biggest striatal neurons with well-characterized
intrinsic electrical features. Cholinergic interneurons ramify
extensively within the striatum controlling the activity of
GABAergic interneurons and spiny projection neurons (SPNs),
the latter constituting the dominant striatal neuronal type and
sole striatal output
8–10. Cortical or thalamic stimulation generates
a characteristic pause response in cholinergic interneurons that
has been linked to motor learning
1,2,5,6,8. Other observations
suggest that thalamic inputs to striatal cholinergic neurons
pro-vide a neural substrate for attentional shifts and cessation of
motor activity in response to salient stimuli
1. Collectively, these
observations stress the nodal role of cholinergic neurons in motor
integrative activity. In keeping with this, in dopamine-deprived
conditions, cholinergic interneurons are hyperactive, generating
exacerbated oscillations that underlie many clinical
manifesta-tions and deleterious sequels of Parkinson’s disease (PD)
11,12.
Cholinergic interneurons are considered as a homogeneous
population in their morphological and electrical properties
dif-fering from other non-cholinergic striatal neurons. However,
genetic fate mapping studies suggest some degree of heterogeneity
within the striatal cholinergic population. Thus, adult cholinergic
interneurons are generated from the medial ganglionic eminence
expressing LIM homeobox 7 (Lhx7) but not Lhx6 in contrast to
other striatal GABAergic interneurons
13,14. However, a subset of
cholinergic neurons is derived from Lhx6-expressing precursors
and the remaining from precursors that have never expressed
Lhx6
15. In addition, medial septal origin has been recently
demonstrated
16reflecting the complexity of striatal cholinergic
networks.
We now report that half the striatal cholinergic interneurons
are in fact dual transmitter neurons, releasing acetylholine (ACh)
and
γ-aminobutyric acid (GABA), and generating mixed
mono-synaptic excitatory/inhibitory postmono-synaptic currents (PSCs) in
their targets. These dual cholinergic/GABAergic interneurons
(CGINs) have different electrical and morphological features
from other cholinergic interneurons (CINs). The cholinergic
excitatory/GABAergic inhibitory balance is perturbed by
dopa-mine deprivation in CGINs with a failure of inhibition due to
high [Cl
–]i
levels. In these conditions, CGINs are overactive with
a dramatic increase of monosynaptic CGIN–CGIN
interconnec-tions. The NKCC1 chloride importer antagonist bumetanide,
which restores low [Cl
–]i
levels, attenuates electrophysiological
and motor manifestations of dopamine deprivation, stressing the
importance of CGINs [Cl
–]i
levels, and GABAergic inhibition in
PD and paving the way to a novel non-dopaminergic treatment of
the disease.
Results
CINs and CGINs are two cholinergic interneuron populations.
Using Lhx6-iCre;RCE-EGFP mice, we
first investigated the
properties of EGFP
+cholinergic interneurons generated from
Lhx6-expressing precursors
17,18. We identified a subpopulation of
EGFP
+interneurons that were labeled by ChAT and Lhx6
(Fig.
1
a and Supplementary Fig.
1
a). ChAT and Lhx6
co-immunolabeling was also observed in wild-type (wt) mice
(Sup-plementary Fig.
1
b) validating the presence of both Lhx6-positive
and -negative cholinergic interneurons. These observations raised
the possibility that ChAT- and Lhx6-positive interneurons might
be cholinergic and GABAergic
19. To test that hypothesis, we
performed single cell reverse transcription quantitative PCR
(RT-qPCR) analysis. This revealed that EGFP
+neurons endowed with
large soma (30–50 µm), firing, and morphological properties
typical for cholinergic interneurons (Fig.
1
b) expressed ChAT and
Lhx7 messenger RNAs, but also GAD 65 (90%, n
= 10/11) and
Lhx6 mRNAs (46%, n
= 5/11) (Fig.
1
c and Supplementary Fig.
2
),
suggesting that these interneurons have indeed GABAergic
markers. We shall respectively refer to EGFP
+and EGFP
−interneurons as CGINs and CINs.
We then compared the intrinsic and morphological features of
CINs and CGINs. They shared several major common intrinsic
membrane properties but differed in that CGINs had higher sag
amplitudes in response to hyperpolarizing pulses than CINs,
lower spontaneous spiking frequency, and smaller dendritic
arbors (Fig.
1
b, d-h, Supplementary Fig.
3
, and Supplementary
Tables
1
-
3
). CINs and CGINs differed from other
non-cholinergic EGFP
+interneurons, notably fast spiking (FS), and
persistent and low-threshold spike (PLTS) interneurons, in
morphological and electrical features including ongoing spike
frequency (Fig.
1
b, f–h, Supplementary Fig.
3
, and Supplementary
Tables
2
,
3
). Therefore, CGINs and CINs have different features
but share common properties that differentiate them from other
non-cholinergic interneurons.
Strong inhibitory pause response in CGINs. The cortically
evoked pause and rebound response of cholinergic interneurons
is considered an important element in cortico-striatal
interac-tions and targeted motor behavior
2,5,6,11. We
first tested if
cortical stimulation generates a similar response in CGINs.
Extracellular cortical stimulation (5 stimuli, 50 Hz train)
evoked in CGINs large glutamatergic PSCs followed by
nico-tinic and GABAergic PSCs, reflecting the complexity of the
striatal network response to glutamatergic inputs
(Supple-mentary Fig.
4
). In non-invasive cell-attached (ca) recordings,
the stimulation triggered a burst followed by a pause and a
rebound increase of spontaneous spiking frequency (Fig.
1
i, k,
m and Supplementary Table
4
). In contrast, this stimulation
generated in CINs a significantly smaller and shorter duration
inhibitory pause and no rebound (Fig.
1
j, l, m). Interestingly,
focal applications of the GABAA
receptor agonist isoguvacine
inhibited ongoing activity in CGINs but not in CINs
(Supple-mentary Fig.
5
and Supplementary Table
5
), suggesting stronger
GABAergic signaling in the former than the latter. Therefore,
the pause response and GABAergic inhibition are more
pro-minent in CGINs than in CINs stressing their differences and
suggesting a more prominent role of the GABAergic drive in
CGINs than in CINs.
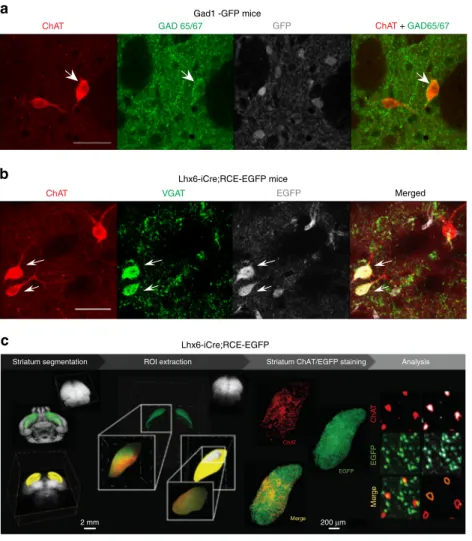
GABAergic markers expressed by CGINs. To further confirm
the GABAergic phenotype of CGINS, we examined whether
cholinergic neurons express GAD67 and/or GAD65 by
co-immunostaining for ChAT and green
fluorescent protein (GFP)
in dorso-lateral striatum slices from Gad1-GFP mice. We
detec-ted co-labelling of GAD65/67 and ChAT but no co-labeling of
ChAT and EGFP, suggesting that ChAT
+neurons might be
immunopositive for GAD65, but not for GAD67 (Fig.
2
a and
Supplementary Fig.
6
a). This was validated in wt mice where the
same overlap between ChAT and GAD 65/67 was observed
(Supplementary Fig.
6
b). To quantify CGINs, we shifted to
vesicular GABA transporter (VGAT) antibodies that have been
extensively used to label GABAergic neurons
20: 59% of ChAT
+neurons were also labeled with VGAT in Lhx6-iCre;RCE-EGFP
and wt mice (Fig.
2
b, Supplementary Fig
6
c, and Supplementary
Table
6
), indicating that they have the molecular machinery for
GABA release. Importantly, more than 95% of these ChAT
+VGAT
+cells were also positive for EGFP in
Lhx6-iCre;RCE-EGFP mice, validating Lhx6 as a marker for GABAergic features
of CGINs (Supplementary Table
6
). Collectively, these
observa-tions suggest that half of cholinergic striatal interneurons have the
ability to synthetise and release ACh and GABA.
To determine the number of CGINs and CINs in the entire
dorsolateral striatum, we used the immunolabeling-enabled
three-dimensional imaging of solvent-cleared organs (iDISCO)
clarification technique in Lhx6-iCre;RCE-EGFP mice
21,22. We
found that 53% of all ChAT
+interneurons (n
= 5617 cells) were
EGFP- positive (CGINs, n
= 2933 cells) and 47% EGFP-negative
(CINs, n
= 2684 cells) (Fig.
2
c, Supplementary Table
7
, and
Supplementary Movie
1
). Therefore, the CGIN network and its
dual transmission might have a nodal role in the operation of
striatal networks.
a
b
c
10 pA 2 s CIN PLTS CIN PLTS Frequency (Hz) *** *** *** CGIN PLTS CIN FSe
CGIN CGINf
ChAT / Lhx6 Lhx6-iCre;RCE-EGFP 0 2 4 6 8 10 20 mV 200 ms PLTS/GFP+ FS/GFP+ ChI/GFP+ ChI/GFP– CGIN CINh
Number of intersectionsRadial distance to the soma (μm) CGIN CIN 0 100 200 300 400 0 10 20 30
d
g
Gene #1 #2 #3 #4 #5 #6 #7 #8 #9 #10 #11 SPN 0 100 ChAT Lhx7 Lhx6 GAD65 200 300 400 500 600 700 20 15 10 5 0 1.1 1.0 0.9 0.8 0.7 0.6 SAG (mV) AHP (mV) Input resistance (M Ω ) CGIN CIN CIN CGIN 1 s 3 2 1 0 Spikes# (norm) 3 2 1 0 2 4 6 8 10 CIN CGIN Time (s) Before train 400 msAfter train1000 msAfter train Spikes# (norm) *** *** *** *** * *** 3.0 50 ms 20 pA 2.5 2.0 1.5 1.0 0.5 0.0 Frequency (norm)
i
j
k
l
m
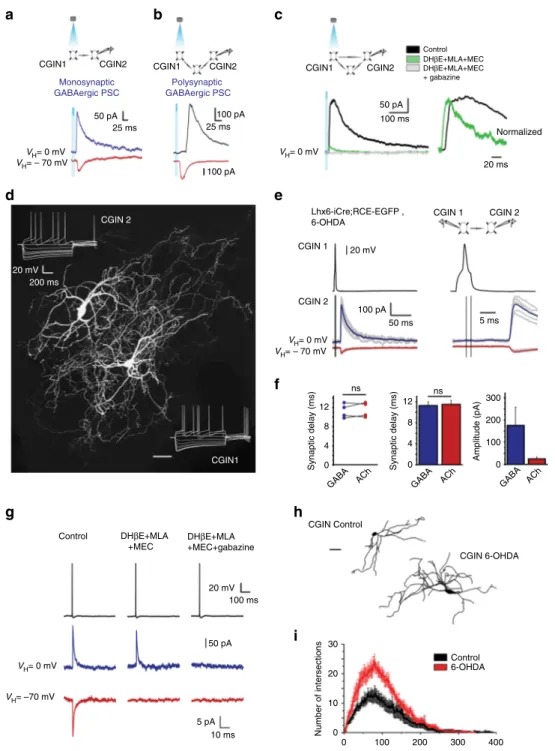
Dual ACh and GABA PSCs generated by CGINs. To test
whether CGINs generate composite cholinergic and GABAergic
PSCs, we used both EYFP and
ChAT-ChR2-EYFPxLhx6-iCre; AI14-tomato mice to identify and light
stimu-late CGINs (yellow
fluorescent protein (YFP)/tomato expression).
In these mice, 98% or 95% of EYFP
+neurons are ChAT
+,
respectively, (Supplementary Fig.
7
a and Supplementary Tables
8
and
9
). Optogenetic stimulation of presynaptic CGINs with short
(2–10 ms) focal light pulse generated a single action potential (AP)
in EYFP
+(channelrhodopsin-2 (ChR2) expressing) neurons
(Supplementary Fig.
8
). In whole-cell recordings, the same light
stimulation generated in a postsynaptic CGIN an outward
GABAergic PSC recorded at VH
= 0 mV and an inward PSC
recorded at VH
= − 70 mV (Fig.
3
a–c). It evoked a direct
mono-synaptic GABAergic PSC (12%, 10 out of 86 pairs tested, pooled
data obtained from six EYFP, and two
ChAT-ChR2-EYFPxLhx6-iCre; AI14-tomato mice, Fig.
3
a), a polysynaptic
GABAergic PSC (26%, 22 out of 86 pairs tested, Fig.
3
b), or a
composite mono- and polysynaptic GABAergic PSC (Fig.
3
c). A
cocktail of nicotinic receptor antagonists blocked the polysynaptic
but not the monosynaptic component of the GABAergic PSC
(mean amplitude 39.7 ± 8.0 pA), the latter being fully blocked by the
selective GABAA
receptor antagonist gabazine (five pairs, pooled
data obtained from six EYFP, and two
ChAT-ChR2-EYFPxLhx6-iCre; AI14-tomato mice, Fig.
3
c). The decay time
constants of mono- and polysynaptic PSCs were clearly different
(30.5 ± 0.3 ms, n
= 5 vs. 84.5 ± 11.4 ms, n = 12, P < 6 × 10
−4,
Fig.
3
c). Optogenetic stimulation of presynaptic ChAT
+cells in
ChAT-ChR2-EYFP mice also induced monosynaptic GABAergic
PSC in a postsynaptic ChAT
+neuron (Supplementary Fig.
7
a, b).
In addition, in the presence of tetrodotoxin (1 µM) to abolish
spontaneous activity and 4-AP (50 µM) to block K
+currents and
enhance release probability, optogenetic stimulation of a
pre-synaptic ChAT
+neuron generated a dual cholinergic /GABAergic
PSC in a postsynaptic ChAT
+neuron (Supplementary Fig.
9
),
demonstrating the dual release of GABA and acetylcholine by the
terminals. Therefore, CGINs generate GABAA
and ACh (nicotinic)
receptor-mediated PSCs.
To investigate the properties of CGIN–CGIN connections,
paired patch-clamp whole cell recordings of CGINs are essential.
In pair CGINs recordings in Lhx6-iCre;RCE-EGFP mice, only
one dual cholinergic/GABAergic monosynaptic CGIN-CGIN
PSCs was found (3.5%; 1/29 pairs tested, Supplementary Fig.
10
).
Therefore, in control conditions, CGINs evoke dual cholinergic/
GABAergic PSCs in other CGINs, albeit with a low probability in
pair recordings.
Dopamine deprivation strengthens CGIN
–CGIN network.
GABAergic inhibition and notably chloride regulation are
com-promised in a wide range of pathological conditions leading to an
imbalance between excitatory and inhibitory drives
23,24. We
therefore investigated whether this is also the case for ACh/
GABA co-transmission in mice that were dopamine-deprived by
intra-striatal injections of 6-hydroxydopamine (6-OHDA)
(Sup-plementary Fig.
11
). Optogenetic techniques could not be used
because of the high degree of lethality produced by 6-OHDA in
ChAT-ChR2-EYFP mice (n
= 4/4). We therefore performed pair
recordings of CGIN–CGIN cholinergic/GABAergic PSCs in the
6-OHDA dopamine-deprived striatum of Lhx6-iCre; RCE-EGFP
mice. A dual cholinergic/GABAergic PSC was observed in 22% of
paired CGIN–CGIN recordings (4/18 tested pairs) (Fig.
3
d, e).
Outward GABAergic and inward nicotinic currents were
mono-synaptic with similar delays (11.3 ± 0.7 ms and 11.5 ± 0.8 ms,
respectively, n
= 4 pairs, P = 0.12) (Fig.
3
f). The synaptic delay of
CGIN–CGIN interconnections was similar to the delay of
nico-tinic response evoked in CGINs by cortical stimulation, reflecting
recurrent activation in CGIN network (see Supplementary Fig.
4
c,
d). The nicotinic and GABAergic identities of these monosynaptic
PSCs was confirmed by their selective blockade by nicotinic and
GABAergic receptor antagonists, respectively (Fig.
3
g). Therefore,
dopamine deprivation increases about seven times the probability
of monosynaptic CGIN–CGIN connections.
This enhanced monosynaptic connectivity might be due to
reactive sprouting produced by dopamine depletion. Post-hoc
CGINs reconstruction revealed an exuberant increase of dendritic
arbor (Fig.
3
h, i and Supplementary Fig.
12
), including the
number of dendrites, dendritic nodes and tips, the total length
and the critical value (Supplementary Table
1
). The enlarged
dendritic receptive
field could facilitate connectivity by increasing
the probability of CGIN–CGIN connections. Therefore,
dopa-mine deprivation augments CGIN–CGIN interconnections.
Dopamine deprivation abolishes GABAergic inhibition in
CGINs. The failure of GABAergic inhibition in pathological
conditions often results from an impairment of chloride
co-transporters leading to high [Cl
–]i
levels
23,24. We tested whether
GABAergic inhibition is affected in a PD mouse model. Using
non-invasive ca single-channel GABA current recordings in
CGINs, the driving force for GABA currents (DFGABA) was found
more elevated in 6-OHDA-treated than in control striatum (see
Fig.
4
a–f and Supplementary Tables
10
and
11
). In line with this,
isoguvacine inhibited the spontaneous spike frequency of CGINs
in control, but not in 6-OHDA-treated striatum, suggesting a
failure of the inhibitory drive (Fig.
4
g, h, j, Supplementary
Fig.
13
a, and Supplementary Tables
12
and
13
). Bath application
of bumetanide, the specific antagonist of the chloride importer
NKCC1 that reduces [Cl
–]i
levels
23, restored isoguvacine
inhibi-tion (Fig.
4
i, j and Supplementary Table
12
). The peak frequency
distribution of CGIN spontaneous spiking was significantly
shifted to higher values with a strong increase of mean frequency
value in 6-OHDA-lesioned striatum versus control one (Fig.
4
k, l,
Supplementary Fig.
13
b, and Supplementary Tables
14
and
15
).
Fig. 1 A subpopulation of cholinergic interneurons, CGINs, expresses cholinergic and GABAergic markers. a ChAT (red) and Lhx6 (blue)
co-immunolabeling in EGFP+(green) cells in Lhx6-iCre;RCE-EGFP mice.b Top: Representative images of biocytin-filled PLTS, FS, EGFP+, and EGFP−
cholinergic interneurons (ChI) and (bottom) corresponding traces of their representativefiring patterns. c RT-qPCR heat-map expression for ChAT, Lhx7,
Lhx6, and GAD65 mRNAs in single cells (relative to HPRT mRNA; white to red: lowest to highest expression, SPN: negative control).d Representative
reconstructed CIN and CGIN dendritic trees.e Sholl analysis of CGINs and CINs dendrites. f Distinct cluster formed by CGIN and CIN from PLTS and FS
interneurons (3D plot of intrinsic properties).g Representative traces of cell-attached spontaneous spiking of CGIN, CIN, and PLTS interneuron. h
Corresponding meanfiring frequencies. i, j Top: Stimulation protocol; left: representative several superimposed consecutive i CGINs or j CINs responses to
cortical train stimulation in cell-attached mode; right: responses within the train at extended time scale. Mean frequency histograms fork CGINs and l
CINs.m Mean number of spikes during time windows after train stimulation (0–400 ms, 800–1000 ms) normalized to spikes counts before train. Scale
bars:a 20µm; b, d 50 µm. All means ± SEM. e Data sets were analyzed using Kolmogorov-Smirnov test; see Supplementary Table1for statistics.h, m Data
sets were analyzed using one-way ANOVA followed by Fisher’s least significant difference (LSD) post-hoc test; see Supplementary Table2for statistics;
Bumetanide significantly reduced spontaneous frequency in
6-OHDA-treated mice, restoring control ongoing frequency
(Fig.
4
k, l). Therefore, GABAergic inhibition is impaired in
CGINs by dopamine deprivation because of high [Cl
–]i
levels.
Dopamine deprivation abolishes the CGIN pause response. To
determine the role of [Cl
–]i
levels and GABAergic inhibition in
control and dopamine deprived mice, we used non-invasive ca
recordings of the pause-response in CGINs evoked by cortical
stimulation. In control conditions, this triggered a burst of spikes
followed by a pause (769.8 ± 74.3 ms, 6 cells, 3 mice) and a
rebound increase of spontaneous spiking frequency (Fig.
5
a, d, o,
Supplementary Fig.
13
c, and Supplementary Table
16
). The
sti-mulation evoked a similar pause-rebound response when neurons
were recorded in whole cell current-clamp (cc) with low [Cl
−]i
solution (Fig.
5
b, e, p and Supplementary Table
17
). The
inhi-bition duration was identical in non-invasive ca and whole cell
voltage clamp low [Cl
−]i
recordings (at VH
= VR) (Fig.
5
a, c). In
contrast, re-patching the same neurons in whole-cell
configura-tion (at VH
= VR) with a high [Cl
−]i
solution abolished the pause
response and the rebound, and shifted the concomitant outward
current to inward direction (Fig.
5
f–h, p). The GABA receptor
antagonist gabazine (10
μM) blocked the pause response
(Sup-plementary Fig
14
a, b and Supplementary Table
18
). Therefore,
[Cl
–]i
levels determine the polarity of the GABAergic pause
response.
A very different situation prevailed in 6-OHDA-treated mice;
the pause-rebound was abolished in ca recordings (n
= 7cells, 3
mice). Instead, cortical stimulation increased spike frequency
(Fig.
5
i, k, o and Supplementary Table
16
). Switching to whole
cell current clamp in the same neuron with low [Cl
−]i
solution
restored the pause response (Fig.
5
j, l, p). A similar restoration
of the pause was produced by bumetanide. Thus, in ca
recordings in 6-OHDA-treated mice, the pause response was
restored (mean pause duration: 452.6 ± 41.9 ms, 8 cells, 3 mice),
as well as the rebound spike frequency (Fig.
5
m, n, o and
Supplementary Table
16
). Therefore, GABAergic inhibition in
CGINs, which has a key role in the pause response, is abolished
by dopamine deprivation because of high [Cl
–]i
levels and
rescued by reducing [Cl
–]i
levels in patch recordings or by
bumetanide administration.
ChA T ChAT EGFP EGFP Me rg e Merge 2 mm 200 μmChAT VGAT EGFP Merged
Lhx6-iCre;RCE-EGFP mice
Lhx6-iCre;RCE-EGFP Gad1 -GFP mice
ChAT GAD 65/67 GFP ChAT + GAD65/67
a
b
c
Striatum segmentation ROI extraction Striatum ChAT/EGFP staining Analysis
Fig. 2 Identification and quantitative assessment of CGIN/CIN ratio in dorsolateral striatum using immunocytochemistry and iDISCO clarification
techniques.a ChAT (red), GAD65/67 (green), and GAD1-GFP (gray) co-immunostaining of coronal striatal slices from GAD1-GFP mice showing
expression of GAD65/67 in one of ChAT+cells (white arrow). Scale bar: 40µm. b ChAT (red), VGAT (green), and EGFP (gray) co-immunostaining of
coronal striatal slices from Lhx6-iCre;RCE-EGFP mice showing co-expression of VGAT and EGFP in a subset of ChAT+cells. Scale bar: 40µm. See
Supplementary Table6for statistics.c iDISCO experimental design: segmentation of the striatum, extraction of a region of interest (ROI, dorsolateral
striatum) with IMARIS software. ChAT staining (red) in representative dorsolateral striatum from Lhx6-iCre;RCE-EGFP mice. Analysis, left column:
immunofluorescence signal showing ChAT+and EGFP+Lhx6 cells; right column: cell profiler analysis with automatic cell detection (white) and cells
Bumetanide attenuates effects of dopamine deprivation. In
earlier investigations, we showed that in dopamine-deprived
conditions, SPNs that constitute over 95% of striatal neurons,
generate spontaneous single or bursts of repetitive giant
GABAergic currents ( > 200 pA)
25. These are relevant to PD
being abolished by conditions known to attenuate PD symptoms
including
L-Dopa treatment or lesion of the subthalamicnucleus
26. Applications of bumetanide or a cocktail of nicotinic
CGIN 1 CGIN 2 50 ms 4 8 12 0 Amplitude (pA) 300 200 100 0 GABA ACh Synaptic delay (ms) 0 4 8 12 GABA ACh Synaptic delay (ms) 20 mV 100 pA ns GABA ACh ns DHβE+MLA +MEC Control 5 ms CGIN 2 CGIN1 CGIN 1 CGIN 2 20 mV 200 ms VH= – 70 mV VH= 0 mV 50 pA 100 pA 25 ms 25 ms 100 pA Number of intersections 0 10 20 30
Radial distance to the soma (μm)
0
CGIN1 CGIN2 CGIN1
Lhx6-iCre;RCE-EGFP , 6-OHDA DHβE+MLA +MEC+gabazine Monosynaptic GABAergic PSC Polysynaptic GABAergic PSC 20 mV 100 ms 50 pA 5 pA 10 ms VH= 0 mV VH= –70 mV CGIN2 VH= – 70 mV VH= 0 mV 50 pA 100 ms Control DHβE+MLA+MEC DHβE+MLA+MEC + gabazine VH= 0 mV CGIN1 CGIN2 20 ms Normalized 100 200 300 400 CGIN 6-OHDA Control 6-OHDA CGIN Control
a
b
c
d
e
f
g
h
i
Fig. 3 CGINs co-release ACh and GABA in control and 6-OHDA-treated mice. a Monosynaptic, b polysynaptic, or c mixed GABAergic PSCs evoked in
postsynaptic whole cell recorded CGIN2 in response to optogenetic stimulation of presynaptic CGIN1 (control mice).c Left: Nicotinic receptor antagonists
(MEC (10µM), MLA (0.1 µM), and DHβE (10 µM)) blocked the polysynaptic but not the monosynaptic GABAergic PSC. Adding gabazine (5 µM) blocked
the monosynaptic component. Right: Superimposed and normalized polysynaptic and monosynaptic GABAergic PSCs at extended scale.d Representative
image of two identified biocytin-filled, monosynaptically-connected CGINs. e Left: Outward (GABAergic) and inward (cholinergic) PSCs evoked in
postsynaptic CGIN2 (bottom) in response to a presynaptic spike generated in CGIN1 (top); right: same traces at an extended time scale.f Individual and
averaged synaptic delays and amplitudes of GABAergic and cholinergic PSCs.g Blockade of inward and outward PSCs by nicotinic receptor antagonists and
gabazine, respectively.h Representative reconstructed CGINs dendritic trees from control and 6-OHDA-treated mice. i Sholl analysis of CGINs dendrites
from control and 6-OHDA-treated mice. Scale bar:d 50µm and h 50 µm. All means ± SEM. f Significance was determined by two-tailed, unpaired Student’s
receptor antagonists (and not mecamylamine solely
25),
sig-nificantly decreased the frequency of giant GABAergic PSCs in
SPNs (Fig.
6
a–d and Supplementary Tables
19
and
20
). Therefore,
high [Cl
–]i
levels and nicotinic receptor-mediated signals are
instrumental in the generation of the giant GABAergic currents
in SPNs in dopamine-deprived conditions.
To test whether motor symptoms of PD are also attenuated by
bumetanide, we used the roller and pole behavior tests.
6-OHDA-lesioned mice showed severe deficits in both tests, these were
rescued by chronic administration of bumetanide (Fig.
6
e, f,
Supplementary Movies
2
-
7
, and Supplementary Tables
21
and
22
). Therefore, high [Cl
–]i
levels and GABAergic inhibition
Control 6-OHDA 80 160 Counts 0 80 160 Counts 0 6-OHDA+ bumetanide Instantaneous frequency (Hz) 2 4 6 8 10 Control 6-OHDA 10 pA Isoguvacine 0 4 8 12 6 pA 0 4 8 12 Isoguvacine Time (s) 50 100 50 100 0 2 4 6 20 pA Isoguvacine Spikes # Spikes # 6-OHDA, bumetanide Time (s) 50 100 0 1 2 3 4
***
Frequency (Hz)**
Instantaneous frequency (Hz)b
a
c
2 4 6 8 10d
Superimposed 0 0 Spikes (norm) 0.4 0.8 1.2 1.6 *** *** *** *** 0.0 Control 6-OHDA 6-OHDA+ bumetanide Isoguvacine Lhx6-iCre;RCE-EGFP nsg
h
i
j
k
l
e
f
–60 –40 –20 0 –16 –12 –8 –4 0 4 8 12 0 mV –10 mV –20 mV –30 mV –40 mV +50 mV +30 mV +10 mV –30 mV –50 mV***
ns Vrest (mV) –Vp (mV) Vp (mV) DF GABA (mV) –Vp (mV) Control 6-OHDA Control 6-OHDA Vp (mV) Ip (pA) –40 –20 20 40 –1.5 –1.0 –0.5 0.5 1.0 A –Ip (pA) –80 –60 –40 –20 0 2 4 6 8 Control 6-OHDA 5 pA 1 pA Control 6-OHDA 6-OHDA+ bumetanidefailure in CGINs contribute to motor deficiency produced by
dopamine deprivation.
Discussion
Co-release of transmitters has been observed in many neuronal
systems and shown to modulate integrative functions. The
co-released transmitters may control the balance between excitatory
and inhibitory drives and exert similar or synergistic effects
27–32.
Cholinergic interneurons are the sole intrinsic excitatory neurons
in the striatum whereas all other neuronal types are GABAergic.
They are usually considered as a homogeneous population in
their intrinsic, morphological and functional features. Here we
show dual ACh and GABA co-transmission in half the striatal
cholinergic interneurons (CGINs), relying on double
immuno-histochemistry, single-cell RT-qPCR, iDISCO clarification
tech-nique, optogenetic stimulation and paired recordings. Although
cholinergic and GABAergic PSCs have similar latencies, whether
this co-transmission is due to co-release from the same terminals,
different terminals or axonal branches remains to be determined.
This dual transmission in CGINs will have to be incorporated in
models of operation of the basal ganglia networks. This
organi-zation might have been evolutionary conserved linking basal
ganglia to Central Pattern Generators
33. However, the relative
functional importance of these GABAergic inputs require further
investigation.
The suggested operation of the dual ACh/GABA
co-transmission is illustrated in a schematic diagram
(Supplemen-tary Fig.
15
). Cholinergic interneurons directly innervate various
types of GABAergic interneurons
5,34and SPNs dendritic shafts or
spines
8,9, raising the possibility of similar connections of CGINs.
Similar to CINs, CGINs are autonomous pacemakers capable of
maintaining spike activity in the absence of synaptic inputs
7. In
control conditions, interplay between dopamine innervation and
intrinsic membrane properties, restrict ongoing activity, allowing
the generation of behaviorally relevant oscillations and the pause
response to sensory cues
2,35,36. Whether the pause response is
generated by the cortex or the thalamus as suggested by Surmeier
and colleagues
1cannot be ascertained at present, but our results
are in full accord with this study in stressing the crucial role of
CGINs in the synchronization of striatal networks in relation to
sensory integration. Present results suggest that a balance between
cholinergic excitation and GABAergic inhibition has an
impor-tant role in this operation with intracellular chloride level in
CGINs being a determinant factor.
In dopamine-deprived conditions, the excitation/inhibition
equilibrium is impaired in CGINs because of high [Cl
−]i
levels
leading to the collapse of GABAergic inhibition and an unbalanced
excitatory cholinergic drive. The additional contribution of a failure
of inhibition in other interneurons—notably PLTS known to burst
when dopamine deprived
25—cannot be excluded. The pause that is
correlated with a Go signal
37, disappears in dopamine-deprived
conditions
35. The restoration of a pause by low [Cl
−]i-containing
pipettes or by bumetanide administration stresses the importance of
CGINs [Cl
−]i
levels in network dysfunction in PD models. There
are several potential links between dopamine deprivation and
fail-ure of inhibition including the well-described inflammation
pro-duced by dopamine deprivation
38, which is associated with failure
of
inhibition
39.
Mixed
cholinergic/Calretinin
(presumably
GABAergic) interneurons have been identified by
immunocy-tochemistry in humans and non-human primates
40–42.
Interest-ingly, they are more prevalent in humans and primates than in
rodents and their numbers increased in PD
40–42. Therefore, the
impairment of the GABAergic component in PD pathogenesis
might be more important in primates than rodents. The
ameli-oration of gait produced by bumetanide in a pilot open clinical
trial
43like that of pole test scores of 6-OHDA-treated mice (present
results) suggest that chloride co-transporter-based agents might be
useful in the treatment of PD symptoms.
Methods
Animals. Hemizygous Lhx6-iCre mice on a swiss genetic background (generous gift from Professor Gordon J. Fishell) were crossed with either RCE-EGFP on a swiss genetic background (generous gift from Professor Gordon J. Fishell) or AI14-tomato (B6. Cg-Gt(ROSA)26Sortm14(CAG-tdTomato)Hze/J, The Jackson Laboratory, USA) on a swiss genetic background reporter mice to yield Lhx6-EGFP
or Lhx6-tomato mice. For experiments, transgenic mice Lhx6-iCre+/−; RCE-EGFP
+/−were generated by crossing Lhx6-iCre+/−;RCE-EGFP−/−with wt swiss mice
(CE Janvier, France). For GAD immunocytochemistry, we used Gad1- GFP on a
swiss genetic background knock-in mice where GFP replaces thefirst exon of the
Gad1 gene. For optogenetic experiments, hemizygous ChAT-ChR2-EYFP mice (6. Cg-Tg(Chat-COP4*H134R/EYFP,Slc18a3)6Gfng/J, The Jackson Laboratory) on a C57BL/6J genetic background were crossed with either C57BL/6J mice (The Jackson Laboratory) or Lhx6-tomato (first generation from hemizygous Lhx6-Cre
mice crossed with homozygous AI14-tomato mice, Lhx6-iCre+/−;AI14-tomato
+/−). Genotypes of the experimental mice were ChAT-ChR2-EYFP+/−or
ChAT-ChR2-EYFP+/−; Lxh6-iCre+/−:AI14-tomato+/−. We used both male and female
mice. All experiments were performed in agreement with the European community council directives (2010/63/UE) and approved by the local ethics committee (D13 055 19).
Chronic lesion of the dopaminergic innervation of the dorsal striatum. The dopaminergic innervation of the left dorsal striatum of Lhx6-iCre;RCE-EGFP mice
(25–40 g, aged postnatal day 30 (P30) to P40) was destroyed by local stereotaxic
injection of 6-OHDA (Sigma-Aldrich, Inc., USA) under 5% ketamine (Imalgène®
1000, Merial SAS, France)/2.5% xylazine (Rompun®2%, Bayer SAS, France)
anesthesia (10μl g−1, intraperitoneally (i.p.)). Two microinjections of 6-OHDA
were performed through a NanoFIL syringe (outside diameter, 135μm; World
Precision Instruments, USA) placed into the left dorsal. For sham-operated ani-mals, we injected an equivalent volume of vehicle (sterile saline 0.9%), ascorbic acid 0.05%, pH 7.4. We performed in vitro recordings 15–20 days after lesion. The efficacy of the 6-OHDA-induced lesion of dopaminergic terminals in the striatum was determined 10 days before the recording session by apomorphine-induced
rotation (0.5 mg kg−1in 0.1% ascorbic acid, i.p.)44. We checked the extent of the
lesion after the recording session by immunohistochemical visualization of tyrosine
hydroxylase (TH) in the striatum (see Supplementary Fig.11).
Slice preparation. P30–P40 mice (25–40 g, aged P30–P40, both sexes) were
anaesthetized and killed by decapitation. The brain was rapidly removed and placed in an oxygenated ice-cold saline buffer. Sagittal 300–380 µm-thick slices
Fig. 4 Bumetanide restores GABAergic inhibition in CGINs. a Cell-attached recordings of current through single GABAAchannels with GABA (1μM) in
patch pipette in CGIN at different holding potentials.bI–V relationships of the currents through single GABAAchannels in CGINs in control and
6-OHDA-treated striatum; their reversal potential corresponds to DFGABA.c Summary plot of DFGABAof CGINs inferred from single GABAAchannels recordings.d
Cell-attached recordings of single NMDA channel current with NMDA (10μM) in patch pipette in CGINs at different holding potentials e I–V relationships
of the currents through NMDA channels in CGINs in control and 6-OHDA-treated striatum; their reversal potentials correspond to resting membrane
potentials (VR).f Summary plot ofVRof CGINs inferred from the reversal of single NMDA channels recorded in cell-attached mode.g Isoguvacine (10μM)
inhibited CGINs spontaneous activity (cell-attached recordings) in control,h but not in 6-OHDA-treated mice. i Bumetanide treatment restored inhibition
in 6-OHDA-treated mice.j Effects of isoguvacine on spike frequency (normalized to control). k Pooled instantaneous frequency distributions of CGIN
spontaneous spikes in control and 6-OHDA-treated mice with or without bumetanide treatment.l Corresponding mean frequencies of CGINs spiking
activity. All means ± SEM.c, f Significance was determined by two-tailed, unpaired Student’s t-test; see Supplementary Tables10,11for statistics.j, l Data
sets were analyzed using one-way ANOVA followed by Fisher’s least significant difference (LSD) post-hoc test; see Supplementary Tables12,14for
were cut with a vibratome in ice-cold choline solution containing (in mM): 118
choline chloride, 2.5 KCl, 0.7 CaCl2, 7 MgCl2, 1.2 NaH2PO4, 26 NaHCO3, and 8
glucose oxygenated with 95% O2and 5% CO2. Before recordings, slices were
incubated in artificial cerebrospinal fluid (ACSF) solution containing (in mM): 125
NaCl, 3.5 KCl, 0.5 CaCl2, 3 MgCl2, 1.25 NaH2PO4, 26 NaHCO3, and 10 glucose,
300 mOsm, equilibrated at pH 7.3 with 95% O2and 5% CO2at room temperature
(RT) (22–25 °C) for at least 2 h to allow recovery. For the recordings, we used an
ACSF of the same composition but containing 2 mM CaCl2and 1 mM MgCl2.
Patch-clamp recordings. Slices were transferred to the recording chamber and
perfused with oxygenated recording ACSF at 3 ml min–1at RT (22–25 °C).
ca Control 1 s ca cc, low [Cl–] 3 2 1 0 Spikes# (norm) 3 2 1 0
Repatch same cell
Spikes# (norm) 3 2 1 0 Spikes# (norm) 3 2 1 0 Spikes# (norm) 3 2 1 0 2.0 1.6 25 pA 20 mV 20 pA 50 pA 25 mV 100 pA 25 mV 50 ms 20 pA 1.2 0.8 0.4 0
Normalized frequency Normalized frequency
1.0 0
Before train
200 ms
After train 1000 ms After train
Before train 200 ms After train 400 ms After train Spikes# (norm) Spikes# (norm) wc, cc wc, vc VR= –55 mV VH=0 mV VH= –55 mV VH= –70 mV wc, cc wc, vc wc, cc VR= –55 mV VH= 0 mV VH= –55 mV VR= –55 mV low [Cl–] VH= –70 mV 2 1 0 ca ca ca ns ns ns Control 6-OHDA 6-OHDA +bumetanide Control low [Cl–] Control high [Cl–] 6-OHDA low [Cl–] *** *** *** *** *** *** *** *** *** *** *** * ca cc, low [Cl–] cc, high [Cl–] 6-OHDA 6-OHDA Bumetanide high[Cl–] low [Cl–]
a
b
c
d
e
f
g
h
i
j
k
l
m
n
o
p
Neurons were visualized using infrared differential interference contrast micro-scopy. Patch pipettes had resistances of 5–7 MΩ when filled with the “low” chloride intracellular solution (in mM): 130 K-gluconate, 10 Na-gluconate, 7 NaCl, 4 MgATP, 4 phosphocreatine, 10 HEPES, and 0.3 GTP (pH 7.3 with KOH, 280
mOsm).“High” chloride intracellular solution (in mM) contained: 107
K-gluco-nate, 23 KCl, 10 Na-glucoK-gluco-nate, 7 NaCl, 4 MgATP, 4 phosphocreatine, 10 HEPES,
and 0.3 GTP (pH 7.3 with KOH, 280 mOsm, 5–7 MΩ). Equilibrium potentials of
chloride ions were– 75 mV for the “low” and – 38 mV for the “high” chloride
solutions (25 °C). Liquid junction potentials were calculated using Clampex’s
Junction Potential Calculator (16 mV in“low Cl” solution vs. 12.4 mV in “high Cl”
solution,Δ3.6 mV) and corrected by the Pipette Offset circuitry of the amplifier.
Giant GABAergic currents were recorded with a Cs-based solution (in mM): 120
Cs-gluconate, 13 CsCl, 1 CaCl2, 10 HEPES, 10 EGTA (pH 7.3 with KOH, 290
mOsm, 5–7 MΩ).
Biocytin (final concentration of 0.3–0.5%) was added to pipette solutions to
label recorded neurons. Cells with leakage current more then 40–50 pA were
discarded.
To determine cell excitability, we recorded voltage responses (cc mode) to 1 s
current steps of− 200 to + 200 pA (10 pA increment, 3 s interval between each
step). Current–voltage (I–V) relationships were established to calculate input
resistance of cells. For the hyperpolarization-activated sag, we measured the ratio between the peak and minimal amplitudes of the voltage response. Rheobase current, the minimal current that elicits an AP, was determined using a 10 pA step. AP duration (half width) was measured at half of the maximal amplitude. After-hyperpolarization was measured at the peak.
Patch pipette solution for recordings of single GABAAchannels contained (in
mM): NaCl 20, KCl 5, TEA-Cl 20, 4-aminopyridine 5, CaCl20.1, MgCl210, glucose
10, Hepes-NaOH 10 buffered to pH 7.2–7.3., and for recordings of single
N-methyl-D-aspartic acid (NMDA) channels: nominally Mg2+-free ACSF with
NMDA (10μM) and glycine (10 μM). Pipettes had a resistance in the range of
7–10 MΩ. We performed conventional ca recordings under visual control. With 1 μM GABA in the pipette solution, after gigaseal formation ( > 3 GΩ) currents
through GABAAchannels of 1 pA were immediately visible at the potential+ 50
mV. Currents through GABAAchannels were recorded from− 50 to + 50 mV
with 10 mV increments for 1–2 minutes for each holding potential, depending on
the ongoing frequency of GABAAchannels openings, to obtain at least 20
single-channel openings for each potential. After the recording was completed, we repatched the same cells with the NMDA-containing solution. We performed ca
recordings of NMDA channels activity at various pipette potentials from− 80 to
+ 20 mV with 10 mV increments for 1–2 min. We performed analysis of single channel currents and I–V relationships using Clampfit 10.6 (Axon Instruments, Union City, CA).
Identification of recorded striatal neurons. We identified CINs by their large
soma (≥ 30 µm diameter), thick primary dendrites, and intrinsic membrane
properties. Hyperpolarizing pulses produced an initial hyperpolarization followed by a depolarizing sag followed by rebound spikes after pulse cessation. Post-hoc
examination of biocytin-filled neurons confirmed the cholinergic identity of
recorded cells. FS interneurons discharged AP in high-frequency trains. In addition to fast spikes, PLTS interneurons displayed low-threshold spikes when depolarized
from potentials near− 70 mV or after cessation of hyperpolarizing pulses (see
Fig.1b).
Extracellular stimulation. To stimulate the cortico-striatal pathway, a bipolar Ni–Cr electrode was positioned on the surface of the Corpus callosum just below
M1 motor cortex (see Supplementary Fig.4). Single or trains (5 stimuli, 50 Hz) of
current pulses (25–50 μA, 100 µs)) were delivered every 200 s through the constant
current bipolar stimulus isolator A365 (World Precision Instruments).
Optogenetic stimulation. Photo-stimulation of the light-sensitive cation channel,
ChR245,46, was performed using a micro-mirror array system (Digital
Micro-mirror Device, or DMD), which allows arbitrary spatial patterns of illumination47
and thereby photo-stimulation of spatially determined populations of presynaptic
neurons48–50. Photo-stimulation was performed with a DMD (Mosaic, Andor
Technology, UK), using a high-power light-emitting diode (CoolLED pE-4000,
CoolLED Ltd., UK). PatchMaster and Andor iQ3 softwares were used to syn-chronize the light stimulation and electrophysiological recordings. A 490 nm LED was used to activate ChR2 and thereby photo-stimulate CINs. Spatially patterned illumination was generated by the DMD and projected onto the slice via the microscope objective. The spatial pattern of illumination was digitally controlled with microsecond time resolution, by toggling each of the 777,600 (1080 × 720)
micro-mirrors within the array. A brief light pulse (2–10 ms) reliably evoked APs
in CINs (Supplementary Fig.8).
Immunohistochemistry and biocytin-filled cells revelation. To visualize
dopa-minergic innervation of the striatum, we performed immunohistochemistry of TH of slices in which we performed recordings and those immediately medial or
lateral. After overnightfixation at 4 °C in Antigenfix (Diapath, Italy), sections were
washed three times in phosphate-buffered saline (PBS, Life Technologies, USA) and incubated for 30 min at RT in PBS containing 5% normal goat serum (NGS, Jackson ImmunoResearch, Inc., USA) and 0.3% Triton X-100 (Sigma-Aldrich). Then they were incubated overnight at 4 °C with a Rabbit anti-TH polyclonal antibody (1:1000, Pel-Freez Biologicals, USA, ref. P40101-150) diluted in the same buffer. After wash with PBS, they were incubated at RT for 2 h with a Goat anti-rabbit antibody coupled to Alexa Fluor 647 (1:500, Invitrogen, USA) diluted in PBS containing 5% NGS. They were washed three times 10 min in PBS and
cover-slipped using Fluoromount-GTM(Electron Microscopy Science, USA) as mounting
medium. Electrophysiological data were taken into account only when a severe loss of TH immunoreactivity was present in the dorsal striatum in which recordings
were performed (Supplementary Fig.11).
To identify cholinergic cells, we performed immunohistochemistry using a Goat anti-ChAT antibody (1:1000, ref. AB 114 P, Millipore, USA). After 1 h incubation at RT in PBS containing 5% normal donkey serum (NDS) and 0.3% Triton X-100, slices were incubated overnight at 4 °C in the same buffer containing the primary antibody. After washing thrice for 10 min in PBS, slices were incubated for 2 h at RT with a Donkey anti-Goat antibody coupled to CY3 (1:500, Millipore) in PBS containing 5% NDS. The same procedure was followed to perform a Lhx6 staining using a Mouse anti-Lhx6 (1:50,000, Santa Cruz Biotechnology, USA, ref. sc-271433) and a Donkey anti-mouse antibody coupled to Alexa Fluor 647 (1:500, Invitrogen). To determine the GABAergic phenotype of ChAT cells, we performed a co-staining between VGAT, GAD65-67, and ChAT on striatal slices from wt and Lhx6-iCre;RCE-EGFP mice by using a Guinea Pig anti-VGAT antibody (1:500, ref 1310004, Synaptic System, Germany) and a Rabbit anti-GAD65-67 (1:500, ref AB1511, Millipore), respectively. After 30 min incubation at RT in PBS containing 1% bovine serum albumin (BSA) and 1% NDS and 0.3% Triton X-100, slices were incubated overnight at 4 °C in PBS, 1% BSA, and 0.1% Triton X-100. Slices were finally incubated for 1 h at RT with a Donkey anti-Goat Alexa Fluor 568 (1:500, The Jackson Laboratory) and a Donkey anti-guinea pig Alexa Fluor 647 (1:500, The Jackson Laboratory) or a Donkey anti-rabbit Alexa Fluor 647 (1:500, The Jackson Laboratory). To verify the selective expression of EYFP in ChAT-positive cells in ChAT-ChR2-EYFP and ChAT-ChR2-EYFPxLhx6-iCre;AI14-tomato mice, we used the same protocol as above. Striatal coronal slices were incubated with ChAT primary antibody coupled with a Donkey anti-Goat Alexa Fluor 633 (1:500, The Jackson Laboratory).
Quantification of ChAT-, VGAT-, GAD65-67-, EGFP-, and EYFP-positive cell number and assessment of colocalization was performed with Image J Software throughout the entire z-dimension of six or eight sections per brain.
To reveal biocytin, slices werefixed overnight in Antigenfix at 4 °C, slices were
washed three times in PBS, and after a 1 h pre-incubation in PBS containing 5% NGS and 0.3% Triton X-100, they were incubated overnight at 4 °C with streptavidin coupled to Alexa Fluor 555 (1:500, Life Technologies) in the same buffer. Slices were then washed three times 10 min in PBS and cover-slipped using
Fluoromount-GTMas mounting medium. To verify whether the recorded cells
were located in the 6-OHDA-lesioned region of the striatum, we combined the two types of post-hoc immunohistochemistry.
For biocytin-filled cells and TH staining detection, mosaics were acquired using an Axio Imager Z2 microscope (Carl Zeiss GmbH, Germany) using the × 10
objective (numerical aperture (NA) 0.3), and the 533–558 nm (beam splitter 570)
and 625–655 nm (beam splitter 660) wavelength for excitation of Alexa Fluor 555 and 647 (spectral detection 570–640 nm and 665–715 nm, respectively).
Fig. 5 Polarity of GABA action determines the pause-rebound response evoked in CGINs by cortical stimulation. a–n Left: Stimulation protocol,
representative 12–18 superimposed consecutive CGINs responses to cortical stimulation and mean frequency histograms; right: responses within the train
at extended time scale. Abbreviations: ca, cell-attached; wc, whole-cell; cc, current; vc, voltage clamp modes at different holding (VH) or resting (VR)
membrane potential with“low” or “high” [Cl-]
icontaining pipettes.a–h Control mice. Pause-rebound response recorded in a ca and in wc in the same CGIN
with“low” chloride containing pipette solution in b cc or c vc modes. Mean frequency histograms for d ca and e cc recordings. f–h Still same CGIN
re-patched with“high” [Cl-]isolution Note that the pause response was abolished.i–n 6-OHDA-treated mice: same experiments as in a, b, d, e. i, k Note the
absence of the pause response in ca, which reappeared in wc–cc with “low”[Cl−]ij, l. m, n restoration by bumetanide of the pause-response in ca. o, p
Mean number of spikes during time windows after train stimulation (0–200 ms, 200–400 ms, 800–1000 ms) normalized to spikes counts before train,
and recorded ino ca or p wc–cc. All means ± SEM. o, p Data sets were analyzed using one-way ANOVA followed by Fisher’s least significant difference
For triple-labeled EGFP+-ChAT-Lhx6 cells detection, images (pixel size 0.321 µm) were acquired on a Zeiss LSM 800 confocal laser-scanning microscope (Carl Zeiss) using the 488, 555, and 647 nm lasers for excitation of EGFP, CY3, and Alexa Fluor 647 (spectral detection, 400–550 nm, 550-630 nm, and 630-700 nm, respectively). We used the × 40 objective (NA 1.4) and sequentially scanned each channel with a frame average 2. For ChAT, VGAT, and GAD65-67
immunostaining, images were acquired on a confocal laser scanning microscope Leica TCS SP5X equipped with a white light laser, a 405 nm diode for ultraviolet excitation, and 2 HyD detectors, using the × 63 objective, and the 568 nm and 647 nm wavelength for ChAT and VGAT or GAD65-67, respectively.
For biocytin-filled cell reconstructions, confocal images (pixel size 0.240 µm) were acquired on a SP5X Leica microscope (Leica Microsystems) using the 555 nm
band of a white laser for excitation of Alexa Fluor 555 (spectral detection, 565–675
nm). Images were acquired at 400 Hz using a × 63 oil-immersion objective, pinhole
set to“Airy 1”, by scanning with a z step of 0.50 μm.
Reconstruction of biocytin-filled neurons and Sholl analysis. Only neurons with
a complete dendritic arbor were analyzed. Stacks were imported in the open-source
platform Fiji (https://fiji.sc/) and stitched together (https://imagej.net/
Image_Stitching)51. Without any additional pre-processing, dendrite and axon reconstructions, as well as morphological metric measurements were performed
using the semi-automated“Simple Neurite Tracer” plugin (http://imagej.net/
Simple_Neurite_Tracer)52. Based on dendrites reconstructions, a Sholl analysis was
performed using“Sholl Analysis” plugin (http://imagej.net/Sholl_Analysis)53.
Single-cell RT-qPCR. Single-cell RT-qPCR was performed according to modified
protocols described in ref.54. Sterile patch pipettes had a tip outer diameter of ~
2–3 µm and a resistance of 0.7–1.5 MΩ when filled (3–5 µL) with the “low” chloride intracellular solution prepared with RNAse-free water (Roche, USA) and con-taining 1000 units per mL of Protector RNase Inhibitor (Roche). Cytoplasm and
nucleus of identified EGFP+cells were collected into the patch pipette under visual
control. Appropriate controls for possible DNA and RNA contamination were performed when harvesting cells, Reverse Transcription and qPCR reaction: (i) RT-q PCR was performed in individual cells (not pulled data set, as typical practice for these studies) to avoid false positive result due to contamination; (ii) SPNs were used as negative control; (iii) water was tested instead of cell DNA in the RT-qPCR mix to check contamination in the RT-qPCR mix; (iv) samples with no reverse transcriptase to check DNA contamination in the reverse transcription mix; (v) pipette immersed in slice without patching and then same procedure to check contamination in the pipette solution and the medium of recording.
The content of the patch pipette was expelled into 11.4μL of re-suspension
buffer containing 20 units of Protector RNase Inhibitor and 60 µM random hexamer primer (Roche). After 10 min of denaturation at 65 °C, reverse
transcription was performed using Transcriptor high-fidelity cDNA synthesis kit
(Roche) on a SimpliAmp Thermal Cycler (Applied Biosystems, USA) following the kit procedures and then kept on ice until the PCR analysis. The PCR analysis was conducted using the LightCycler 480 Real-Time PCR System (Roche) in a total volume of 15 µL containing 3.75 µL of template DNA, 7.5 µL LightCycler 480 Probes Master (Roche), and 1.5 µL of selective Taqman® gene expression assay for ChAT or GAD65, or Lhx6 or Lhx7 mRNAs with hypoxanthine
phosphoribosyltransferase (HPRT) mRNA (Life Technologies). HPRT was used as
housekeeping or reference gene (see Supplementary Table23for specific
references), because its expression level is close to that of the target genes in the cell of interest. The reactions were subjected to an initial incubation at 95 °C for 10 min, followed by 50 cycles of 95 °C for 10 s, annealing and extension for 40 s at 60 °C.
5 min 100 pA DHβE+MLA+MEC
b
2 min 100 pA Bumetanidea
*** *** *** ** 6-OHDA DHβE+MLA+MEC 6-OHDA Bumetanide 0.0 0.4 0.8 1.2 0.0 0.4 0.8 1.2 Frequency (norm) Frequency (norm) 6-OHDA 6-OHDA 0 2 4 6 8 10 Time to traverse roller (s)*
*
Score**
0 2 4 6 8 10*
d
c
e
f
ns Total sIPSC Giant sIPSCs TotalsIPSC Giant sIPSCs
Control6-OHDA 6-OHDA 6-OHDA +bumetanide Control 6-OHDA 6-OHDA +bumetanide
Fig. 6 Bumetanide attenuates electrical network and behavioral effects of dopamine deprivation. Nicotinic receptor antagonists a, c or bumetanide b, d
treatment blocked giant GABAergic PSCs recorded in SPNs (6-OHDA-treated mice) atVH= + 10 mV. e, f Behavioral tests. e Time to traverse roller in
control and 6-OHDA-treated mice (same 6-OHDA-treated mice before and after bumetanide treatment).f Pole test score of the three different mouse
groups. See Supplementary Movies2-7. All means ± SEM.c, d Significance was determined by two-tailed, paired Student’s t-test; see Supplementary
Tables19and20for statistics.e Significance was determined by two-tailed unpaired (left set) or paired (right set) Student’s t-test; see Supplementary
Table21for statistics.f Data sets were analyzed using one-way ANOVA followed by Fisher’s least significant difference (LSD) post-hoc test; see
Fluorescein amidite (FAM)filter detection was 483 nm for excitation and 533 nm for emission, and 2′-chloro-7′phenyl-1,4-dichloro-6-carboxy-fluorescein (VIC) filter detection was 523 nm for excitation and 568 nm for emission. Dual-color relative quantification analysis was performed using LightCycler®480 Instrument Software version 1.2 (Roche, Germany). The heat map shows threshold cycle (Ct) of the target gene normalized to the Ct of the reference gene (HPRT) encoded by color (white to red).
Mice behavioral tests. For evaluating mice bradykinesia and motor coordination, we used the pole test. Mice descend a vertical wooden pole (50 cm long and 1 cm
diameter) leading to their home cage55. We performed this test 8–9 weeks
fol-lowing 6-OHDA lesion when animals were at least 3 months old. For the treatment
of randomly chosen group, Bumetanide (2–2.5 mg kg−1) was given in drinking
water for 5 weeks before the test.
First day of training: To train mice to walk down to their home cage from the
top of the pole, mice werefirst placed head-down on the top of the pole (three
trials). Then they performed a minimum offive trials with head up to train them to
turn 180° at the top of the pole and to descend the pole.
Second day of training: 24 h after thefirst training, mice performed five trials
with their head-up on the top of the pole.
Test day: 24 h after second training, we videotaped the tests and measured the
total duration of the descent and scored it, as previously described56with
modifications. The scores were as follows: 1 for a descent lasting 1–3 s, 2 for 4–6 s, 3 for 7–9 s, 4 for 10–12 s, 5 for 13–15 s, 6 for 16–18 s, 7 for 19–21 s, and 8 for 22– 24 s. A score of 9 was given when the mouse descended part way and fell the rest of the way, 10 if it slid down the pol, and 11 if it fell from the top of the pole.
Five trials were performed for each mouse and the mean data across the trials calculated. The videos were viewed and scored by an investigator who was blind to the animal condition.
To assess motor coordination of mice we used an apparatus set up by Dr.
Paikan Marcaggi. This apparatusfirst consisted of a horizontal flat beam (114.5 cm
long, 2.5 cm wide), held 55 cm above the bench surface by a column at each end. After a few trials on the beam, we added the roller bar in the middle of the beam as explained below. In order to cushion the eventual fall of mice during testing, a soft padded surface was placed at the base of the apparatus. After 2 days of training, the
test was performed as previously described for the challenging beam test57with
modifications.
First roller test was carried out 8–9 weeks following 6-OHDA lesion when animals were at least 3 months old. To do pre- and post-Bumetanide treatment
measurements, after thefirst roller test, a randomly chosen group of mice received
the Bumetanide treatment (2–2.5 mg kg−1) in drinking water for 5 weeks, then all
groups underwent second (post treatment) roller test.
First day of training: Mice performed three assisted trials to pass the length of the beam and arrive at their home cage located at one end (there was no roller bar
on the beam at this step). When the mouse was placed on the apparatus for thefirst
time, we let it move around and sniff to become oriented to the apparatus. If the mouse turned around, we gently redirected it to the intended direction, but if it continued turning around, we brought the home cage close to the mouse. When the mouse tried to get into the home cage, we moved it back so the mouse could not enter, but had to do a step forward. We continued to do this all the way down the beam. At the end of the beam, we let the mouse enter the home cage. This was
thefirst assisted trial. All mice performed a minimum of three trials to be sure that
they can walk the length of the beam on their own. Afterwards, we placed a 36.5 cm roller bar in the middle of the beam to challenge the mice, and they performed a minimum of three more trials getting assistance with climbing up the roller and traversing it to be sure that the mouse was able to perform the task on its own.
Second day of training: 24 h after thefirst training, mice performed three trials
on the roller bar.
Test day: Finally, 24 h after the second training, we videotaped the mice while traversing the roller during three consecutive trials. The videos were viewed and scored for the time to traverse the roller bar, by an investigator who was blind to the animal condition. Mean data across the three trials was calculated. iDISCO protocol. Samples were dehydrated in a graded series (20%, 40%, 60%, 80%, and 100%) of methanol (Sigma-Aldrich) diluted in PBS, during 1.5 h each at RT. They were then incubated overnight at RT on a platform shaker in a solution of PBSG-T (PBS containing 0.2% gelatin (Sigma-Aldrich), 0.5% Triton X-100, and 0.02% Sodium-Azide (Sigma-Aldrich)) for 2 days. Next, samples were transferred to PBSG-T containing the primary antibodies (Chicken IgY anti-GFP, 1:4000, AVES USA, AB144 Goat anti-ChAT, 1:500, Merck-Millipore, USA) and placed at 37 °C, with rotation at 100 r.p.m., for 15 days. This was followed by six washes of 1 h in PBSG-T at RT. Next, samples were incubated in secondary antibodies (Donkey anti-chicken Alexa Fluor 647 and Donkey anti-Goat Alexa Fluor 555, 1:500, Jackson ImmunoR-esearch) diluted in PBSG-T overnight for 2 days at 37 °C. After six washes of 1 h in PBSG-T at RT, samples were stored at 4 °C in PBS until clearing.
Tissue clearing was performed according to the clearing procedure reported
earlier58,59with some modifications. Briefly, all incubation steps were performed at
RT using a 15 ml centrifuge tube (TPP, Dutscher, France) covered with aluminum foil to avoid exposure to light. Samples were dehydrated in a graded series (20%, 40%, 60%, 80%, and 100%) of methanol diluted in PBS, during 1 h. This was
followed by a delipidation step of 20 min in dichloromethane (DCM; Sigma-Aldrich). Samples were then transferred to 100% DCM until they have sunk. Finally, samples were cleared overnight in dibenzylether (DBE; Sigma-Aldrich) and
stored in polypropylene tubesfilled with DBE, at RT in the dark.
A 3D imaging was performed with an ultramicroscope (LaVision BioTec GmbH, Germany) using ImspectorPro software (LaVision BioTec). The light sheet was generated by a laser (wavelengths 488, 555, and 647 nm, Coherent Sapphire Laser, LaVision BioTec), and two cylindrical lenses. A binocular stereomicroscope (MXV10, Olympus, Japan) with an objective × 2 (MVPLAPO, Olympus) was used
at magnification × 2.5. Samples were placed in an imaging tank made of 100%
quartz (LaVision BioTec)filled with DBE and illuminated from the side by the laser
light. Images were acquired with a PCO Edge SCMOS CCD camera (2560 × 2160
pixel size, LaVision BioTec). The step size between each image wasfixed at 2 µm.
Three-dimensional image quantifications and movies were generated using Imaris
x64 software (version 8.4.1, Bitplane, Switzerland). Stack images werefirst
converted to Imarisfile using ImarisFileConverter. Each resulting Imaris file was
16-bit images. A 3D reconstruction of the sample was performed using“volume
rendering” (Imaris). Striatal segmentation was based on Allen Mouse Brain Atlas
(Allen Institute60) and performed on autofluorescence channel (488). Briefly,
“surface” tool were used to delimitate the structure and create a mask of left and right striatum. A second segmentation was processed to isolate the dorsolateral part of the structure. Three-dimensional pictures and movies were generated using the “snapshot” and “animation” tools.
The left segmented striatum obtained with Imaris was exported in TIF image sequence and a background substraction (rolling ball radius: 5.0 pixels) processed
for each channels, using Fiji Software61. To reduce the risk of counting the same
ChAT+cell several times in the Z-Stack, a substack was generated containing
substituted slices by black slices every 20 µm. Cells were automatically counted in each slice with Cell Profiler cell image analysis software (Broad Institute Cambridge, USA). For each channel of TIF images, mean image intensity was
measured using“MeasureImageIntensity” module and cells were identified with
“IdentifyPrimaryObjects” module. The Min and Max typical diameter of objects
was set between 8 and 30 pixel units for ChAT+cells and between 3 and 25 pixel
units for EGFP+cells. Threshold was corrected by the previously measured mean
intensity. Resulting detected objects werefiltered based on their eccentricity (range
between 0.2 and 0.8) using“FilterObjects” module. Then, using mask images
generated with the aforementioned module, colocalization between ChAT and
EGFP channels was evaluated with“RelateObjects” and “MaskObjects,” in order to
determine the number of overlapping objects. Finally, data were exported to a
spreadsheet containing the number of quantified cells for each staining and
co-localization.
Drugs. For in vitro experiments, SR 95531 hydrobromide (gabazine 5μM, Tocris
Bioscience, UK, Ref. 1262), NMDA (10μM, Tocris Bioscience, UK, Ref. 0114),
2,3-dihydroxy-6-nitro-7-sulfamoyl-benzo[f]quinoxaline-2,3-dione (10 µM, NIH
gen-erous gift), GABA (10μM, Sigma-Aldrich), isoguvacine (10 μM, Sigma-Aldrich,
Ref. G002), DL -2-Amino-5-phosphonovaleric acid (40 µM, Sigma-Aldrich, Ref.
A5282), and bumetanide (10μM, Sigma-Aldrich, Ref. B3023) were directly added
to the perfusion solutions. For ca experiments, slices were treated with bumetanide for 40 min before and during recordings. Cocktail of nicotinic receptor antagonists
included mecamylamine hydrochloride (10μM, Tocris Bioscience, Ref. 2843/10),
methyllycaconitine citrate (0.1μM, Tocris Bioscience, Ref. 1029/5), and
dihydro-β-erythroidine hydrobromide (10μM, Tocris Bioscience, Ref. 2349/10). For in vivo
experiments, bumetanide pretreatment (3 mg kg−1) was given to mice in drinking
water during 5 weeks.
Statistical analysis. Data from the electrophysiological and behavior studies were analyzed with two-tailed t-test or one-way analysis of variance (ANOVA)–Fisher’s
least significant difference (LSD) post-hoc tests. For morphological metrics, we
used one-way ANOVA–Kruskal–Wallis tests followed by Dunn’s multiple com-parison post-hoc tests. For Sholl analysis of dendrites, Kolmogorov–Smirnov tests were performed. Analyses were performed with Prism 6 (GraphPad Software Inc., USA) or OriginPro (OriginLab, USA). All data are presented as means ± SEM. *P < 0.05; **P < 0.01; ***P < 0.001.
Data availability. All relevant data are available from the corresponding authors upon reasonable request.
Received: 19 September 2017 Accepted: 9 March 2018
References
1. Ding, J. B., Guzman, J. N., Peterson, J. D., Goldberg, J. A. & Surmeier, D. J.
Thalamic gating of corticostriatal signaling by cholinergic interneurons.