HAL Id: hal-01788151
https://hal.archives-ouvertes.fr/hal-01788151
Submitted on 8 May 2018HAL is a multi-disciplinary open access archive for the deposit and dissemination of sci-entific research documents, whether they are pub-lished or not. The documents may come from teaching and research institutions in France or abroad, or from public or private research centers.
L’archive ouverte pluridisciplinaire HAL, est destinée au dépôt et à la diffusion de documents scientifiques de niveau recherche, publiés ou non, émanant des établissements d’enseignement et de recherche français ou étrangers, des laboratoires publics ou privés.
Submicrometer measurements of tapered optical fibers
with low aperture optical microscopes
Abderrahim Azzoune, Philippe Delaye, Sylvie Lebrun, Maha Bouhadida,
Gilles Pauliat
To cite this version:
Abderrahim Azzoune, Philippe Delaye, Sylvie Lebrun, Maha Bouhadida, Gilles Pauliat. Submicrom-eter measurements of tapered optical fibers with low aperture optical microscopes. International Conference Optics and Photonics Algeria OPAL2018, May 2018, Oran, Algeria. pp. 51,54. �hal-01788151�
Submicrometer measurements of tapered optical fibers with
low aperture optical microscopes
Abderrahim Azzoune, Philippe Delaye, Sylvie Lebrun, Maha Bouhadida, Gilles Pauliat
Laboratoire Charles Fabry, Institut d’Optique, CNRS, Université Paris-Saclay, 91127 Palaiseau cedex, France
Author e-mail address: abderrahim.azzoune@institutoptique.fr
Abstract: A simple and accurate determination of the diameters of tapered optical fibers is essential for the development of new optical components. For this purpose, we propose a technique to increase by more than 10 the resolution of optical microscopes. This technique can be readily implemented on any microscope. We demonstrated it by measuring the diameter of a tapered optical fiber with a resolution better than 100 nm with a x10 optical microscope whose aperture is 0.28.
Keywords: Optical imaging, Nanofibers metrology, Nonlinear optics, Optical microscope.
1. Introduction
Tapered optical fibers are excellent platforms to develop new optical components and study nonlinear optical interactions [1]. We produce them by stretching a standard silica optical fiber between two translation stages while heating it by a central butane flame [2]. Both stages are computer controlled, which gives us different parameters to obtain a variety of manufactured nanofiber profiles. The biggest advantage of these optical nanofibers is their very high transmission. Another advantage is the confinement of light thanks to their small diameter, which gives very high intensities favorable to nonlinear processes. These effects are very sensitive on the fiber profile, i.e. diameter versus the coordinate along the fiber axis. Optimizing optical wave mixings may require the knowledge of these diameters to within a few nanometers of accuracy [1]. The simplicity of optical microscopy would make it ideal for these non-destructive profile measurements provided that the resolution could be increased beyond the classical diffraction limit. One usual mean to beat the diffraction limit is to add some extra information to the measurement. In the specific case of tapered fiber measurements, this extra information is the a priori knowledge of the object to be measured. We assume that, over the region of measurements, the fiber is a perfect silica cylinder, the only unknown parameter being its diameter. This allows us to perfectly compute the diffraction pattern collected by the microscope. Comparing these simulations with the images collected by the microscope allows to go down to 100 nm in diameter precision.
2. Principle
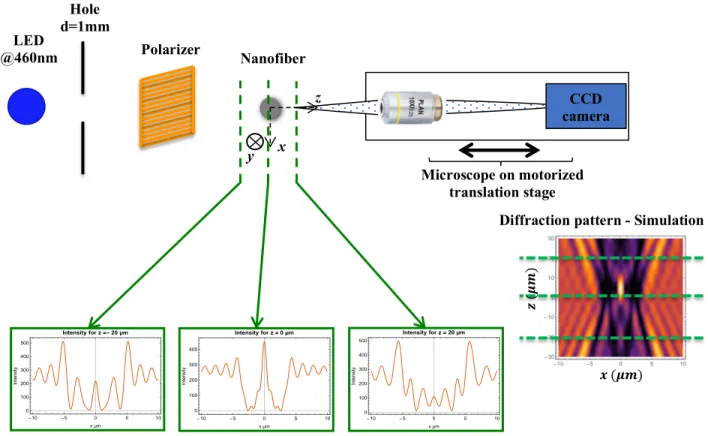
We made the following setup (Figure 1). The nanofiber is back-illuminated by a LED that emits a narrow bandwidth around a central wavelength of 460 nm. The polarizer makes it polarized along the nanofiber y axis. This source is set at about 20 cm from the nanofiber, so that the light can be is assimilated to a plane wave. The microscope (x10 with a numerical aperture NA=0.28) is mounted on sub-micrometric translation stage. This allows us to take a series of images at different focuses, i.e. along z, upstream and downstream the nanofiber. Each of these images thus represents a 2D cross-section, in a xy plane, of the field diffracted by the nanofiber. We then select a position y0 along the nanofiber on which we aim to determine the diameter and we isolate the corresponding line in each of the images. We thus get a series of 1D-profiles of the diffraction pattern for the same position y0 and for a series of z. These profiles are then computer assembled to get a 2D diffraction pattern as the one shown in the middle of Figure 2. To determine the diameter at this position y0 we have to identify this pattern with one of the patterns computed for various diameters.
To calculate the field at any point between the optical fiber and the objective, we use the formulas given by Van De Hulst [3]. This diffraction field is decomposed in plane waves and the whole decomposition is limited to the numerical aperture of the objective. We propagate these plane waves and we simulate the images acquired by the camera for different focuses.
3. Experimental results
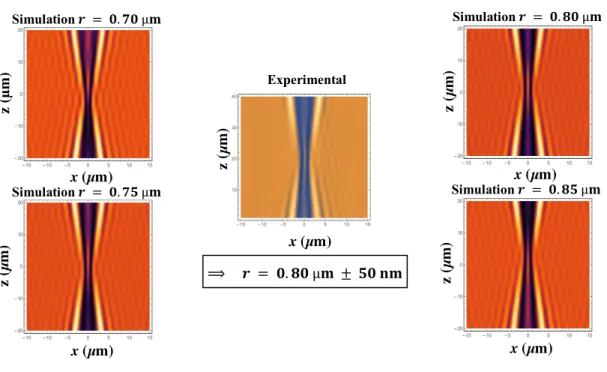
We draw an optical nanofiber with an unknown diameter. We then acquire the corresponding experimental diffraction pattern as explained above. It is shown in the middle of figure 2.
The simulations for radii outside the range [0.7 µm; 0.85 µm] considerably differ from the experimental one. We do not consider them. The diffraction patterns are reconstructed from the images taken by the microscope from the side of the LED source to the side of the camera. Within this range of similarity, see Figure 2, we observe that the central bright line at 𝑥 = 0 moves from the positive z to the negative z while increasing the radius. The most similar is for a radius of 0.80 µm. From this comparison we conclude that the radius of the nanofiber is 𝑟 = 800 nm ± 50 nm.
Fig. 1. The microscope with its illuminating system
Diffraction pattern - Simulation LED @460nm Polarizer Hole d=1mm Nanofiber x -10 -5 0 5 10 0 100 200 300 400 500 x µm Int ensit y Intensity for z =- 20 µm z -10 -5 0 5 10 0 100 200 300 400 x µm Int ensit y Intensity for z = 0 µm -10 -5 0 5 10 0 100 200 300 400 500 x µm Int ensit y Intensity for z = 20 µm 𝒛 (𝝁𝒎 ) Microscope on motorized translation stage CCD camera y 𝒙 (𝝁𝒎)
4. Conclusion
Presently, the 100 nm accuracy on the diameter measurement is limited by the spectral and angular bandwidths of the light source, the alignment and the nanofiber movement in suspension in the air. This measurement method can be compared with other techniques reported in the literature. Brillouin spectroscopy provides its best resolution of 20 nm for diameters ranging between 0.36 and 1.2 µm [4]. For second and third harmonic generation measurements, a resolution of few nanometers is obtained, but just for a small range of diameters limited by the laser tuning range to [0.19 µm; 1 µm] [5]. The high-order modes cutoffs method has a precision of 5 nm for a nanofiber diameter ranging from [0.8 µm; 1.3 µm] [3]. Therefore, although our method does not yet allow accuracies as large as previously proposed ones, its strengths are threefold: it is relatively easy to implement on existing microscopes, it allows an extended range of diameter measurements, it provides a diameter measurement at each point along the nanofiber. We are currently working on improving the resolution of this technique by developing a computer procedure to automatically compare the acquisitions patterns with the simulated ones. This procedure will be presented during the conference.
This work is supported by the French National Research Agency (ANR) (FUNFILM-ANR-16-CE24-0010-03).
5. References
[1] X. Wu et al. “Optical microfibers and nanofibers”, Nanophotonics 2, 407 (2013).
[2] L. Shan et al. “Stimulated Raman scattering in the evanescent field of liquid immersed tapered nanofibers”, Appl. Phys. Lett. 102, 201110 (2013).
[3] H.C. van de Hulst “Light scattering by small particles”, New York, Dover Publications (1981).
[4] A. Godet et al., "Brillouin spectroscopy of optical microfibers and nanofibers," Optica 4, 1232 (2017)
[5] U. Wiedemann et al "Measurement of submicrometre diameters of tapered optical fibers using harmonic generation," Opt. Exp. 18, 7693 (2010).
[6] Y. Xu et al «Real-time control of micro/nanofiber waist diameter with ultrahigh accuracy and precision» Opt. Exp. 25, 10434 (2017).
Fig. 2. Experimental and simulated diffraction patterns Simulation 𝒓 = 𝟎. 𝟕𝟎 µ𝐦 Experimental Simulation 𝒓 = 𝟎. 𝟖𝟎 µ𝐦 x (µm) z (µ m ) x (µm) z (µ m ) z (µ m ) z (µ m ) z (µ m ) x (µm) Simulation 𝒓 = 𝟎. 𝟖𝟓 µ𝐦 Simulation 𝒓 = 𝟎. 𝟕𝟓 µ𝐦 ⟹ 𝒓 = 𝟎. 𝟖𝟎 µ𝐦 ± 𝟓𝟎 𝐧𝐦 x (µm) x (µm)