HAL Id: hal-00299314
https://hal.archives-ouvertes.fr/hal-00299314
Submitted on 7 Jun 2006
HAL is a multi-disciplinary open access
archive for the deposit and dissemination of
sci-entific research documents, whether they are
pub-lished or not. The documents may come from
teaching and research institutions in France or
abroad, or from public or private research centers.
L’archive ouverte pluridisciplinaire HAL, est
destinée au dépôt et à la diffusion de documents
scientifiques de niveau recherche, publiés ou non,
émanant des établissements d’enseignement et de
recherche français ou étrangers, des laboratoires
publics ou privés.
hazard risk assessment
Th. Plattner, T. Plapp, B. Hebel
To cite this version:
Th. Plattner, T. Plapp, B. Hebel. Integrating public risk perception into formal natural hazard risk
assessment. Natural Hazards and Earth System Science, Copernicus Publications on behalf of the
European Geosciences Union, 2006, 6 (3), pp.471-483. �hal-00299314�
www.nat-hazards-earth-syst-sci.net/6/471/2006/ © Author(s) 2006. This work is licensed under a Creative Commons License.
and Earth
System Sciences
Integrating public risk perception into formal natural hazard risk
assessment
Th. Plattner1, T. Plapp2, and B. Hebel1
1Land Use Engineering, Swiss Federal Institute of Technology, Zurich, Switzerland
2Institute for Insurance, University of Karlsruhe (TH), Karlsruhe, Germany
Received: 1 September 2005 – Revised: 3 April 2006 – Accepted: 12 April 2006 – Published: 7 June 2006
Abstract. An urgent need to take perception into account
for risk assessment has been pointed out by relevant litera-ture, its impact in terms of risk-related behaviour by individ-uals is obvious. This study represents an effort to overcome the broadly discussed question of whether risk perception is quantifiable or not by proposing a still simple but applica-ble methodology. A novel approach is elaborated to obtain a more accurate and comprehensive quantification of risk in comparison to present formal risk evaluation practice. A con-sideration of relevant factors enables a explicit quantification of individual risk perception and evaluation.
The model approach integrates the effective individual risk
reff and a weighted mean of relevant perception affecting
factors PAF. The relevant PAF cover voluntariness of risk-taking, individual reducibility of risk, knowledge and experi-ence, endangerment, subjective damage rating and subjective recurrence frequency perception. The approach assigns an individual weight to each PAF to represent its impact mag-nitude. The quantification of these weights is target-group-dependent (e.g. experts, laypersons) and may be effected by psychometric methods.
The novel approach is subject to a plausibility check us-ing data from an expert-workshop. A first model application is conducted by means of data of an empirical risk percep-tion study in Western Germany to deduce PAF and weight quantification as well as to confirm and evaluate model ap-plicbility and flexibility.
Main fields of application will be a quantification of risk perception by individual persons in a formal and technical way e.g. for the purpose of risk communication issues in illustrating differing perspectives of experts and non-experts. For decision making processes this model will have to be applied with caution, since it is by definition not designed to quantify risk acceptance or risk evaluation. The approach
Correspondence to: Th. Plattner
may well explain how risk perception differs, but not why it differs. The formal model generates only “snap shots” and considers neither the socio-cultural nor the historical context of risk perception, since it is a highly individualistic and non-contextual approach.
1 Introduction
During the past years a significant change in Swiss hazard management policy took place, which is due to an underly-ing general paradigm shift. One implication is a risunderly-ing im-portance of the concept of risk. Before the policy change, for many years responsible authorities had aimed at achieving standardised safety levels through prevention of hazardous processes, regardless what the cost of the required measures was. Nowadays, however, a need for optimised resource usage arises due to limited financial resources and growing public interest in its allocation. The risk concept enables the authorities to economically optimise their investments. As a consequence, the objective of natural hazard risk man-agement is no longer an absolute (and sometimes economi-cally unreasonable) safety level, but the identification of cost-effective risk mitigation measures. Optimisation shall reduce the maximum magnitude of an effective risk at a lowest pos-sible price to an individually and socially acceptable level.
As a part of the risk management process, risk evaluation defines that level of acceptable risk. Thus, it answers the question “what may happen?”. In the literature, two main concepts of risk evaluation using different approaches and methodologies are predominant:
– so-called “intuitive” processes of risk perception and
evaluation performed by individuals and groups for their everyday decisions about the acceptability of risks;
– formal, technical processes of risk evaluation, which are
mainly used by official authorities identifying a norma-tively defined acceptable risk rnorm.
The factors determining these public risk perception and evaluation processes have been investigated in numerous em-pirical studies by economists, psychologists and social scien-tists.
On the other hand, various technical approaches for formal risk evaluation were elaborated. One of their objectives is to consider the findings of public risk perception and evaluation studies and to integrate the known relevant factors of risk per-ception. However, they are so far limited to taking the extent of damage into account. Consequently, these approaches ex-clude further aspects relevant for individual risk perception, such as socio-psychological risk dimensions. This incom-plete integration of risk perception and evaluation is the main shortcoming of the current practice.
In order to obtain a more accurate and comprehensive quantification of risk new approaches are therefore needed. Approaches that consider the full spectrum of factors relevant for risk perception and evaluation are particularly promising in this context, since they enable a quantification of individ-ual risk perception and risk evaluation .
The present paper proposes a formal approach to integrate individual risk perception within an objective risk function. The model is mainly based on an expressed preferences ap-proach (e.g. (Fischhoff et al., 1978), which represents one of the most seminal findings of risk perception research during the last three decades. The objective of this paper is to pro-pose a formalised approach that considers quantified effec-tive individual risk while integrating subjeceffec-tive risk percep-tion. The elaboration of such a novel model concept is mo-tivated by the fact that findings of expressed preferences ap-proaches are relevant for risk management and risk commu-nication. First application results of the proposed approach are displayed, using data from a empirical risk perception study conducted by Plapp (2004) in Western and Southern parts of Germany.
2 State of knowledge
Within the risk management process, risk evaluation answers the question “what may happen?” and thus helps to define the acceptable level of risk. So far, two main risk approaches are known.
– within the natural hazard risk management community,
risk is usually defined in a formal way as product of the effective probability of a given size and the predicted level of damage it would cause (see Eq. 1);
– decades of psychological and social scientific research
have shown that the everyday processes of risk percep-tion and risk evaluapercep-tion rely on entirely different models to subjectively assess risks.
Compared to the first mentioned formal risk definition, the cognitive and affective structure of risk is more com-plex and encompasses more dimensions than merely figures for occurrence probability and possible damage of an event. Empirical studies of risk perception showed that – besides quantitative factors or dimensions such as perceived damage and perceived recurrence frequency – also qualitative dimen-sions represent relevant factors for individual risk perception (Slovic, 1987; Fischhoff et al., 1978).
2.1 The “objective” and rational concept of risk
In risk management literature, the individual effective risk
reffis usually defined as
reff,i=pobj,i·eeff,i (1) i.e., as product of the effective damage of an event eeff,i
times the effective occurrence probability peff,i of the event i. Thus, reducing the extent of effective damage eeff or the
effective occurrence probability peffwill lower the effective
risk reff.
This formal “objective” risk definition is based on the ra-tional expected value model of human behaviour. According to Simon (1955, 1966), that model is based on the assump-tion that people
– have full information about all relevant aspects of an
observed system, or at least, comprehensive and clear information about that very system,
– have a well organised and stable system of preferences, – are able to define a value for several known alternatives
on their scale of preferences, and to prioritise these ac-cording to their utility; this requires knowlege about the possible alternatives for action, and to possess a func-tion to allocate an unambiguous utility to each of these alternatives.
To achieve an optimal risk management, however, also the societal level of acceptable risk has to be determined. Decision-making authorities have to define the level of safety that has to be achieved. Formal risk evaluation approaches are frequently used to identify the required safety goals, and thus to answer the question of “what may happen?”. Cur-rently, and in most cases acceptable risk rnormis thereby
de-fined by experts, based on standards, empirical considera-tions, and intuition as well. The acceptability of a certain risk can be defined using normative criteria to either allow a risk, to denote it as inadmissible, or to ascertain a risk level for which acceptability can prospectively be expected
(NDK, 2001). After Heinimann (2002) the acceptable risk
rnormshould be defined within a political process of opinion forming, involving experts, stakeholders, pressure groups, as well as political decision-makers.
2.2 The subjective concept of risk
Several empirical studies highlighted the systematic discrep-ancy between the individual, subjective risk evaluation and the formal risk evaluation procedures. Hence, considering and integrating subjective aspects becomes a basic require-ment. Three decades of research on individual and social risk perception as well as risk evaluation revealed that the every-day and subjective risk perception by “laypersons” is any-thing else than “irrational”, but follows underlying plausible rules. They are yet quite different from the rational rules for formal risk evaluation conducted by “experts”, which leads to systematic deviation between individual and formal risk evaluation (Slovic et al., 1981, 1982, 1986; Slovic, 1987, 2000). According to Fischhoff et al. (1978), a number of qualitative and quantitative risk dimensions influence the in-dividual perception and evaluation of a risk: The voluntari-ness of risk-taking, the knowledge about a certain risk, the dread associated with the risk, the immediacy, irreversibility and intensity of impacts, the possibilities to control or reduce the risk, and others. Thus, the risk concept is described as a multidimensional construct within psychological and social science risk research (Slovic, 1992; Kasperson et al., 1988).
According to several studies (Fischhoff et al., 1981; Gries-meyer, 1982; Geiger, 1993; Marris et al., 1997; Jasanoff, 1998; Belzer, 2001; Skjong and Wentworth, 2001; Siegrist et al., 2004), the existence of a strong inter-individual vari-ation within risk perception, and, furthermore, a systematic difference between experts’ and laypersons’ risk perception can be assumed. This difference is said to be related to the various kind of dimensions used in risk evaluation, and to the priorities that are associated with these dimensions, re-spectively. While experts refer to more “quantitative” and formal criteria such as the probability and the expected ef-fective damage of a certain event, laypersons are said to ad-ditionally rely on the mentioned qualitative criteria or dimen-sions (Slovic, 1987). Although this principal difference in the underlying concepts of experts and laypersons has been doubted (Rowe and Wright, 2001), risk judgements of dif-ferent persons have nevertheless to be considered as strongly deviating because of varying social contexts, including dif-ferent social roles and role expectations.
Psychometric approaches using field studies and question-naires are very common methods for risk perception studies of technical hazards (Slovic, 1992; Rohrmann, 1999). Recent research even proved their applicability to natural hazards (Finlay and Fell, 1997; Lima, 1997; DeChano and Butler, 2001; Plapp, 2004; Siegrist et al., 2004). Experimental re-search on human behaviour, i.e. on preferences and decision making theories (Kahneman and Tversky, 1979; Tversky and
Kahneman, 1992; Eisenf¨uhr and Weber, 2003; Neumann and Morgenstern, 2004), moreover showed that individuals
– tend to overestimate small probabilities and to
underes-timate medium and large probabilities, and
– tend to derive perceived damage in a non-linear way
from the extent of effective damage (defined as nega-tive utility).
Further studies indicate that risk perception is in addition strongly influenced by media coverage of risk (Rohrmann, 1999). Besides that, risk perception is shaped by the socio-cultural context and is dynamic, i.e. changes over time (Kasperson et al., 1988). Because of this complexity, risk perception prediction or even a deduction of general theory on risk perception appears to be difficult. Nevertheless, the importance of risk perception for an effective and socially accepted risk management is clearly evident (Renn, 1998; Pidgeon, 1998).
2.3 Combining both concepts of risk
Most formal risk evaluation approaches are based on the ob-jective concept of risk. Nevertheless, some approaches try to integrate risk perception and risk evaluation by individu-als and groups of individuindividu-als. Mostly, the well known in-fluence of the effective extent of damage eeffon risk
percep-tion and evaluapercep-tion is considered in approaches to evaluate
acceptable, collective risk Rnorm, e.g. within the approach
of aversion function and acceptance line (Merz et al., 1995; Troxler et al., 1989; Bohnenblust, 1985; Bohnenblust and Schneider, 1984; Bohnenblust and Slovic, 1998; BUWAL, 1991; Farmer, 1967; Amman et al., 2004; BABS, 2003). In some cases even the aspect of voluntariness to take risks is regarded, particularly by introducing risk categories for
ac-ceptable individual risk rnorm (Merz et al., 1995;
Bohnen-blust, 1985; Bohnenblust and Schneider, 1984; Bohnenblust and Slovic, 1998; Amman et al., 2004; BABS, 2003). Still, only a narrow selection of relevant risk perception factors is integrated in such approaches.
In an attempt to integrate both the formal and the social-psychological perspective, Sandman (1989, 1999a,b) defines risk as a function of “hazard” and “outrage”.
risk = hazard + outrage (2)
In this context hazard has to be regarded as the objective view of risk, focused on the effective damage extent and the occurrence probability of unwanted effects, and outrage is mainly focusing on the negative aspects of a situation. This theory can be comprehended as a rough approximation to the perceived risk. Sandman (1987) enumerates more than twenty “outrage”-factors, which shall at least partially ex-plain the difference between perceived subjective and for-mally calculated effective risk. These factors were again drawn from psychometric studies.
Slovic (1987) describes subjectively perceived risk as a systematical anomaly in the assessment of an individual risk, based on the formal quantitative measure of risk. Thus, a perceived risk may also be defined as the subjective view of the very risk, based on subjective processing and evaluation of risk-related information (NDK, 2001). Consequently, per-ceived risk may be expressed after
rperc=f (reff,bias) (3) as function of the effective risk reffand a systematic
devi-ation, which is specific for the regarded individual or social group (i.e. “bias”). Given this definition, even the
accept-able risk rnorm may be counted for a particular kind of the
perceived risk, i.e. the systematical deviation of the experts’ assessment from effective risk reff(whereas the experts try to
consider legal regulations and technical standards).
3 Material and methods
3.1 Hypothesis
Due to the findings of Sect. 2 this study is based on the hy-opthesis whereupon different individuals and social groups which can be distinguished e.g. according to shared values, beliefs, educational background, etc. (e.g. laypersons vs. ex-perts) attribute varying weights to the affecting factors of risk perception. Thus, quantified perceived risk is established as a function of perception affecting factors and corresponding weights.
3.2 Calculating the perceived risk: the equation, its basics
and the parametrisation
The proposed approach to calculate the individual perceived risk is based on two different building blocks. First, it relies upon the objective and rational concept of risk, i.e. the ef-fective individual risk reff(cf. Eq. 1). Second, the individual
subjective deviation of individual risk perception is consid-ered, using relevant risk Perception Affecting Factors (PAF). Therefore, our proposal for an individual “risk perception” equation is
rperc=peff·eeff· Pn
i=1(pafi ·ai)
Pn i=1ai
(4)
with pafi being the value of the perception affecting
fac-tor, ai being the weight for each pafi and n being the total
quantity of relevant PAF. The parameters pafi and ai were
defined as subject to the following boundary conditions:
– the domain for pafi is [0.5,2]
– the domain for aiis [0,1]
– pafi>1 increase the perceived risk rperc
– pafi=1 are indifferent or neutral concerning the per-ceived risk rperc
– pafi<1 decrease the perceived risk rperc
– the upper boundary pafi = 2 doubles the perceived risk
rperc
– the lower boundary pafi= 0.5 halves the perceived risk
rperc
3.3 Definition of PAF and experts-weights ai,ex within a
workshop
The selection of the relevant PAF followed a detailed analysis of the psychometric risk perception literature and a compiled list of all mentioned risk dimensions. Prosecuting a quali-tative Delphi-like approach, this list of risk dimensions was subsequently analysed according to the relevance for the do-main of natural hazard by in total five experts. In doing so, all elements were also tested qualitatively one among another for collinearity. The resulting short list was compared with results of recent studies in the very domain, e.g. the work of Plapp (2004).
As final step, this short list was discussed with eighteen risk perception experts in a workshop held at the Swiss Federal Institute of Technology (ETH Z¨urich) in November 2004. One of the aims of the workshop was the significant definition of these PAF within the field of natural hazards using a Delphi-like procedure. Therefore, the remaining se-lection of PAF is called the workshop-PAF.
Known risk perception studies indicate that the relevant factors exert influence of different intensities. The model
therefore assigns a specific weight ai to every PAF
repre-senting its impact magnitude. Within the mentioned work-shop at the ETH, the quantification of the PAF-weighting is based on the Analytical Hierarchical Process (AHP) after Saaty (2001). The process delivered an expert-based ranking for the relevance of respective PAF, so that these weights are called experts-weights ai,ex.
3.4 Case study for plausibility check
Knowing the relevant workshop-PAF and their specific experts-weighting ai,ex, a plausibility and a sensitivity check
was performed. For this purpose, the approach using the de-fined PAF together with the weights was applied to a con-structed case study. The case study refers to a single river flooding event with an effective annual occurrence probabil-ity peff=0.02 (i.e. one flooding every fifty years), causing an
effective individual damage Ceff of 40 000.- Euro, resulting
3.5 Risk perception survey as a basis for experts- and
laypersons-PAF and weights ai
3.5.1 Risk perception survey in Germany
The formal model was further tested with empirical, real live data collected in a multi-hazard survey on natural hazard risk perception by one of the authors (Plapp, 2001, 2004; Plapp and Werner, 2006).
The psychometric paradigm of risk perception (Fischhoff et al., 1978; Slovic, 1987, 1992) had been applied on risk perception from storm, flood, and earthquake in a mail-out questionnaire in six affected regions in Southern and Western Germany in 2001: Cologne-Rodenkirchen, Passau, Neustadt a.d. Donau, Albstadt, Karlsruhe, and Rosenheim. The six survey areas had been selected using Munich Re’s Disasters Catalogue for Germany (M¨unchenerR¨uck, 1999) and other additional sources. Criteria for selection included the expo-sure to flood, windstorm, and earthquake, the type of settle-ment as well as the area’s experience with natural hazards in the last 30 years. In total, 450 persons participated in the study, 223 of them female, 227 male. The average age was 48 years. The level of education in the sample is above av-erage compared to the total population of Germany, which is a typical feature of mail-out questionnaires due to self-selection effects. Since after Sj¨oberg (2000a,b) the influence of education level on risk perception can be assumed to be fairly low, no bias due to the education level has to be ex-pected. The vast majority of the participants have no special qualifications related to risk or hazard management to refer to them as “risk experts”, thus they are considered as being “laypersons”.
The psychometric approach in the survey employed nine risk dimensions that should explain the level of the per-ceived individual risk. Referring to studies on perception of natural and environmental risks (Brun, 1992; Karger and Wiedemann, 1998) the following risk dimensions had been selected:
– the perceived likelihood to die from the hazard
– the perceived degree of scientific knowledge about the
risk
– the knowledge of the risk to those exposed (old or new
risk)
– the emotion of fear evoked by the risk – the possibilities to influence the risk – the perceived recurrence frequency – the predictability
– the expected future increase or decrease of the risk in
terms of event frequency and intensity of impacts on society
– the willingness to move into a hazard area provided that
there are better living conditions
The respondents had been asked to judge each of the three hazards regarding their individual perceived risk and regard-ing all nine risk dimensions, in each case on a 5-point scale.
3.5.2 Transformation of the survey risk dimensions to the
workshop-PAF-meanings
In order to test the proposed model with the survey data, first the semantic meaning of the workshop-PAF and the empiri-cal field study were compared. Correspondences and seman-tic overlapping of the risk dimensions used in the survey and the workshop-PAF were to be expected.
3.5.3 Deduction of laypersons-weights ai for the
workshop-PAF
The survey responses can be used to determine the laypersons-weights of the workshop-PAF. The results can then be compared with those of the experts using the same formal model to test the impact of different weights on the same workshop-PAF.
The survey data had to be split into two data sets: one set for deducing the laypersons’ ranking and weights of the workshop-PAF (model sample); and a second data set for ap-plying the deduced values (test sample). The total sample of 450 respondents was split randomly in two samples of 273, respectively 272 respondents, whereby a quota system was used to ensure that both samples contained equal proportions of respondents from each of the six survey areas. In both data sets, each respondent represents three cases, as responses for each of the three hazards (flood, storm and earthquake) were regarded as cases, a technique used also by Karger and Wiedemann (1998). Thus, the model sample consisted of 819 cases (273 × three hazards) and the test sample of 816 cases (272 persons × three hazards). Both samples were then examined for comparability regarding the relevant variables.
The laypersons 1-weights ai,lay 1 for the workshop-PAF
were derived from the data by multiple bivariate linear
re-gression analysis. The individual perceived risk was the
dependent variable, and the PAF-variables the independent variables. The regression weights β represent the impact of a factor or variable on the dependent variable, i.e. the personal risk. To fit the regression weights to the range of [0,1] as re-quired by the boundary conditions (cf. Sect. 3.2) in order to obtain weights, the highest beta value was taken as 1 while the other were transformed respectively.
3.5.4 Deduction of alternative PAF and weights ai for
laypersons
Using the model sample, the survey data allow to generate an alternative, empirical selection of major influencing factors of risk perception including their respective factor weights.
Table 1. Transformation of empirical survey values Plapp (2004)
into PAF-values with a value range [0.5,2]
value in survey PAF-value by Plapp (2004) formal model
1 0.5 1.5 0.625 2 0.75 2.5 0.875 3 1 3.5 1.25 4 1.5 4.5 1.75 5 2
The empirical selection of PAF can be applied to the formal “risk perception equation” Eq. 4 in its general form. In this way, also the impact of using different PAF can be studied.
The empirical survey data were used to deduce an addi-tional empirically generated combination of PAF. For this purpose, again several regression analyses were performed, using also those risk dimensions as independent variables that had not been included in the workshop selection of PAF. These PAF are called questionnaire-PAF, based on their derivation from the survey data. Again, the regres-sion weights β were used to deduce weights by transforming them according to their magnitude. These weights are called laypersons 2-weights ai,lay 2.
Finally, the values of the questionnaire-PAF had to be transformed into pafi-values ranging from 0.5 to 2 to fit to the boundary conditions of the PAF. In order to maintain the required domain according to the boundary conditions, the empirical values were transformed as indicated in Table 1. The empirical values of the risk dimensions in the survey were collected on a 5 point-scale ranging from 1 to 5. The value range of the PAF-variable “endangerment” which was created by the mean of two variables comprised the addi-tional values [1.5, ..., 4.5].
4 Results
4.1 Literature analysis and workshop: the results
4.1.1 Workshop-PAF and the experts-weights ai,ex
Based on the literature and the experts workshop mentioned in Sect. 3.3, a small number of relevant perception affecting factors PAF finally remained (cf. also Table 2, column 2):
– voluntariness of risk-taking: pafv,
– reducibility of risk: pafr,
– knowledge and experience: pafex,
– endangerment: pafd,
– subjective damage rating: pafe,
– subjective recurrence frequency: paff.
Their determined experts-weights ai,ex are shown in the
second column of Table 3.
4.1.2 Plausibility check: the case study example
Based on the workshop-PAF, the plausibility of the proposed approach for the calculation of the perceived individual risk (cf. Sect. 3.2) was checked using the case study mentioned in Sect. 3.4. Therefore, we assumed that one of the house-owners’ individual perception affecting factors PAF can be
deduced as follows (where pafi is within [0.5,2] and
ver-bally defined as “very low”, “low”, “moderate”, “high”, and “very high”):
– he bought his house voluntarily due to a very low
price, knowing and accepting that it is situated within a flooding area. He therefore rates his voluntariness at “very high”, resulting in a risk perception decreasing
pafv=0.5.
– the effective reduction of the effective risk for the
spe-cific area to be affected by flooding may only be re-alised by collective technical measures of flood preven-tion (such as a retenpreven-tion pond, flood embankment). The houseowner therefore rates his effective individual re-ducibility of the flood risk to be low (e.g. sandbags), resulting in a risk perception increasing pafv=1.50.
– the person owns his house already for 30 years, during
which his basement was already affected by flooding twice. He therefore rates his personal knowledge about the floods’ occurrence, behaviour and effects to be high, resulting in a risk perception decreasing pafex=0.75.
– according to the houseowner’s view, the general
indi-vidual endangerment of his and his family’s subsistence and well-being by the regular floods is low, leading to a risk perception decreasing pafd=0.75.
– due to the two past flood events and the caused damage,
the houseowner is able to appropriately specify the in-dividual damage effect to his property (knowing about his individual damage value of 40 000.- Euro), resulting in an indifferent pafe=1.00.
– he on the other hand overestimates the recurrence
fre-quency of floods within his living area due to the two witnessed events during past 30 years (in relation to the effective flood recurrence frequency of 50 years), which leads to a risk perception increasing pafp=1.75.
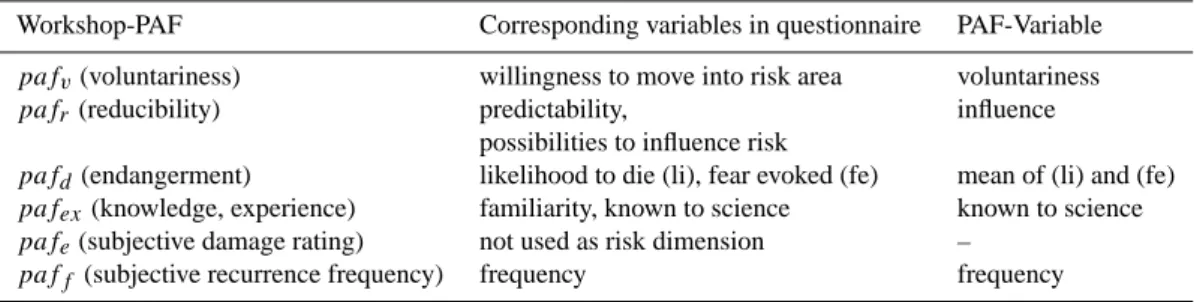
Table 2. PAF definitions and corresponding variables from the questionnaire by Plapp (2004).
Workshop-PAF Corresponding variables in questionnaire PAF-Variable pafv(voluntariness) willingness to move into risk area voluntariness
pafr(reducibility) predictability, influence
possibilities to influence risk
pafd(endangerment) likelihood to die (li), fear evoked (fe) mean of (li) and (fe)
pafex(knowledge, experience) familiarity, known to science known to science
pafe(subjective damage rating) not used as risk dimension –
paff (subjective recurrence frequency) frequency frequency
Taking into account all pafiand experts-weight aias
pro-posed by the authors, the perceived individual risk for the
houseowner amounts to rperc=866.62 Euro·a−1. This means,
the owner overestimates his individual risk by 8%.
4.2 Risk perception survey: the resulting PAF and their
weights ai
4.2.1 Workshop-PAF resulting from the survey risk
dimen-sions transformation and their laypersons-weights
ai,lay 1
Table 2 shows the list of identified relevant workshop-PAF (column 1) and corresponding variables from the survey (columns 2 and 3). For the PAF “endangerment” two cor-responding survey variables were identified each showing a sufficient correlation with the perceived personal risk: the likelihood to die from the hazard (r=0.46) and the fear evoked by the hazard (r=0.60). The two risk dimensions themselves are also correlated with each other (r=0.52). In-stead of excluding one or the other, an index was created based on the mean of both variables. Unfortunately, there was no corresponding variable in the survey data for the workshop-PAF “subjective damage rating”, as damage had been surveyed qualitatively in a way incompatible to the for-mal model. Despite of this correspondence missing, the over-all level of correspondence was considered as sufficient and the workshop selection of PAF was applied to the empirical
data. The laypersons 1-weights ai,lay 1 of these
workshop-PAF based on the risk perception survey are shown in column 4 in Table 3.
4.2.2 Laypersons-PAF and their weights ai,lay 2 based on
the risk perception survey
Based on the method mentioned in Sect. 3.5.4 the
rele-vant PAF and corresponding laypersons 2-weights ai,lay 2
listed in column 5 of Table 3 were derived from the sur-vey data. Where the PAF generated during literature analysis and workshop are the same as those deduced from the survey data, also the resulting weights are the same. One additional relevant factor for individual risk perception emerged from the survey data: “future increase”, i.e. the future expected
in-crease of the risk in terms of event frequency and intensity of impacts on the society.
4.3 Application to “real-life” data: testing the approach
First the laypersons 1-weights ai,lay 1were calculated based
on the regression weights in the model sample β and then
transformed into weights ai ranging from 1 to 0 (cf.
Ta-ble 3). Second, the regression weights β for the resulting relevant risk dimensions of the empirically generated PAF-selection were calculated and transformed into the layper-sons 2-weights ai,lay 2.
The application of the proposed risk perception equation (cf. Eq. 4) using the questionnaire-PAF differs slightly from the result using the workshop-PAF. One additional PAF, the “future expected increase” of natural hazards and their im-pacts, proved to be important. Within the questionnaire-selection, the PAF “reducibility” was excluded from the list of relevant PAF as the regression weight β failed the neces-sary level of significance. This PAF had been included in the workshop-selection for reasons of plausibility. Since the cor-relation coefficient between the perceived individual risk and the perceived possibilities to influence the risk (=reducibil-ity) was statistical significant, even if very small (r=0.07), and since the β failed the level of significance very nar-rowly, it was decided to include it as relevant PAF in the workshop-selection of PAF. However, it was not included in the questionnaire-PAF list.
The application of the data was implemented in three dif-ferent runs. For all three runs, the lay-data (test sample) were
used as input values for the pafi (transformed according to
Table 1) while different weight schemes were used. In the
first implementation, the laypersons-pafi-values were
com-bined with the workshop-PAF and the experts-weights ai,ex.
In the second run, the workshop-PAF were combined with the laypersons 1-weights ai,lay 1and in the third
implemen-tation the empirically generated questionnaire-PAF and the laypersons 2-weights ai,lay 2were used, finally.
Since the survey-data were not related to effective age values or effective recurrence frequencies of that dam-age, both peff and eeff were defined as 1. Thus the effective
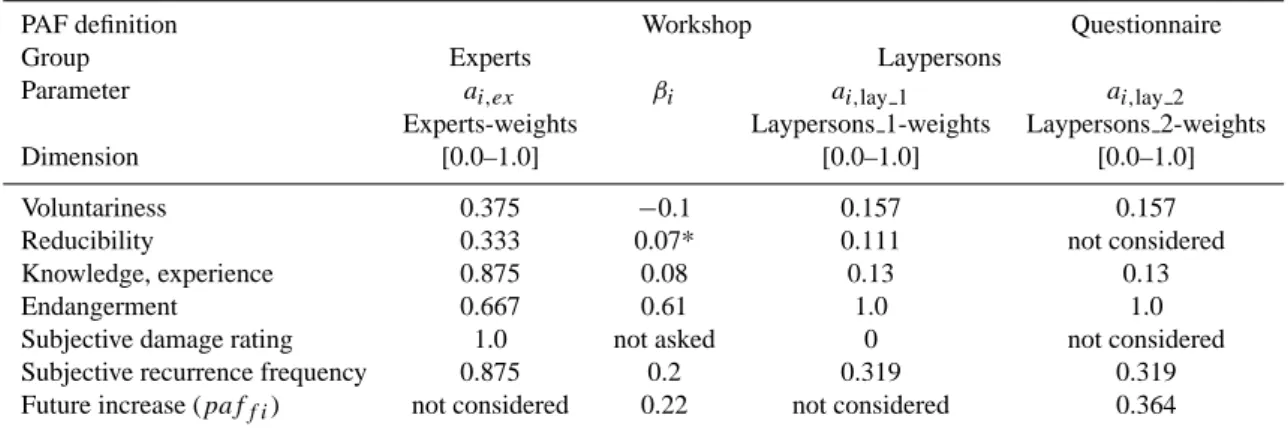
Table 3. PAF and corresponding weights of the PAF, distinguished between workshop-selection of PAF with experts-weighting (result of
the experts workshop, approach of Saaty (2001)) and laypersons-weighting deduced by data provided from Plapp (2004), and empirically deduced questionnaire-PAF and the respective weights.
PAF definition Workshop Questionnaire
Group Experts Laypersons
Parameter ai,ex βi ai,lay 1 ai,lay 2 Experts-weights Laypersons 1-weights Laypersons 2-weights Dimension [0.0–1.0] [0.0–1.0] [0.0–1.0] Voluntariness 0.375 −0.1 0.157 0.157 Reducibility 0.333 0.07* 0.111 not considered Knowledge, experience 0.875 0.08 0.13 0.13
Endangerment 0.667 0.61 1.0 1.0
Subjective damage rating 1.0 not asked 0 not considered Subjective recurrence frequency 0.875 0.2 0.319 0.319 Future increase (paff i) not considered 0.22 not considered 0.364
*regression weight β failed narrowly the sufficient level of statistical significance (pβ=0.089), but
the correlation coefficient (r=0.07) was significant.
the workshop-PAF which had no corresponding survey vari-able, the PAF-value was set to a neutral PAF-value 1.
We obtained the following three equations, whereby in all runs, cases with at least one missing value due to non-response behavior of participants where excluded from the implementation.
– first implementation: workshop-PAF with pafi-values
derived from survey (test sample) and experts-weights
ai,ex as listed in Table 3 (column 2)
rperc=1 · 1 ·pafv·0.375 + pafr·0.333 + pafex·0.875 + pafd·0.667 + 1 · 1 + paff·0.875 0.375 + 0.333 + 0.875 + 0.667 + 1 + 0.875
(5)
– second implementation: workshop-PAF with pafi
-values derived from survey (test sample) and layper-sons 1-weights ai,lay 1as listed in Table 3 (column 4)
rperc=1 · 1 ·
pafv·0.157 + pafr·0.111 + pafex·0.13 + pafd·1.0 + 1 · 0 + paff·0.319
0.157 + 0.111 + 0.13 + 1.0 + 0 + 0.319
(6)
– third implementation: questionnaire-PAF with pafi
-values derived from survey (test sample) and layper-sons 2-weights ai,lay 2as listed in Table 3 (last column)
rperc=1 · 1 ·
pafv·0.157 + pafex·0.13 + pafd·1.0 + paff·0.319 + paff i·0.364 0.157 + 0.13 + 1.0 + 0.319 + 0.364
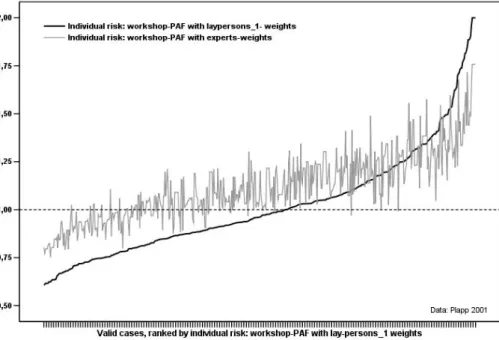
(7) The results of the first two runs are shown in Fig. 1. The calculated individual risks differ depending on the weights used. Thus, the model renders existing differences in risk perception of individuals and social groups.
Then the empirically generated questionnaire-PAF were implemented. The result of this third implementation run is represented in Fig. 2.
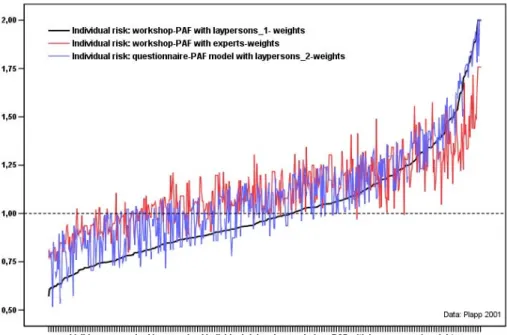
For a better comparison, the three model runs were plotted in a synoptic diagram shown in Fig. 3.
5 Discussion
5.1 Model behaviour
5.1.1 Linear approach design
The presented approach was designed following the method
of heuristic model generation. A commonly used linear
model was chosen as formal risk concept (cf. Eq. 1) to be expanded by an additional PAF term. These presumptions of linear model behaviour knowingly disregard findings of modern economic behaviour research (Kahneman and Tver-sky, 1979) describing a biased non-linear perception of risk in divergence from rational empirical effective risk. The linear model concept was nevertheless chosen in order to keep a first approach for individual risk perception as sim-ple and easily imsim-plementable as possible. Following this ob-jective, the parameters of the additional PAF-term expanding the principle risk equation were again defined to have linear and direct proportional impact.
5.1.2 Flexible model applicability
The presented formal model approach is designed to cope with deviating risk perceptions depending on different tar-get groups (e.g. social groups such as experts, laypersons). Weights ai are used to render the varying effect of different
Fig. 1. Calculated individual perceived risk using laypersons 1-weights ai,lay 1and experts-weights ai,ex. The dotted horizontal line at 1.0
represents the effective individual risk reff(on the x-axis the persons (survey data sample) were plotted, on the y-axis the effective risk reff).
Fig. 2. Calculated individual perceived risk: workshop-PAF with laypersons 1-weights ai,lay 1and the empirically generated
questionnaire-PAF with the respective laypersons 2-weights ai,lay 2. The dotted horizontal line at 1.0 represents the effective individual risk reff(on the x-axis the persons (survey data sample) were plotted, on the y-axis the effective risk reff).
PAF on the perception of individual risk, and hence to con-trol their impact on the model result. Therefore, depending on weight parameterisation (laypersons’ weights, experts’ weights), identical PAF will evoke varying values for per-ceived individual risk as model result (cf. Fig. 3).
Due to its flexibility, the model approach is also able to cope with missing data for specific PAF in the empiric
sur-vey data. In the course of the presented implementation
(cf. Sect. 4.3), the questionnaire design of the used real life survey data (Plapp, 2004) fitted the PAF definitions of the workshop-PAF quite well, a fact that facilitated the PAF
Fig. 3. Synoptic view of all three model implementations of calculated individual perceived risk: using the workshop-PAF with laypersons
1-weights ai,lay 1and experts-weights ai,ex (black, resp. red line) and the questionnaire-PAF model with the laypersons 2-weights ai,lay 2 (blue line). The dotted horizontal line at 1.0 represents the effective individual risk reff(on the x-axis the persons (survey data sample) were
plotted, on the y-axis the effective risk reff).
definition. However, one PAF was not measured in the sur-vey according to the workshop-selection: ‘subjective damage
rating’ pafe. The model approach is nevertheless well able
to cope with such a vacancy. In such cases the impact of the specific PAF on the model result may be eliminated by using a neutral value of 1.
5.2 Model plausibility
The model approach is explicitly designed to calculate plau-sible values for perceived individual risk, such as casualties or actual monetary values. The plausibility analysis illus-trated in Sect. 4.1.2 (case study) confirms a realistic model behaviour and plausible orders of magnitude for calculated perceived risk as model result.
Furthermore, the model equation concept is designed to keep over- as well as underestimation within a relatively nar-row range when perceiving the effective individual risk. This is assured by an observance of PAF boundary conditions as defined in Sect. 3.2. However, PAF boundary conditions may well be defined individually in alternative ways in order to meet specific application needs, such as to narrow the under-or the overestimation branch, under-or to increase the maximum possible under-/overestimation (e.g. [0.1,1] or [1,5]).
5.3 Model verification
5.3.1 “Real-life” implementation of the approach
The presented implementation using actual empiric data (Sect. 4.3) asserts the applicability of the model approach. However, one cannot readily conclude from this attempt that experts and laypersons differ in their perception of individ-ual risk. The three implementations may only display differ-ences in PAF weights for the two groups, not in the magni-tude of the respective PAF. Graph deviations shown in Figs. 1 and 2 are only caused by the use of different weights (ex-perts vs. laypersons perspective) and - in Fig. 3 - by a slightly modified combination of PAF in the empirically deduced se-lection of PAF.
5.3.2 Crucial peculiarities of the performed model
applica-tion
Derivations on risk acceptance itself may explicitly not be drawn from the presented model application. This is due to the fact that the model application merely aimed to investi-gate a method for PAF weight deduction and quantification. One and the same empiric dataset may however not be used for weight quantification as well as for PAF quantification (e.g. for the purpose of model verification), which would rep-resent a short circuit. Therefore, an actual verification of the model itself could not yet be realised due to a lack of suitable and sufficiently comprehensive empiric data to quantify PAF.
Hence, conclusions on effective risk acceptance with help of the presented model application using the available empiric data are not possible.
6 Conclusions
6.1 Model achievements
Proven applicability, flexibility, and plausibility affirm major benefits by the presented model approach.
The presented model concept brings significant improve-ments over present methods to assess risk aversion or ac-ceptance. Known model approaches are based on the sim-plified assumption that perception and acceptance of a risk
are merely a function of effective event consequences eeff
(cf. Sect. 2.3). With rising magnitude damage is only ac-cepted at low probabilities. However, perception and be-haviour research (e.g. Kahneman and Tversky, 1979; Tver-sky and Kahneman, 1992) observed that besides the magni-tude of an event consequences also its probability and some qualitative aspects of a risk are relevant for its perception and evaluation and are thus also relevant for its acceptance. The concept presented in this study provides a way to better in-tegrate the relevant perception factors in the risk evaluation process.
6.2 Fields of application and model limitations
Risk perception is a complex issue, and so far no universal formal theories for risk perception, evaluation, or acceptance exist (cf. Sect. 1). The presented results hence represent a first attempt to quantify the factors driving the perception.
However, they also reflect those limitations of the psy-chometric paradigm which have been mentioned in the risk perception literature (e.g. Krimsky, 1992; Wilkinson, 2001): Both the empirically deduced selection of PAF and the workshop-PAF and their applications may only explain how risk perception differs, but not why it differs. In addition, the psychometric paradigm, and thus also the formal model proposed in this paper, generate only “snap shots” and con-sider neither the socio-cultural nor the historical context of risk perception, since they are highly individualistic and non-contextual approaches.
Taking into account these limitations, the presented ap-proach may well be recommended to quantify risk percep-tion by individual persons in a formal and technical way. Main fields of application may for instance be risk communi-cation issues in illustrating differing perspectives of experts and non-experts. However, for decision making processes this model will have to be applied with caution, since it is by definition not designed to quantify risk acceptance or risk evaluation.
6.3 Still to be done
In accordance with Sect. 5.3.2, the quantitative accuracy of the model calculations in reference to observed individual risk perception are still to be tested extensively. Suitable and independent empiric data will be required for such a model verification. This will however require a major effort and considerable expenses for an inevitable quite comprehensive empiric survey.
Further challenges will be a comprehensive rating of the model validity concerning various conceivable application objectives, such as risk communications or educational pur-poses (model validation and evaluation).
6.4 Future advancements
Several known studies constate an overestimation of low occurrence probabilities and a underestimation of average or high occurrence probabilities of losses, known as the Prospect Theory (Kahneman and Tversky, 1979; Tversky and Kahneman, 1992; Eisenf¨uhr and Weber, 2003; Neumann and Morgenstern, 2004). Furthermore, with increasing ex-tent of effective damage, the perceived damage rises to a lesser extent (declining graph gradient). Tversky and Kahne-man (1992) define concave power functions for eeff,i
(weight-ing function) and more complex s-shaped power function for
peff,i(value function). A future integration of Prospect The-ory into the presented approach will take this biased non-linear perception of risk into account. Then, the approach can be used to calculate the collectively perceived risk, too. The empirically deduced Prospect Theory functions may be comprehended as valid for an entire representative popula-tion due to the origin of their variables as median values. As a consequence, integration of Prospect Theory can turn the model more valid for normative processes as well (e.g. deci-sion making in natural hazard mitigation).
Acknowledgements. This work was realised in the course of a
project on behalf of and financed by the following agencies:
– Swiss National Platform for Natural Hazards (PLANAT) – Swiss Federal Agency for Environment, Forest and Landscape
(BUWAL)
– Swiss Federal Agency for Water and Geology (BWG) – Swiss Federal Agency for Civil Defense (BABS)
The survey had been realised within the framework of the Postgraduate Programme “Natural Disasters” and carried out at the Institute for Insurance, Institute for Finance, Banking and Insurance, University of Karlsruhe (TH), Germany. It was financed by the German Research Foundation DFG, the Federal State of Baden-Wuerttemberg and in addition by the Stiftung Umwelt und Schadenvorsorge der SV-Versicherungen, Stuttgart, Germany.
Edited by: M.-C. Llasat
References
Amman, W., Bischof, N., Br¨undl, M., Schneider, T., and Warner, K.: Teilprojekt B: Methoden-Evaluation. Schlussbericht, Tech. rep., PLANAT, 2004.
BABS: Katastrophen und Notlagen in der Schweiz (KATARISK). Eine Risikobeurteilung aus der Sicht des Bev¨olkerungsschutzes, Tech. rep., Bundesamt f¨ur Bev¨olkerungsschutz (BABS), http://www.bevoelkerungsschutz.admin.ch/internet/bs/de/home/ themen/Verbundsystem/gefaehrdungen/katarisk.html, access date: 25.1.2005, 2003.
Belzer, R.: Getting beyond the grin and bear in the practice of risk management, Reliability Engineering and System Safety, 72, 137–148, 2001.
Bohnenblust, H.: Die Anwendung eines risikoorientierten Sicherheits-Modells zur Beurteilung der Neubaustreckentun-nel der Deutschen Bundesbahn, in: Risikountersuchungen als Entscheidungsinstrument – Risk analysis as a decision tool, edited by: Yadigaroglu, Y. and Chakraborty, S., vol. 1, pp. 341– 361, Verlag T ¨UV Rheinland, K¨oln, 1985.
Bohnenblust, H. and Schneider, T.: Risk appraisal – can it be improved by formal decision models?, in: Uncertainty in risk assessment, risk management and decision making, edited by: Covello, V. T., Lave, L. B., Moghissi, A., and Uppuluri, V., vol. 4 of Advances in risk analysis, pp. 71–87, Plenum Press, New York/London, 1984.
Bohnenblust, H. and Slovic, P.: Integrating technical analysis and public values in risk-based decision making, Reliability Engi-neering and System Safety, 59, 151–159, 1998.
Brun, W.: Cognitive components in risk perception: natural vs. manmade risks, Journal of Behavioral Decision Making, 5, 117– 132, 1992.
BUWAL, ed.: Handbuch I zur St¨orfallverordnung StFV. Richtlinien f¨ur Betriebe mit Stoffen, Erzeugnissen und Sonderabf¨allen., Eid-gen¨ossische Drucksachen- und Materialzentrale (EDMZ), Bern, 1991.
DeChano, L. and Butler, D.: Analysis of public perception of debris flow hazard, Disaster Prevention and Management: An Interna-tional Journal, 10, 261–269, 2001.
Eisenf¨uhr, F. and Weber, M.: Rationales Entscheiden, Springer-Verlag, Berlin, Heidelberg, New York, 3 edn., 2003.
Farmer, F.: Siting criteria – a new approach, in: Containment and siting of nuclear power plants, edited by: IAEA, vol. 1, pp. 303– 329, International atomic energy agency (IAEA), Wien, 1967. Finlay, P. J. and Fell, R.: Landslides: risk perception and
accep-tance, Canadian Geotechnical Journal, 34, 169–188, 1997. Fischhoff, B., Slovic, P., Lichtenstein, S., Read, S., and Combs, B.:
How safe is safe enough? A psychometric study of attitudes to-wards technological risks and benefits, Policiy Sciences, 9, 127– 152, 1978.
Fischhoff, B., Slovic, P., and Lichtenstein, S.: “The public” vs. “the experts”: perceived vs. actual disagreements about risk of nu-clear power, in: The analysis of actual versus perceived risks, edited by: Covello, V. T., Flamm, W. G., Rodricks, J. V., and Tardiff, R. G., vol. 1 of Advances in risk analysis, pp. 235–249, Plenum Press, 1981.
Geiger, G.: Risikobereitschaft und Risikoaversion in der Theo-rie rationaler ¨okonomischer und technischer Entscheidungen, in: Gesellschaft – Ethik – Risiko, Ergebnisse des Polyprojekt-Workshop vom 23–25 November 1992, edited by: Ruh, H. and
Seiler, H., vol. 1, pp. 17–47, Birkh¨auser, Basel, Boston, Berlin, 1993.
Griesmeyer, J. M.: Risk aversion of the public or risk proneness of experts?, Transactions of the american nuclear society, 41, 446– 447, 1982.
Heinimann, H. R.: Risk Management – a framework to improve effectiveness and efficiency of resource management decisions, in: 23rd session of the European Forestry Commission’s working warty on the management of mountain watersheds, edited by: Greminger, P., vol. 1, pp. 16–19, Bundesamt f¨ur Wald, Umwelt und Landschaft (BUWAL), Davos, 2002.
Jasanoff, S.: The political science of risk perception, Reliability Engineering and System Safety, 59, 91–99, 1998.
Kahneman, D. and Tversky, A.: Prospect Theory: an analysis of decision under risk, Econometrica, 47, 263–291, 1979.
Karger, C. and Wiedemann, P.: Kognitive und affektive Kompo-nenten der Bewertung von Umweltrisiken, Zeitschrift f¨ur exper-imentelle Psychologie, 45, 334–344, 1998.
Kasperson, R. E., Renn, O., Slovic, P., Brown, H. S., Emel, J., Goble, R., Kasperson, J. X., and Ratick, S.: The social amplifica-tion of risk: a conceptual framework, Risk Analysis, 8, 177–187, 1988.
Krimsky, S.: The role of theory in risk Studies, in: Social theories of risk, edited by Krimsky, S. and Golding, D., pp. 3–22, Praeger, Westport/London, 1992.
Lima, M.: Dam failure versus flood risk perception, in: Dams and safety management at downstream valleys, edited by: Be-tamio de Almeida, T. and Viseu, A., pp. 103–110, Balkema, Rot-terdam, 1997.
Marris, C., Langford, I., Saunderson, T., and O’Riordan, T.: Explor-ing the “psychometric paradigm”: comparisons between aggre-gate and individual analyses, Risk Analysis, 17, 303–312, 1997. Merz, H. A., Schneider, T., and Bohnenblust, H.: Bewertung von technischen Risiken, Beitr¨age zur Strukturierung und zum Stand der Kenntnisse. Modelle zur Bewertung von Todesfallrisiken., vol. 1, vdf Verlag der Fachvereine, Z¨urich, 1995.
M¨unchenerR¨uck: Naturkatastrophen in Deutschland. Schaden-erfahrungen und Schadenpotentiale, Tech. rep., Munich Re, M¨unchen, 1999.
NDK: Begriffe, NDK “Risiko und Sicherheit”, 2001.
Neumann, J. and Morgenstern, O.: Theory of games and economic behavior, Princeton University Press, 2004.
Pidgeon, N.: Risk assessment, risk values and the social science programme: why we do need risk perception research, Reliabil-ity Engineering and System Safety, 59, 5–15, 1998.
Plapp, T.: Risk perception survey natural hazards summer 2001, un-published data, Postgraduate Programme Natural Disasters and Insitute for Insurance, Universit¨at Karlsruhe, Germany, 2001. Plapp, T.: Wahrnehmung von Risiken aus Naturkatastrophen.
Eine empirische Untersuchung in sechs gef¨ahrdeten Gebieten S¨ud- und Westdeutschlands, vol. 2 of Karlsruher Reihe II: Risikoforschung und Versicherungsmanagement, Verlag f¨ur Ver-sicherungswirtschaft, 2004.
Plapp, T. and Werner, U.: Understanding risk perception from nat-ural hazards: examples from Germany, in: CENAT-Workshop RISK 21, Coping with risks due to natural hazards in the 21st century, edited by: CENAT, Balkema, Rotterdam, in press, 2006. Renn, O.: The role of risk perception for risk management,
Rohrmann, B.: Risk perception research. Review and Documenta-tion. Revised Edition, Research Center Juelich, Program group Man, Environment, Technology, Risk Communication Studies 69, Juelich, 1999.
Rowe, G. and Wright, G.: Differences in expert and lay judgements of risk: myth or reality?, Risk Analysis, 21, 341–356, 2001. Saaty, T. L.: Decision making for leaders. The analytic hierarchy
process for decisions in a complex world, RWS Publications, 3 edn., 2001.
Sandman, P. M.: Risk communication: facing public outrage, 1987. Sandman, P. M.: Hazard versus Outrage in the public perception of risk, in: Effective risk communication: the role and responsibil-ity of government and nongovernment organizations, edited by Covello, V. T., McCallum, D. B., and Pavlova, M. T., vol. 4 of Contemporary issuss in risk analysis, pp. 45–49, Plenum Press, New York, 1989.
Sandman, P. M.: Managing outrage: a primeur, Engineer-ing News-Record, pp. A19–A23, http://www.psandman.com/ articles/amsaside.htm; access date: April 31, 2006, 1999a. Sandman, P. M.: Risk = Hazard + Outrage. Coping with
contro-versy about utility risks, Engineering News-Record, pp. A19– A23, http://www.psandman.com/articles/amsa.htm; access date: April 31, 2006, 1999b.
Siegrist, M., Gutscher, H., Orlow, P., and Yoker, m.: Hochwasserge-fahren in der Schweiz: Risikobewusstsein in der Bev¨olkerung und die Implikationen f¨ur eine erfolgreiche Risikokommunika-tion, Schlussbericht, Tech. rep., Universit¨at Z¨urich, Sozial-forschungsstelle, 2004.
Simon, H. A.: A behavioral model of rational choice, Quarterly Journal of Economics, 111, 99–118, 1955.
Simon, H. A.: The science of the artificial, MIT Press, Cambridge (Mass.), 2 edn., 1966.
Sj¨oberg, L.: Factors in risk perception, Risk Analysis, 20, 1–11, 2000a.
Sj¨oberg, L.: The methodology of risk perception research, Quality and Quantity, 34, 407–418, 2000b.
Skjong, R. and Wentworth, B. H.: Expert judgement and risk per-ception, in: Offshore and polar engineering conference, ISOPE, vol. IV, pp. 537–544, Stavanger, 2001.
Slovic, P.: Perception of risk, Science, New series, 236, 280–285, 1987.
Slovic, P.: Perceptions of risk: reflections on the psychometric paradigm, in: Social theories of risk, edited by: Krimsky, S. and Golding, D., pp. 117–152, Praeger, Westport/ London, 1992. Slovic, P.: The perception of risk, Bertram/Ingram, 2000.
Slovic, P., Fischhoff, B., and Lichtenstein, S.: Perceived risk: psy-chological factors and social implications, Proceedings of the Royal Society of London. Series A, Mathematical and Physical Sciences, 376, 17–34, 1981.
Slovic, P., Fischhoff, B., and Lichtenstein, S.: Risk Aversion, social values, and nuclear safety goals, Transactions of the american nuclear society, 41, 448–449, 1982.
Slovic, P., Fischhoff, B., and Lichtenstein, S.: The psychometric study of risk perception, in: Risk evaluation and management, edited by Covello, V. T., Menkes, J., and Mumpower, J., vol. 1 of Contemporary issues in risk analysis, pp. 3–24, Plenum Press, New York, 1986.
Troxler, C., Guenter, R., and Bohnenblust, H.: Schutz vor Naturge-fahren, Schweizer Ingenieur und Architekt, 39, 1035–1040, 1989.
Tversky, A. and Kahneman, D.: Advances in Prospect Theory: cu-mulative representation of uncertainty, Journal of Risk and Un-certainty, pp. 297–323, 1992.
Wilkinson, I.: Social theories of risk perception: at once indispens-able and insufficient, Current Sociology, 49, 1–22, 2001.