HAL Id: hal-00641340
https://hal.inria.fr/hal-00641340
Submitted on 15 Nov 2011
HAL is a multi-disciplinary open access
archive for the deposit and dissemination of
sci-entific research documents, whether they are
pub-lished or not. The documents may come from
teaching and research institutions in France or
abroad, or from public or private research centers.
L’archive ouverte pluridisciplinaire HAL, est
destinée au dépôt et à la diffusion de documents
scientifiques de niveau recherche, publiés ou non,
émanant des établissements d’enseignement et de
recherche français ou étrangers, des laboratoires
publics ou privés.
Pairwise Testing of Dynamic Composite Services
Ajay Kattepur, Sagar Sen, Benoit Baudry, Albert Benveniste, Claude Jard
To cite this version:
Ajay Kattepur, Sagar Sen, Benoit Baudry, Albert Benveniste, Claude Jard. Pairwise Testing of
Dynamic Composite Services. The 6th international symposium on Software engineering for adaptive
and self-managing systems, SIGSOFT ACM Special Interest Group on Software Engineering, IEEE
CS, May 2011, Waikiki, Honolulu, Hawaii, United States. pp.138–147, �10.1145/1988008.1988028�.
�hal-00641340�
Pairwise Testing of Dynamic Composite Services
Ajay Kattepur
∗ IRISA/INRIA Rennes-Cedex, FranceAjay.Kattepur@irisa.fr
Sagar Sen
INRIA Sophia-Antipolis, FranceSagar.Sen@inria.fr
Benoit Baudry
IRISA/INRIA Rennes-Cedex, FranceBenoit.Baudry@irisa.fr
Albert Benveniste
IRISA/INRIA Rennes-Cedex, FranceAlbert.Benveniste@irisa.fr
Claude Jard
ENS Cachan, IRISABruz, France
Claude.Jard@irisa.fr
ABSTRACT
Online services encapsulate enterprises, people, software sys-tems and often operate in poorly understood environments. Using such services in tandem to predictably orchestrate a complex task is one of the principal challenges of service-oriented computing. A composite service orchestration so-liciting multiple atomic services is plagued by a number of sources of variation. For instance, availability of an atomic service and its response time are two important sources of variation. Moreover, the number of possible variations in a composite service increases exponentially with increase in the number of atomic services. Testing such a composite ser-vice presents a crucial challenge as its often very expensive to exhaustively examine the variation space. Can we effec-tively test the dynamic behavior of a composite service using only a subset of these variations? This is the question that intrigues us. In this paper, we first model composite service variability as a feature diagram (FD) that captures all valid configurations of its orchestration. Second, we apply pair-wise testing to sample the set of all possible configurations to obtain a concise subset. Finally, we test the composite ser-vice for selected pairwise configurations for a variety of QoS metrics such as response time, data quality, and availability. Using two case studies, Car crash crisis management and eHealth management, we demonstrate that pairwise gener-ation effectively samples the full range of QoS varigener-ations in a dynamic orchestration. The pairwise sampling technique eliminates over 99% redundancy in configurations, while still calling all atomic services at least once. We rigorously eval-uate pairwise testing for the criteria such as: a) ability to sample the extreme QoS metrics of the service b) stable behavior of the extracted configurations c) compact set of configurations that can help evaluate QoS tradeoffs and d) comparison with random sampling.
∗This work was partially funded by the ANR national re-search program DocFlow (ANR-06-MDCA-005), by the R´e-gion Bretagne under project CREATE ActivDoc, by INRIA under Equipe associ´ee FOSSA and from the European Com-munity’s Seventh Framework Programme FP7/2007-2013 under grant agreement 215483 (S-Cube).
Permission to make digital or hard copies of all or part of this work for personal or classroom use is granted without fee provided that copies are not made or distributed for profit or commercial advantage and that copies bear this notice and the full citation on the first page. To copy otherwise, to republish, to post on servers or to redistribute to lists, requires prior specific permission and/or a fee.
SEAMS’11, May 23 -24, 2011, Waikiki, Honolulu, HI, USA Copyright 2011 ACM 978-1-4503-0575-4/11/05 ...$10.00.
Categories and Subject Descriptors
H.3.5 [Online Information Services]: Web-based Ser-vices, Evaluation and assurance for self-* systems
General Terms
Performance, Experimentation, Measurement, Reliability
Keywords
Web Services, Pairwise Testing, QoS
1.
INTRODUCTION
In a service-oriented world actors such as data sources, knowledge bases, people, processes, businesses, hardware sensors/actuators and software systems are all seen as ser-vices. In such a world, a composite service orchestrates a number of self-contained atomic services to perform com-plex tasks. The unpredictable and dynamic nature of each of these atomic services ultimately renders the functional and non-functional behavior of a composite service unpredictable and dynamic. For instance, the crisis management system in a large city orchestrates a number of atomic services such as the ambulance service, police service, GPS service, and phone service. The variable nature of each of these services renders the overall behavior of the crisis management system variable and dynamic.
Untested dynamic behavior of a composite service can have several critical consequences. For instance, a crisis management system dealing with an earthquake must mobi-lize a multitude of services within a predictable time frame and seldom deviate from it. An untested composite service may exhibit unreliable deviations from contractual ments on Quality of Service (QoS) [22]. Service level agree-ments (SLAs) [16] are the industry standard to specify con-straints on QoS for both service providers and consumers. Habitual deviations from SLAs are a result of ignoring QoS outliers and dynamic behavior of a composite service.
A key challenge in testing a composite service emerges from its inherent variability. We enlist three important di-mensions to composite service variability (a) The variation in selection/non-selection of equivalent atomic services used in a composite service (b) The variation in QoS of each of these atomic services leads to variations in composite service QoS. For instance, in [19] we develop probabilistic models of QoS variability in atomic services (c) The variation in the way atomic services are called in a composite service such as in sequence or in parallel. In this paper, we are primarily con-cerned with the first two sources of variability. Changes in the orchestration can be triggered by these sources, enabling self-* composite services. We use the general term dynamic
composite service to encompass self-* service-oriented sys-tems.
With an increase in number of equivalent atomic services there is an exponential increase in the invocations of a com-posite service. It is impractical and computationally expen-sive to test a composite service for all its possible variations. Therefore we ask, can we effectively test the dynamic be-havior of a composite service using only a subset of these variations? Answering this question is the subject of this paper.
We present a methodology for combinatorial interaction testing (CIT) dynamic composite services. In particular, we perform pairwise testing of composite services. The method-ology consists of three main phases: (1) Modeling variability in a composite service (2) Generation of composite service configurations satisfying pairwise interactions (3) Analyz-ing these composite service configurations to test composite service QoS. In our approach, we model the variability of a composite service as a feature diagram where each fea-ture represents an atomic service. Inter-feafea-ture constraints represent dependencies between atomic services. Feature Diagrams (FD) [10] provide a formal framework to spec-ify authorized variations in the configuration of a composite service. We transform the feature diagram and pairwise in-teractions between features (or atomic services) to a single constraint satisfaction problem in the formal specification language Alloy [8]. We solve the Alloy model to generate valid configurations of the composite service. The genera-tion methodology is an extension of our previous work[18] to dynamic composite services. We empirically investigate the QoS of the resulting configurations. We demonstrate that combinatorial interaction testing (CIT) [5] to select a subset of configurations that covers all valid pairwise interactions of services is an efficient technique to sample configurations of an orchestration. Our premise is based on the observa-tion that most software faults are triggered by interacobserva-tions between a small number of variables [13]. For example, con-sider the car crash crisis management system case study [12] that we will examine in this paper. With 25 optional features that may / may not be invoked in a specific orches-tration, the total number of exhaustive tests required will be 33, 554, 432. This is an extremely large number of tests that would considerable time and effort for QoS analysis. The number of tests satisfying pairwise interaction is just 185 reducing the number of required tests by 99.99%.
Pairwise testing has been used to detect faults in software systems in extensive prior research [5]. Our main contribu-tion is the applicacontribu-tion of pairwise testing to sample configu-rations in dynamic composite services: one form of efficient self-monitoring of variable behavior. This is based on the hypothesis that composite services’ QoS behavior uncover faults in a service-oriented systems where choice of atomic services and the orchestration between them are primary ar-tifacts. The extensive empirical studies, based on two case studies which are the car crash crisis management system
(C3MS ) [12] and a eHealth administration system, support
our claims about pairwise testing dynamic composite services:
1. C1: Pairwise testing is an sufficient coverage strategy for dynamic composite service orchestrations
2. C2: Pairwise testing covers a wide range of QoS in dynamic composite services
3. C3: Pairwise testing is better than random testing 4. C4: Pairwise testing is a stable strategy to define
global SLA for a dynamic composite service
5. C5: Pairwise testing is useful to generate families of orchestrations with differing SLAs
The paper is organized as follows. Section 2 provide foun-dational material to understand our paper. This includes feature diagrams in 2.1, the Orc language for specifying or-chestrations in 2.2, pairwise configuration generation in 2.4, and formal description of QoS metrics in 2.5.The methodol-ogy followed in this paper is discussed in Section 3. The case studies for experiments are put forth in Section 4. The ex-periments related to QoS analysis are presented in 5. Com-parison with respect to random generation and the stability of pairwise analysis are shown in 5.3 and 5.4, respectively. Further deliberation and perspectives of our analysis scheme are presented in Section 5.5. Threats to the validity of the empirical studies are discussed in Section 5.6. Related work in literature is put forth in Section 6. We conclude in Section 7.
2.
FOUNDATIONS
In this section we present background or foundational
ideas required to understand the rest of the paper. We
present these concepts to make the paper as self-contained as possible.
2.1
Feature Diagrams
Feature Diagrams (FD) introduced by Kang et al. [10] compactly represent all the products (referred to as config-urations in this paper) of a software product line (SPL) in terms of features which can be composed. Feature diagrams have been formalized to perform SPL analysis [21]. In [21], Schobbens et al. propose a generic formal definition of FD which subsumes many existing FD dialects. We define a FD as follows:
• A FD consists of k features f1, f2, ..., fk
• Each feature fimay be associated with a software asset
such as an atomic service.
• Features are organized in a parent-child relationship in a tree T . A feature with no children is called a leaf.
• A parent-child relationship between features fpand fc
are categorized as follows:
– Mandatory - child feature fc is required if fp is
selected.
– Optional - child feature fc may be selected if fp
is selected.
– OR - at least one of the child-features fc1,fc2,..,fc3
of fpmust be selected.
– XOR - one of the child-features fc1,fc2,..,fckof fp
must be selected.
• Cross tree relationships between two features fi and
fjin the tree T are categorized as follows:
– fi requires fj - The selection of fi in a product
implies the selection of fj.
– fi excludes fj - fi and fj cannot be part of the
same product and are mutually exclusive.
2.2
Service Orchestrations using Orc
A dynamic composite service is an orchestration of atomic services. We express the orchestration of atomic services available in an FD using the Orc language. Orc [15] serves as a simple yet powerful concurrent programming language to describe and execute service orchestrations.
The fundamental declaration used in the Orc language is a site. The type of a site is itself treated like a service - it is passed the types of its arguments, and responds with a
return type for those arguments. An Orc expression repre-sents an execution and may call external services to publish some number of values (possibly zero).
Orc has the following combinators that are used on vari-ous examples as seen in [15]. The Parallel combinator F |G, where F and G are Orc expressions, runs by executing F and G concurrently. Whenever F or G communicates with a ser-vice or publishes a value, F |G does so as well. The execution of the Sequential combinator F >x> G starts by executing F . Sequential operators may also be written compactly as F ≫ G. Values published by copies of G are published by the whole expression, but the values published by F are not published by the whole expression; they are consumed by the variable binding. If there is no response from either of the sites, the expression does not terminate. While the above two composition operators are for creating threads, Orc uses the following construct to prune operations. The Pruning combinator, written F <x< G, allows us to block a com-putation waiting for a result, or terminate a comcom-putation. The execution of F <x< G starts by executing F and G in parallel. Whenever F publishes a value, that value is pub-lished by the entire execution. When G publishes its first value, that value is bound to x in F , and then the execution of G is immediately terminated. The Otherwise combina-tor, written F ; G has the following execution. First, F is executed. If F completes, and has not published any values, then G executes. If F did publish one or more values, then G is ignored. The publications of F ; G are those of F if F publishes, or those of G otherwise. In the Fork-Join combi-nator, two processes are invoked and run concurrently. The process waits until a response is obtained from both. This may be represented as (F, G) where the process waits for responses from both atomic services F and G.
2.3
Feature Diagrams with Orchestrations
The FD and the orchestration cover two dimensions that are complementary to each other. While the FD represents the variability in the configurations, the orchestration spec-ifies the order in which the services are called. Making use of the terminology in [21], primitive features are “features” that are of interest and that will be incorporated in real-world services. On the contrary, decomposable features are just intermediate nodes used for decomposition. It is up to the modeler to determine such classification of features in the FD. We extend the semantics given in [21] to ensure compatibility of an orchestration with the feature model as follows:
• The set of available services S are the primitive nodes of the FD D;
• For each orchestration, the set of corresponding ser-vices invoked (denoted N );
• N ⊆ S in a configuration;
• A model of D is a subset of its (primitive and decom-posable) nodes;
• There must exist a model of D ([[D]]) such that [[D]] ∩ S = N (a model of a FD is a subtree that is valid w.r.t. the operators and the dependence relation).
Drawing from the real-world services and the constraints shown in a FD, the composite service may be developed by an orchestrator.
2.4
Combinatorial Interaction Testing
We use combinatorial interaction testing (CIT) to synthe-size a subset of configurations represented by the FD of a dynamic composite service. Originally, CIT was proposed by Cohen et al. [5] to select a subset of all combinations of
variables that define the input domain of a program, while still guaranteeing a certain level of coverage. This has led to the definition of pairwise interaction testing, or 2-wise testing. This samples the set of all combinations in such a way that all possible pairs of variable values are included in the set of test data. Pairwise testing has been generalized to t-wise testing which samples the input domain to cover all t-wise combinations. In this paper, a set of test data is often represented in the form of a covering array that contains all t-wise interaction of features in a FD.
Definition. 1. Covering Array - A covering array CA
(N ; t, k, v) is a N × k array on v symbols with the property that every N × t sub-array contains all ordered subsets of size t from v symbols at least once.
From the definition of a covering array, the strength t of the array is the parameter that allows achieving 2-wise (pair-wise), 3-wise or t-wise combinations. The k columns on this array correspond to all the variables in the input do-main which in our case are the features in a FD. For the generation of dynamic composite service configurations, k is the number of services, and v is 2 since we have only boolean variables (services may be present or absent in a configuration). The covering array is a set of configurations of features.
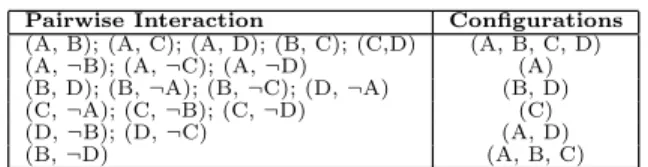
We demonstrate the concept of a minimal covering array using an example. Consider the set of four atomic services (A, B, C, D) with varying response times. The atomic
ser-vices can be composed in 24
exhaustive combinations. How-ever, if we consider the service combinations in pairs, we require fewer configurations. These can be subsumed by 6 sets of configurations that cover these pairs of interactions resulting in removal of 62.5% of redundancies. This is shown in Table 1 where, for example, interaction (A, B) refers to calling both service A and B while (A, ¬B) refers to calling only A with B explicitly not invoked.
Pairwise Interaction Configurations (A, B); (A, C); (A, D); (B, C); (C,D) (A, B, C, D) (A, ¬B); (A, ¬C); (A, ¬D) (A) (B, D); (B, ¬A); (B, ¬C); (D, ¬A) (B, D) (C, ¬A); (C, ¬B); (C, ¬D) (C) (D, ¬B); (D, ¬C) (A, D)
(B, ¬D) (A, B, C)
Table 1: Subsuming pairwise interactions in config-urations
Essentially, the use of pairwise sampling reduces the num-ber of cases needed to generate a range of outputs, a few of which that may be considered faulty. Consider a system S having a set of inputs p and a set of outputs q. With random testing, in which input vectors satisfying p are randomly generated, and the output of each execution is compared with the postcondition q as a set of tests. As structural fea-tures of system S are hidden, the efficacy of using manually designed test cases can be seen mainly through their cost effectiveness. In our case, we view this as the decrease in the number of samples needed to generate extreme output values (faults).
Let ω ∈ p be a set of tests for the system S. This produces
a set of specifications ω→ qS ′, where q′∈ q. A successful set
of tests is one that has a minimal cardinality of cases |ω| and
maximal variance in the set of outputs q′. This generates a
range of values as the system output. Empirical studies have shown pairwise sampling to be superior for precisely such a case - efficiently generating a minimal set of tests to generate all dual combinations of input values. This in turn produces
a range of outputs q′ that have higher variance than other
The problem of generating a minimal covering array for a set of variables is a complex optimization problem that has been studied in extensive prior work for example [5]. It is important to notice that there exist very few studies that have tackled the automatic generation for CIT in the pres-ence of constraints between variables [6]. In order to include properties that forbid combinations of values, CIT genera-tion techniques have to allow the introducgenera-tion of constraints in the algorithms that generate covering arrays. In recent work [18], we present a solution to generate t-wise configu-rations that satisfy all simultaneously constraints modeled in a feature diagram.
We transform the feature diagram to constraint satisfac-tion problem model in the language Alloy as described in [18]. The features in the FD are transformed to concepts in Alloy called signatures. Inter-feature constraints in the FD are transformed to Alloy facts. All pair-wise interactions between features are transformed to Alloy predicates. The goal of solving the Alloy model is to find the minimal set of configurations that cover conjunctions of all valid pair-wise predicates. The first step involves detection of all valid pairs that conform to the FD. In the second step, we construct conjunctions of pair-wise predicates and solve them via in-crementally increasing the scope of the solution size. The result is a minimal set of configurations that cover conjunc-tions of all valid pairs. At times the SAT solver in Alloy is not scalable for a large FD. We apply divide-and-compose approaches as described in [18] to handle this scalability is-sue.
2.5
QoS Aspects of the Orchestration
In this paper, we test dynamic composite services for their probabilistic QoS behavior. In this section we summarize our work in [19], that presents the derivation of composite service QoS behavior from individual atomic service behav-iors. Probabilistic analysis of QoS parameters as described in [19] [7] provide a more realistic study of actual services’ behavior. The following QoS parameters have been chosen for experiments in this paper:
1. Latency / Response Time (T ) - Denotes the overall delay due to the time taken by a service to respond. It is a discrete value that may be modeled as a long tailed distribution incorporating some rare deviations. 2. Availability (α) - The probability that a service is ac-tive and can respond to a service call. For a well man-aged service, this value is generally quite high. 3. Cost (χ) - Refers to the monetary cost associated with
each invocation of a particular atomic service. 4. Data Quality (ξ) - A subjective measure of trade off to
high Cost and Response times of services. It measures the ”Quality” of the output of the service and the ben-eficial aspects of including a new atomic service into the composite orchestration.
These QoS metrics are normally defined for an atomic ser-vice. We derive these QoS metrics for a dynamic composite service by analyzing its orchestration. This analysis involves giving a semantic to a composite service QoS based on in-dividual atomic service QoS and the Orc combinators (see
Section 2.2) associating them. Taking two sites siand sj, the
QoS metrics may be computed as shown in Table 2 based on the Orc combinators in use. The cases of composing the
ser-vice sijusing the sequential and fork-join combinators have
been considered. The latency, cost and availability metrics
for the composite service sijare derived as shown in [4] with
M ax(p, q) representing the maxima of the values p and q. For the sequential case, the latency and cost of the composite service is a sum of the atomic services’ parameters while the
availability is a product of such parameters. Similarly, the maxima of the atomic services’ response times contributes to the global response time under parallel invocation.
Orc Code sij , si ≫ sj sij , (si, sj ) Latency T(sij ) = T (si) + T (sj ) T(sij ) = Max(T (si), T (sj ))
Cost χ(sij ) = χ(si) + χ(sj ) χ(sij ) = χ(si) + χ(sj ) Availability α(sij ) = α(si) × α(sj ) α(sij ) = α(si) × α(sj )
Table 2: QoS metrics extended to Orc combinators. Some QoS metrics of an atomic service may be modeled as a random variable conforming to a probability distribu-tion. We need to simulate the QoS metric by sampling from a probability distribution. For instance, we need to simulate the probabilistic response time distributions of each atomic service as done in [19]. By varying the degrees of freedom ν and non-centrality parameter δ in the t-distribution df ittool of MATLAB, it is possible to generate various heavy tailed distributions that mimic the response times of services. We sample these distributions to simulate the response times of actually invoked atomic services. In this paper, the t-distribution fitting was used to generate various distribu-tions of services’ response times.
3.
METHODOLOGY
We present the methodology for pairwise testing and QoS analysis of dynamic composite services.
1. Inputs: The inputs to our methodology is tuple (S, F D, O, Strategy):
(a) S is the set of all atomic services that can be used in a dynamic composite service.
(b) F D is a feature diagram that specifies various features in a dynamic composite service and the constraints between them. Primitive features in an F D are each associated with an atomic
ser-vice Si. A valid configuration Ckof a F D is the
set of m features f1, f2, ..., fM that conform to
the constraints in the F D. The features in valid configurations represents sets of atomic services
S1, S2, ..., SN. The sets are subsets of S. See
Sec-tion 2.1 for formal definiSec-tion of a F D.
(c) O is the overall orchestration of the dynamic com-posite service. The orchestration is reconfigured based on valid configurations of the F D. The orchestration O may be reconfigured to
orches-trations O1, O2, .., ON for all valid configurations
C1, C2, .., CN of the F D. An orchestration only
invokes the set of atomic services present in a valid configuration of the F D. In our paper, O is an Orc orchestration. See Section 2.2 for brief de-scription of Orc.
(d) Strategy is the strategy used to generate configu-rations. In this paper, we consider two strategies to guide generation of valid F D configurations:
i. Random Generation : We randomly select configurations conforming to F D by solving the Alloy model representing only the F D. ii. Pairwise Generation : We generate a set of
configurations that satisfy all pairwise inter-actions between features in F D. These con-figurations also satisfy the constraints in the F D.
2. Configuration Generation: We generate the con-figurations using the technique described in [18] and briefly outlined in Section 2.4. The process involves transformation of the F D to a constraint satisfaction
problem in Alloy. A chosen Strategy to generate con-figurations is also transformed in conjunction with the Alloy model. Solving the Alloy model gives valid con-figurations. Let the set of output configurations be
C1, C2, ...CN for a chosen strategy Strategy.
3. Empirical Analysis of QoS: The output
configura-tions from the previous step C1, C2..., CN reconfigures
O to orchestrations O1, O2, ..ON by selecting only the
atomic services that are present in each of the config-urations. We compute QoS for each of the orchestra-tions invoking all atomic services in the configuration using the semantics described in Section 2.5. We use the experiments to address the questions motivated in Section 1.
4.
CASE STUDIES
We consider two case studies for our experiments as de-scribed in Sections 4.1 and 4.2.
4.1
Car Crash Crisis Management System
The need for crisis management systems has grown sig-nificantly over time [12]. Crisis management involves iden-tifying, assessing, and handling the crisis situation. A crisis management system facilitates this process by orchestrat-ing the communication between all (distributed) parties in-volved in handling the crisis. The car crash crisis
manage-ment system (C3MS ) [12] includes all the functionalities of a
general crisis management systems, and some additional fea-tures specific to car crashes such as facilitating the rescuing of victims at the crisis scene and the use of tow trucks to re-move damaged vehicles. As described in [12], the main goals of this system include: a) Facilitating the rescue mission car-ried out by the police / firemen and providing them with de-tailed information on the location of the crash. b) Managing the dispatch of ambulances or other alternate emergency ve-hicles to transport victims from the crisis scene to hospitals. c) Coordinating the first-aid missions by providing relevant medical history of identified victims by querying data bases of local hospitals. d) Ushering the medical treatment pro-cess of victims by providing important information about the crash to the concerned workers. e) Managing the use of tow trucks to remove obstacles and damaged vehicles from the crisis scene.
In Figure 1, we present the Car Crash Crisis Management
System (C3MS ) FD [12]. The C3MS FD contains several
features that are associated with software assets represented by atomic services. For example, the Paramedic feature is represented by the Paramedic service. Some sets of features like Police and PoliceMan are subsumed by a single service Police. Constraints such as optional, requires and mutual exclusion (XOR) are also incorporated. For example, the GPS and GSM features are mutually exclusive while the Doctor feature requires the PublicHospital feature.
A host of services may be used to represent the C3MS .
The corresponding services referring to the features are shown in Fig. 2. Services are invoked either sequentially or in parallel (with synchronization merge) as shown in the work-flow. It is assumed that the services perform the functions as generally specified by the nomenclature. For example, the CommunicationManager service manages the communica-tion between parties while the Ambulance service regulates ambulances to the car crash sites. Their construction may be modified according to specifications to perform/subsume other associated tasks.
4.2
eHealth Management System
The need for efficient hospital management stems has been discussed in [20]. A hospital administration system is de-vised to remove some of the inefficiency plaguing current
Crisis Management System Communication Crisis Type GSM GPS Legend Mandatory Optional XOR Feature Service Asset InternalResource FirstAidMaterial HumanResource Coordinator Observer Worker Paramedic Witness HumanVictims Small Area Sudden Crisis Major Accident Car Crash External Service Used External Company Governmental Services Medical Services Garage Tow Truck Private Ambulance Company Public Hospital
Hospital Worker Doctor Ambulance
Police
PoliceMan Fire department
Fire IT-Option Database System Authentication System Surveillance System Mission Remove Obstacle Rescue Observe Transport Investigation
Nurse the wounded
Sort the wounded
CrisisType
Area
Police Fire
Figure 1: C3MS Feature Diagram.
Figure 2: Composite Service Orchestration of the
C3MS .
protocols such as cumbersome admission time, duplicate data entry, redundant lab tests, ineffective treatment coordi-nation, and billing processes. Drawing inspiration from [20] composite health care applications are required to connect various parties and locations. The information flows seam-lessly across organizational and system boundaries emitting from the use of such a centralized orchestration. This en-hanced visibility gives everyone involved a unified view of relevant information and gives process owners the ability to improve existing methods and procedures. The eHealth
sys-tem can be viewed as an extension of the C3MS medical
services to transport injured victims for speedy treatment of injuries. Examples of the utility of healthcare applica-tions include: a) Healthcare providers can access the medi-cal information of a prospective patient and use ambulance services to transfer the client to relevant healthcare facil-ities. b) Physicians can review a patient’s medical history even though this data resides in several systems managed by diverse providers. c) Insurance claims and financial options can be updated and handled in a speedy way. d) Doctors
can use a composite application to determine the appro-priate medication for a patient, order the drug, check the status of pharmacy approval, and monitor how the drug is dispensed. e) Special needs of the patient such as catering specific food items and lab tests can be coordinated in an effective way.
Fig. 3, presents the eHealth management system FD.
Sim-ilar to the C3MS FD, it contains several features that are
associated with software assets represented by atomic ser-vices. Constraints such as optional, requires and mutual exclusion (XOR) are also incorporated. Two versions of the
similar service Ambulancef and Ambulances are in mutual
exclusion. These atomic features or services can be set to varying QoS values resulting in interesting combinations of services. Health Emergency System Transport HospitalAdmit Ambulance Ambulance Legend Mandatory Optional XOR Feature Service Asset Ambulance Documents HealthRecords InsuranceCompany Discharge Billing Treatment HealthRecords HealthRecords InsuranceCompany InsuranceCompany AdmitRoom SpecialRoom Ward SpecialRoom SpecialRoom Ward Ward Pharmacy Doctor Testing Catering Pharmacy Pharmacy Doctor Doctor Testing Testing Catering Catering f s s f s f s f f s f s f s f s f s
Figure 3: eHealth Feature Diagram.
The services used for the orchestration of the eHealth sys-tem are shown as follows. The operations are generic with services such as HealthRecords and InsuranceRecords used to request relevant medical history and insurance status of the patient, respectively.
The Orc pseudo code for the eHealth system is presented with the distinguishing feature being the choice of services that can be used to perform similar goals. For instance,
ei-ther one of the mutually exclusive (MUX ) services Testingf()
or Testings() services can be used to request for lab tests.
However, the QoS associated with each of these services is different resulting in varying overall composite service QoS.
--eHealth
Orchestration--def HealthEmergencySystem() = Transport() >> HospitalAdmit() >> Billing() >> Discharge()
def Transport() = a >> Ambulance(a)
def HospitalAdmit() = Documents() >(hf,in)> (HealthRecords(hf), InsuranceRecords(in)) >> AdmitRoom() >> Treatment() def AdmitRoom() = (sr,w) >> (SpecialRoom(sr),Ward(w)) def Treatment() = (d,t,c,p) >> ((Doctor(d),Testing(t),
Catering(c),Pharmacy(p))
def Ambulance(a) = let(Ambulance_f() | Ambulance_s()) def HealthRecords(hf) = let(HealthRecords_f() |
HealthRecords_s())
def InsuranceCompany(in) = let(InsuranceCompany_f() | InsuranceCompany_s())
def SpecialRoom(sr) = let(SpecialRoom_f() | SpecialRoom_s()) def Ward(w) = let(Ward_f() | Ward_s())
def Doctor(d) = let(Doctor_f() | Doctor_s()) def Testing(t) = let(Testing_f() | Testing_s()) def Catering(c)} = let(Catering_f() | Catering_s()) def Pharmacy(p)} = let(Pharmacy_f() | Pharmacy_s())
5.
EXPERIMENTS
Based on the methodology in Section 3 we perform exper-iments involving pairwise generation of configurations fol-lowed by simulations to obtain probabilistic QoS of dynamic composite services. We consider both case studies for these experiments.
5.1
Evaluating QoS of the Car Crash Crisis
Management System
Configuration Generation: We first use the approach presented in [18] to generate a minimal set (given the re-source constraints) of configurations that satisfy all valid
pairwise interactions in the C3MS case study. The input
settings to the configuration generator are (a) Maximum scope for Alloy solver (b) Maximum time to solve (c) Divide-and-compose strategy for scalable generation. The maxi-mum scope is set to 8 and maximaxi-mum time to 2000 milli-seconds with use of incremental growth strategy. Through
this technique, 185 configurations for the C3MS case study
were generated. The 185 configurations satisfy all valid
pair-wise interactions between services in the C3MS FD that
originally specify 225
configurations. All invalid pairs that do not conform to the FD are rejected by the approach. For instance, the not including the Mission feature in a config-uration is invalid as it is a mandatory feature.
Computing Response Time: Second, we compute re-sponse times for these 185 configurations. We assign each atomic service in the dynamic composite service a t-distribution to model response time. The random settings for the atomic service t-distributions were degrees of freedom ν from 3 to 8 and non-centrality parameter δ from 5 to 15 seconds, respec-tively. We choose these values to provide diversity in atomic response times. For a chosen atomic service (in the current configuration), the individual timeout value was set to 95 percentile of the response time distribution. This largely ensures that the composite service obtains the result of the atomic service and not a timeout. For each of the 185 config-uration, we obtain 10, 000 Monte-Carlo samples of response times from all atomic services in a configuration. We com-pute the composite service response time from these atomic service response times. We collect the response times for the composite service for each configuration to create a t-distribution for the composite service. We set the global timeout of the composite service to a sufficiently high value (300 seconds) to allow capture of outliers in the distribution. As seen in Fig. 4, the pairwise generated configurations cover a range of response time distributions. The distribu-tions were sorted in increasing order of response time and are shown. The slowest and the fastest composite services are marked. Their median values are shown to be 113 and 201 seconds, respectively. This demonstrates the use of a few configurations to test significant changes of about 88 seconds response time in a composite service. These results support the claims C1 and C2 in Section 1, that pertain to the effectiveness of pairwise sampling to generate a wide range of orchestrations and output QoS values.
Computing other QoS metrics: We compute additional QoS metrics such as availability of a service, the cost en-tailed in calling atomic services and output data quality for the 185 configurations. We compute QoS for a com-posite service based on rules given in Table 2 for different Orc combinators in an orchestration. For example, when we set atomic service availability to 0.99 (representing service availability in 99% of invocations) the composite availability of each configuration is shown in Fig. 5. The output data quality ξ is related to the cost χ by the constant κ given by ξ = χ/κ (assuming linear increase in data quality with each atomic service invocation). The output data quality ξ is can also be derived exponentially from the cost χ by
0 20 40 60 80 100 120 140 160 180 0 50 100 150 200 250 300 350 400 0 200 400 600 800 1000 1200
Response Time (seconds) Configurations
Number of Hits
Figure 4: Response time distributions of the 185
pairwise configurations for C3MS .
ξ = eχ/κ. For example, setting the χ = 5 units for each
in-voked atomic service, the cost of each configuration is shown in Fig. 5. Furthermore, setting κ = 20, the linear and expo-nential output data quality of the configurations may also be derived. These variations in data-quality, response time and cost help analyze trade-offs between QoS parameters. These variations in QoS parameters substantiate the claim C5 about pairwise testing in Section 1 referring to its use in generating families of composite services.
0 20 40 60 80 100 120 140 160 180 0.7 0.8 0.9 Configurations Availability 0 20 40 60 80 100 120 140 160 180 40 50 60 70 80 Configurations Cost 0 20 40 60 80 100 120 140 160 180 2 2.5 3 3.5 4 Configurations
Linear Data Quality
0 20 40 60 80 100 120 140 160 180 0 20 40 60 Configurations
Exponential Data Quality
Figure 5: Availability, Data Quality and Cost of the
pairwise configurations of C3MS .
5.2
Evaluating QoS of the eHealth System
Configuration Generation: For the eHealth system, we generate 188 configurations that satisfy all valid pairwise
interactions from a total set of 212
configurations. The initial settings for configuration generation were exactly the same
as in the C3
M S case study.
Computing Response Time: For each of the 188 con-figurations, we model atomic service QoS as t-distributions. The parameters of these distribution are chosen in random in certain bounds to ensure diversity. The parameter degrees of freedom ν was from 3 to 8 and non-centrality parameter δ from 5 to 15 seconds, respectively. For the faster services
(marked with the subscriptf), the δ parameter was set
be-tween 3 to 5 seconds, representing a faster response to a service call.
We obtain 10, 000 Monte-Carlo samples of response times for each of the atomic services and compute the composite service response time distribution. As seen in Fig. 6, the pairwise generated configurations cover a wide range of re-sponse time distributions. The distributions are sorted in in-creasing order of response time. The slowest and the fastest composite services are marked with median values. In the case of eHealth, the 30 seconds range in response time values is due to the added diversity of choice in choosing a fast or slow atomic service.
0 20 40 60 80 100 120 140 160 180 0 50 100 150 200 250 300 350 400 0 200 400 600 800 1000 1200
Response Time (seconds) Configurations
Number of Hits
Figure 6: Response time distributions of the 188 pairwise configurations for eHealth.
Computing other QoS metrics: We use the rules for combinators described in Table 2 to compute QoS of com-posite service orchestrations. Setting atomic service avail-ability to 0.99 the composite availavail-ability each configuration is shown in Fig. 7. We observe that the cost of the com-posite service varies with the choice of fast or slow services.
A faster service (with subscript f) is set double the cost of
its slower (with subscript s) counterpart. This changes the
range of cost and data quality available for different config-urations as seen in Fig. 7.
0 20 40 60 80 100 120 140 160 180 0.82 0.84 0.86 0.88 Configurations Availablity 0 20 40 60 80 100 120 140 160 180 30 35 40 45 50 Configurations Cost 0 20 40 60 80 100 120 140 160 180 1.5 2 2.5 Configurations
Linear Data Quality
0 20 40 60 80 100 120 140 160 180 4 6 8 10 12 14 Configurations
Exponential Data Quality
Figure 7: Availability, Data Quality and Cost of the pairwise configurations of eHealth.
5.3
Comparison with Random Sampling
It has been shown in [5] that pairwise interaction testing of such configurations is advantageous over random testing since its systematic and provides a better coverage. With
random runs, it is impossible to determine if all the atomic services have been invoked at least once. The configurations leading to extreme test case values need not be necessar-ily generated during random runs and there may be many redundant configurations invoked repeatedly. Setting SLAs based on random runs is both non-robust and can lead to ha-bitual deviance. Generating families of configuration with accurately fixed bounds on QoS is also not possible. For these reasons, pairwise generation has comparative advan-tages over random runs.
Three sets of random configurations were generated as shown in Fig. 8, each with original configuration size 185. In each case, the number of valid configurations was found to be 17, 21 and 24 resulting in a maximum efficient generation percentage of 12.97%. Not only are there deviations in the number of valid configurations for each run (17, 21, 24), but also in the QoS metrics output in each run. SLA deviations are a result of resorting to such insufficient random runs of a composite service, which might generate invalid and redundant scenarios. To test the effectiveness of
combinato-2 4 6 8 10 12 14 16 18 20 22 24 120 140 160 180 200 220 240 Valid Configurations
Response Time (seconds)
25 percentile 50 percentile 75 percentile 90 percentile
Figure 8: Three runs of random generation of
con-figurations for C3MS .
rial testing the 185 pairwise configurations were compared
with random samples for the C3MS . All the mandatory
features were set to be invoked with the constrained and optional features randomized in invocation for the random case. This random sampling was performed by a Markov decision process of traversing features in the FD, which will always lead to generation of valid configurations (based on constraints). The comparison with pairwise is shown in Fig. 9 and it is seen that random generation can cover a large range of QoS values if sufficient number of configurations are generated. To determine that number, however, requires analysis of pairwise interactions. The random configurations are deficient as they cannot guarantee a) invocation of every possible service at least once; b) generating the extreme con-figurations for a particular composite service in every sam-ple. When compared to the pairwise generation scheme that covered all pairs of services, the random generation covered only 8.8% of the service pairs. This shows that the same set of services are redundantly invoked in many configurations during random generation. Thus, for such orchestrations with numerous configurations, using pairwise interactions is a sufficient choice in order to examine the entire sample space. These results support our claim C3 in Section 1, referring to the comparison between pairwise and random sampling.
5.4
Consistency of Pairwise Samples
Given one orchestration, there can be many different sets (or solutions) of configurations that cover pairwise services interactions. Thus, we compute QoS behavior over
differ-0 20 40 60 80 100 120 140 160 180 100 150 200 250 Configurations
Resopnse Time (seconds)
25 percentile pairwise 50 percentile pairwise 75 percentile pairwise 90 percentile pairwise 25 percentile random 50 percentile random 75 percentile random 90 percentile random
Figure 9: Comparison of pairwise and random re-sponse time (arranged in increasing order) of
per-centile values for 185 configurations of C3MS .
ent samples of configurations. This aims at evaluating the stability of pairwise testing as a sampling technique to es-timate the global QoS for a dynamic composite service. A collection of 10 samples that satisfy the pairwise interaction testing were generated for the eHealth case. The percentile statistics of the configurations in each sample was collected through 10,000 Monte-Carlo runs and is shown in Fig. 10. The lowest and highest percentile values of the configura-tions in each sample were collected. The mean inter-sample difference for the random case is 12.94 seconds compared to 6.44 seconds for the pairwise case. Further, these were com-pared with 10 samples of randomly generated configurations (with 300 configurations in each sample) in Fig. 10. Again, all the mandatory features were set to be invoked with the constrained and optional features randomized in invocation for the random configurations. The number of valid config-urations for each sample ranged between 3.5% to 9% of the 300 configurations. Comparing the two cases, the stability of the pairwise generation is demonstrated through its con-sistently low standard deviation values in Table 3 when com-pared to random samples. Once again, the lowest and the highest percentile values of all the configurations in a partic-ular sample are compared. These results support claim C4 in Section 1, referring to the stability of pairwise sampling.
1 2 3 4 5 6 7 8 9 10 80 90 100 110 120 130 140 150 160 170 180 190 Samples Time (seconds)
Pairwise 25 percentile minima Pairwise 25 percentile maxima Pairwise 50 percentile minima Pairwise 50 percentile maxima Pairwise 75 percentile minima Pairwise 75 percentile maxima Pairwise 90 percentile minima Pairwise 90 percentile maxima Random 25 percentile minima Random 25 percentile maxima Random 50 percentile minima Random 50 percentile maxima Random 75 percentile minima Random 75 percentile maxima Random 90 percentile minima Random 90 percentile maxima
Figure 10: Comparing stability of pairwise and ran-dom samples for eHealth.
Percentile 25(min.) 25(max.) 50(min.) 50(max.) 75(min.) 75(max.) 90(min.) 90(max.) Pairwise Std. Deviation(secs.) 2.18 1.52 2.59 1.73 2.90 1.82 3.19 1.83 Random Std. Deviation(secs.) 4.14 4.17 4.21 4.51 4.43 4.76 4.63 5.07
Table 3: Standard Deviation values for pairwise and random samples.
5.5
Perspectives due to Analysis
The methodology evaluated for the C3MS and the eHealth
orchestrations can lead to many possibilities for improving QoS metrics for composite services. This includes setting the SLA keeping into account the worst performing config-uration. This will prevent contract deviation during actual deployment of the service.
A family of SLAs for a set of configurations taking into ac-count trade-offs between QoS metrics and the output quality of configurations may be proposed. This leads to families of composite services with extensively analyzed SLAs. Config-urations may be grouped along with their QoS behavior to develop an extended product line of composite services. For example, categories of services may be constructed for the
C3MS orchestration (based on Figs. 4 and 5) as shown in
Table 4. Similarly, the two categories of service families for the eHealth case (Figs. 6 and 7) is shown in Table 5. In both cases, the family of services with higher data quality is traded-off by a slightly higher response time.
While the diversity in QoS families for the C3MS is due
to optional services that may / may not be included, the variability in the eHealth case is mainly due to other fac-tors. An inherent choice in replacing a slow atomic service with a fast counterpart can lead to a range of QoS values. Generated configuration families can use of combination of these options of optimally compose atomic services to spe-cific QoS bounds. These service families can have associated contracts (albeit in the soft-sense as in [19]) to monitor de-viations from specifications. These instances support our claim C5 in Section 1, that pertains to developing families of composite service orchestration with significantly
differ-ent QoS behavior. With numerous possible combinations
Configuration Families Bronze Silver Gold 90 percentile Response Time (T ) <183 s <216 s ≥216 s Median Response Time (T ) <150 s <179 s ≥179 s Availability (α) >0.75 >0.71 ≥0.71 Cost (χ) <60 <70 ≥70 Linear Data Quality (ξ) <3 <3.5 ≥3.5 Exponential Data Quality (ξ) <20 <30 ≥30
Table 4: Configuration families for C3MS .
Configuration Families Standard Premium 90 percentile Response Time (T ) <171 s ≥171 s Median Response Time (T ) <139 s ≥139 s Availability (α) >0.85 ≤0.85
Cost (χ) ≤40 >40
Linear Data Quality (ξ) ≤2 >2 Exponential Data Quality (ξ) ≤8 >8
Table 5: Configuration families for eHealth. of atomic services, such a dedicated families of services with significantly different QoS outputs enable accurate monitor-ing of services provided. The pairwise scheme is both a robust and compact representation of the behavior space of the set of orchestrations. This provides an effective pre-SLA technique to enunciate the QoS metrics and threshold levels.
5.6
Threats to Validity
This section considers the threats to the validity of the experimental results. These may be internal (whether there is a bias/error in the experimental design which could affect
the causal relationship) or external (ability to generalize the results of the experiment to industrial practice).
The hypothesis studied in this paper concerns the use of pairwise sampling to evaluate QoS of large orchestrations. Sources of internal error can be a result of the MiniSAT solver used to generate the pairwise configurations or the MATLAB statistical tools used for QoS evaluation. These tools have not been compared with available alternatives for consistency of results. Furthermore, the assumption is that for each sample of configurations, the pairwise analysis scheme can provide consistently large range of QoS values. Systematic bias in QoS may be introduced in samples when extreme cases are not generated.
To ensure scalability to large industry level FDs, the pair-wise generation in [18] makes use of incremental growth / binary splitting schemes. Redundancies in the number of configurations can be seen due to these schemes. For gen-erating more than one sample of solutions, the symmetry breaking scheme in Alloy was used. This introduces more constraints with each proceeding sample, which increases the time required to generate such samples.
6.
RELATED WORK
The combinatorial testing framework described by Cohen et al. [5] has been applied extensively to efficient testing for fault detection. In the work of Cohen et al. [6], this technique is extended to software product lines with highly configurable systems. Modeling variability in SPLs using feature models is the work of Jaring and Boschet [9] where they show that the robustness of a SPL architecture is re-lated to the type of variability. To ensure that constraints in the FD are incorporated in the efficient sampling of t-wise tests, the scalable solver proposed by Perrouin et al. [18] is used. In [14], variability in software as a service applications are modeled using the orthogonal variability model to study the customization choices in such workflows.
Pre-deployment testing of SLAs has been studied by Di Penta et al. [17], where they make use of genetic algorithms to generate test data causing SLA violations. Analysis of white and black box approaches are provided in the paper. In [2], Bruno et al. make use of regression testing to en-sure that an evolving service maintains the functional and QoS assumptions. The service consistency verification due to evolution is done by executing test suites contained in a XML encoded facet attached to the service.
The use of probabilistic QoS and soft contracts was intro-duced by Rosario et. al [19] and Bistarelli et al. [1]. Instead of using fixed hard bound values for parameters such as re-sponse time, the authors proposed a soft contract monitoring approach to model the QoS measurement. The composite service QoS was modeled using probabilistic processes by Hwang et al. [7] where the authors combine orchestration constructs to derive global probability distributions.
In our paper, we extend these two notions to analyze the QoS of a composite orchestration under various configura-tions. Effective sampling of orchestrations is necessary spe-cially in conjunction with exceedingly flexible and large con-figuration spaces. When combined with the probabilistic behavior QoS behavior of services, this provides an accu-rate portrayal of the composite service’s end-to-end QoS. In a recent submission [11], similar methodology is used to compare pairwise and exhaustive analysis of configuration spaces in smaller orchestrations. In this paper, that
no-tion is extended to comparison with random runs of larger configuration spaces (where exhaustive analysis is impossi-ble). This entails a scalable approach for robust pairwise interaction generation that is not required for the smaller examples. The case studies and corresponding experiments are much larger in this paper and study the effect of not only orchestration variability, but also choice in compatible atomic service counterparts. Correspondingly, this requires further experiments on the sampling robustness and com-parison with random generation, which is not included in [11].
Though formal analysis of end-to-end QoS has been stud-ied in Cardoso et al. [4], there are no practical testing tools available for the composite service provider. The pairwise testing procedure has been shown to outperform other test-ing techniques in [5]. We extend this testtest-ing tool to develop a generic testing methodology to query end-to-end QoS of a web service. Related empirical studies of optimal QoS com-positions make use of genetic programming in Canfora et al. [3] and linear programming in Zeng et al. [23]. These are dynamic techniques to choose the best possible atomic services and configurations for SLAs. The goal in our pa-per is to analyze the dynamic configurations that may result due to invocation/non-invocation of particular web services when atomic SLAs have already been established.
7.
CONCLUSION
We demonstrate that combinatorial interaction testing and in particular pairwise testing effectively portrays the overall behavior of a dynamic composite service. Pairwise testing drastically reduces the number of composite service config-urations while successfully analyzing a wide range of QoS values. It provides good coverage for two large case studies
(C3MS and eHealth). We also observe that the analysis
re-mains stable over multiple solutions for the same case study. Pairwise testing is superior to random generation of configu-rations in terms of coverage and stability of results. Pairwise testing helps specify SLAs based on a deterministic and sys-tematic sampling scheme rather than random sampling. We use our approach to create many families of composite ser-vices which can be seen as products with varying costs and SLAs. We largely augment the predictability of a dynamic composite service by performing offline pairwise testing in advance.
8.
REFERENCES
[1] S. Bistarelli and F. S. Santini. Soft constraints for quality aspects in service oriented architectures. In Fourth European Young Researchers Workshop on Service Oriented Computing, Italy, 2009.
[2] M. Bruno, G. Canfora, M. D. Penta, G. Esposito, and V. Mazza. Using test cases as contract to ensure service compliance across releases. In Proc. of the 3rd Intl. Conf. in Service-Oriented Computing,
Amsterdam, The Netherlands, 2005.
[3] G. Canfora, M. D. Penta, R. Esposito, and M. L. Villani. An approach for qos-aware service
composition based on genetic algorithms. In Conf. on Genetic and evolutionary computation, USA, 2005. [4] J. Cardoso, J. Miller, A. Sheth, and J. Arnold.
Modeling quality of service for workflows and web service processes. Technical report, LSDIS Lab Technical Report, University of Georgia, 2002. [5] D. M. Cohen, S. R. Dalal, M. L. Fredman, and G. C.
Patton. The aetg system: An approach to testing based on combinatorial design. IEEE Trans. on Software Engineering, 23:437–444, 1997.
[6] M. B. Cohen, M. B. Dwyer, and J. Shi. Constructing interaction test suites for highly-configurable systems
in the presence of constraints: A greedy approach. IEEE Trans. on Software Engineering, 34, 5:633–650, 2008.
[7] S. Y. Hwang, H. Wang, J. Tang, and J. Srivastava. A probabilistic approach to modeling and estimating the qos of web-services-based workflows. Elsevier
Information Sciences, 177:5484–5503, 2007.
[8] D. Jackson. Software Abstractions: Logic, Language, and Analysis. The MIT Press, April 2006.
[9] M. Jaring and J. Bosch. Representing variability in software product lines: A case study. Proc. of the Second Intl. Conf. on Software Product Lines, London, UK, pages 15–36, 2002.
[10] K. Kang, S. Cohen, J. Hess, W. Novak, and
S. Peterson. Feature-oriented domain analysis (foda) feasibility study. Software Engineering Institute, 1990. [11] A. Kattepur, S. Sen, B. Baudry, A. Benveniste, and
C. Jard. Variability modeling and qos analysis of web services orchestrations. IEEE International Conference on Web Services (ICWS), Miami, July 5-10, 2010. [12] J. Kienzle, N. Guelfi, and S. Mustafiz. Crisis
management systems: A case study for aspect-oriented modeling. Technical report, McGill Univ., 2009. [13] D. R. Kuhn and D. D. Wallace. Software fault
interactions and implications for software testing. IEEE Trans. on Software Engineering, 30:418–421, 2004.
[14] R. Mietzner, A. Metzger, F. Leymann, and K. Pohl. Variability modeling to support customization and deployment of multi-tenant-aware software as a service applications. In Proceedings of the 2009 ICSE
Workshop on Principles of Engineering Service Oriented Systems, pp. 18-25, 2009.
[15] J. Misra and W. R. Cook. Computation orchestration: A basis for wide-area computing. Software and Systems Modeling, Springer, 6(1):83–110, 2007. [16] A. Paschke and M. Bichler. Knowledge representation
concepts for automated sla management. Journal of Decision Support Systems, 46:187–205, 2008. [17] M. D. Penta, G. Canfora, and G. Esposito.
Search-based testing of service level agreements. In Proc. of the 9th Conf. on Genetic and evolutionary computation, London, England, 2007.
[18] G. Perrouin, S. Sen, J. Klein, B. Baudry, and Y. le Traon. Automatic and scalable t-wise test case generation strategies for software product lines. In Proc. of Intl. Conf. on Software Testing, 2010. [19] S. Rosario, A. Benveniste, S. Haar, and C. Jard.
Probabilistic qos and soft contracts for
transaction-based web services orchestrations. IEEE Trans. on Services Computing, 1(4):187–200, 2008. [20] SAP. Enterprise services architecture for healthcare - a
prescription for innovation. Solution Brief, Germany, 2006.
[21] P. Schobbens, P. Heymans, J. Trigaux, and
Y. Bontemps. Generic semantics of feature diagrams. Computer Networks, Elsevier, 51:456–479, 2007. [22] V. Tosic and B. Pagurek. On comprehensive
contractual descriptions of web services. In IEEE Intl. Conf. on e-Technology, e-Commerce and e-Service, pages 444–449, 2005.
[23] L. Zeng, B. Benatallah, A. H. Ngu, M. Dumas, J. Kalagnanam, and H. Chang. Qos-aware middleware for web services composition. IEEE Trans. on