HAL Id: inserm-00725366
https://www.hal.inserm.fr/inserm-00725366
Submitted on 11 Oct 2012
HAL is a multi-disciplinary open access
archive for the deposit and dissemination of
sci-entific research documents, whether they are
pub-lished or not. The documents may come from
teaching and research institutions in France or
abroad, or from public or private research centers.
L’archive ouverte pluridisciplinaire HAL, est
destinée au dépôt et à la diffusion de documents
scientifiques de niveau recherche, publiés ou non,
émanant des établissements d’enseignement et de
recherche français ou étrangers, des laboratoires
publics ou privés.
Multifiber Deterministic Streamline Tractography of the
Corticospinal Tract Based on a New Diffusion Model:
Part II
Aymeric Stamm, Olivier Commowick, Patrick Pérez, Christian Barillot
To cite this version:
Aymeric Stamm, Olivier Commowick, Patrick Pérez, Christian Barillot. Multifiber Deterministic
Streamline Tractography of the Corticospinal Tract Based on a New Diffusion Model: Part II. MICCAI
2012 DTI Tractography Challenge, Oct 2012, Nice, France. pp.12-20. �inserm-00725366�
Tractography of the Corticospinal Tract Based
on a New Diffusion Model: Part II
Aymeric Stamm1, Olivier Commowick1, Patrick P´erez2, and Christian Barillot1
1
VISAGES: INSERM U746 - CNRS UMR6074 - INRIA - Univ. of Rennes I, France 2 Technicolor, Rennes, France
Contact: Aymeric.Stamm@irisa.fr
Abstract. We report new results for the second edition of the MIC-CAI DTI tractography challenge. We build upon a new model, termed Diffusion Directions Imaging, that describes the random motion of wa-ter molecules in fibrous tissues and we utilize it as an input to a mul-tifiber deterministic tractography algorithm. We apply the method to track the corticospinal tract in two patients suffering from tumors at different stages, with and without tumor infiltration respectively.
1
Introduction
Tractography of the corticospinal tract (CST) using diffusion-weighted MRI (DW-MRI) is especially challenging, mostly due to the numerous fiber crossings in the corona radiata. When classical diffusion models (e.g. single or multiple ten-sors) coupled with simple tractography algorithms (e.g. deterministic streamline) are used, these crossings often make it impossible to track the most lateral fibers of the CST [1]. These include especially important motor areas such as the hand and the whole face, as shown by the homunculus of Penfield & Rasmussen. The fact that HARDI sequences are prohibitively time-consuming for patients with tumors raises the demand for new diffusion models and/or tractography algo-rithms able to track these lateral fibers from clinical (fast) diffusion sequences, having a small number of encoding gradients. We recently proposed a diffusion model that meets these requirements even when using a simple deterministic streamline algorithm [2].
Following the first edition of the DTI tractography challenge, we propose in this paper a follow-up study of our proposed model and tractography algo-rithm, based on the new data provided for the second tractography challenge. We therefore briefly outline our model in Section 2.1, the tractography algorithm in Section 2.2, and the pipeline we used to extract the CST in Section 2.3. Finally, we provide tractography results of the left and right CST for the two patients of the challenge dataset in Section 3.
2 Stamm et al.
2
Methods
2.1 Diffusion Modeling
In each voxel, water molecules are assumed to be distributed in several compart-ments. We first describe how we model the diffusion within a single compartment. Then, we introduce our multi-compartment model, coined Diffusion Directions Imaging (DDI) [2, 3], and finally we outline how we estimate its parameters.
Single-compartment Model The diffusion process induces, after a diffusion time τ , a random displacement of water molecules from their initial position x0
to a random position x = x0+
√ 2τ w.
Assuming a unique orientation of diffusion ±µ, we further split water molecules in equal proportions according to whether they diffuse along the direction +µ or the direction −µ. Mathematically, it reads: w = ξw++ (1 − ξ)w−, where
ξ ∼ Be(1/2), w+ and w− are two random variables that model the molecular
displacements along directions +µ and −µ, respectively, and ξ is an independent Bernoulli random variable.
We then propose to model the random variable w+ (the modeling of the
random variable w− is identical with −µ instead of µ) as w+= u + v, where:
– u follows a von Mises & Fisher distribution parametrized by (i) the radius R > 0 of the sphere on which it is defined, (ii) the spherical coordinates (θ, φ) of its mean direction µ and (iii) its concentration parameter κ ≥ 0;
– v follows a centered Gaussian distribution parametrized by a cylindri-cally constrained [4] covariance matrix D = κ+1R2 (I + κµµ0), where I is the identity matrix and {µ, κ, R} are the same parameters that characterize u; – u and v are statistically independent.
In essence, (i) ±µ can be interpreted as the local orientation of the fibers which constrain the diffusion, (ii) R can be interpreted as the mean radial dis-placement along this orientation and (iii) κ can be interpreted as a measure of anisotropy of the diffusion in the compartment.
The probability density function (pdf) of the molecular displacement x−x0is
then obtained by a mixture of two equally weighted pdfs, each one of them being the convolution of the von Mises & Fisher pdf and the Gaussian pdf previously described. This pdf is parametrized by four parameters, namely (i) the polar angle in [0, π/2] and (ii) the azimuthal angle in [0, 2π] that define ±µ, (iii) κ ≥ 0 and (iv) R > 0.
Multi-compartment Model Due to its low number of parameters, the single-compartment model is particularly suited to be encompassed within a multi-compartment model, which can account for more than one fiber orientation within each voxel. We thereby model the pdf of molecular displacements as a mixture of pdfs having the common parametric form proposed above.
We assume m compartments associated with m different fiber orientations ±µi (i = 1, . . . , m). In each compartment, the diffusion is modeled according
to the pdf described in Section Single-compartment Model, with parameters {±µi, κi, Ri} and mixture weight ai∈ [0, 1]. We also include an additional pdf in
the mixture, with κ0= 0 and weight a0∈ [0, 1], to account for isotropic diffusion
which is thus only parametrized by R0> 0.
In order to ensure that the mixture is still a pdf, we constrainPm
i=0ai= 1.
Considering m putative fiber orientations with this parametrization yields an m-compartment DDI model with 5m + 1 parameters.
The mixture weight a0can be interpreted as the proportion of water molecules
that diffuse isotropically while a mixture weight ai, i ≥ 1 can be interpreted as
the proportion of water molecules that diffuse anisotropically in the orientation given by ±µi.
Estimation of the DDI Parameters The theoretical diffusion weighted inten-sities are the modulus of the Fourier transform of the pdf of molecular displace-ments which can be analytically derived under the assumption of the DDI model [2]. The 5m + 1 unknown parameters of the m-compartment DDI model are then estimated using a least squares fitting on the raw diffusion weighted intensi-ties, and this optimization is performed using the derivative-free BOBYQA optimization algorithm, adapted for bounded constraints [5].
The model selection is performed using an index derived from the diffusion tensor. Let λ1≥ λ2 ≥ λ3 > 0 be the three eigenvalues of the tensor, we define
κDTI:= 2λ1
λ2+λ3− 1. This index allows one to classify voxels whether they contain
no fiber (κDTI= 0), one fiber (κDTI >> 1) or more than one fiber (κDTI= 1).
The estimation of the DDI model is performed in two main steps:
1. The mean radial displacement R0 under isotropic diffusion is first estimated
using the 0-compartment DDI model.
2. With R0 fixed to the value determined at step 1, the other parameters of
the DDI model are estimated using:
– the 1-compartment DDI model if κDTI< 0.3 or κDTI> 1.2;
– the 2-compartment DDI model if 0.3 ≤ κDTI≤ 1.2.
The compartments are lastly sorted in decreasing order according to their κ.
2.2 Tractography Algorithm
Our goal is to track fibers linking multiple regions of interest (ROIs). To this end, we developed a deterministic streamline algorithm, which can be viewed as an extension of the original FACT method [6], adapted to the DDI model, using a breadth-first-type search.
Starting from one of the ROIs, we define N starting points at each voxel of the ROI. Given one point along its path, we build the main fiber iteratively as follows:
4 Stamm et al.
1. If the number of putative fiber directions m = 0, we stop the tracking. 2. If m = 1, we compute FA1 and the angle α1 between the input direction
and µ1. If α1< αt and FA1> FAt, then we follow the single putative fiber
direction µ1 with a step size of l millimeters. Else, we stop the tracking.
3. If m = 2, we compute FA1, FA2, the angle α1 (resp. α2) between the input
direction and µ1 (resp. µ2). If:
– αt< α1, α2: we stop the tracking.
– α1< αt< α2: cf. the case m = 1.
– α2< αt< α1: if FA2> FAt, then we follow the direction µ2with a step
size of l millimeters, else we stop the tracking.
– α1, α2 < αt: if FA2< FAt, then cf. the case m = 1; else if κ2 > r × κ1
then we sort the two fibers in ascending order according to the angles αi. We follow the new direction µ1 with a step size of l millimeters and
we record the second putative fiber direction µ2(branch) for future use,
as it can be indicative of crossing/kissing/merging/diverging fibers. Once we have tracked this main fiber, we perform the same tracking from all the possible branching points that we have recorded along its path. Importantly, for these trackings, the stepping rule and stopping criteria are identical as those for the main fiber, but we do not record any possible mixed fiber configuration along these secondary paths, for which we only follow the main direction µ1 at
each step. We then lead the same tracking from the other ROIs. We only keep the tracts going through all the seeding ROIs for further analysis. In practice, we choose the parameters N = 1, l = 1, r = 0.8, αt = 60 degrees (maximal
angle between two successive directions along the fiber) and FAt= 0.2 (minimal
FA along the fiber). During the tracking, when a point is not on the grid of the DW-MR images, we compute the DDI model using a trilinear interpolation directly on the model parameters.
2.3 Tractography Pipeline Applied to the Challenge Datasets We utilize the following processing pipeline to extract the CST for the challenge datasets. An expert neuroanatomist delineated two ROIs on each side (left and right) of the color FA images extracted from the diffusion tensor images provided by the challenge organisers. One is located in the posterior limb of the internal capsule and the other in the superior part of the mesencephalon. In addition, since crossing fiber tracts such as the association or commissural fiber tracts may be considered as bifurcations of the CST by the tractography algorithm, the same expert also delineated regions through which the tracts are not allowed.
All datasets were then processed in three steps:
1. Diffusion-weighted MRI denoising: DW-MRI is subject to random noise yielding measured intensities that are different from their theoretical val-ues, and thus biasing the subsequently estimated diffusion models. We fil-tered the diffusion-weighted MR images with the Rician-adapted Non-Local Means filter [7], which has been shown to efficiently denoise such images while preserving fine anatomical structures.
2. DDI model estimation from the denoised diffusion weighted images computed at step 1
3. Extraction of the left and right CST using the delineated ROIs and the DDI volume.
All the software used in this challenge (DDI estimation and tractography) was implemented utilizing ITK and VTK and is fully multi-threaded. This software will be made available as a free package soon.
3
Results
The 2012 MICCAI DTI tractography challenge consists of a set of two patients suffering from tumors at various grades. In addition to DWI, T1 and T2 weighted images were available along with the delineation of the tumors of the two patients so that we could produce combined views to help the surgeon, for example, to plan a tumor removal surgery.
On both patients, the estimation of the DDI volume took about 10 minutes on a 8-core Xeon 3 GHz computer while the tractography of each CST took about 1 to 2 minutes on the same machine. The model estimation step is longer but still reasonably short and can be performed offline in a clinical context.
3.1 Tractography on Patient 1
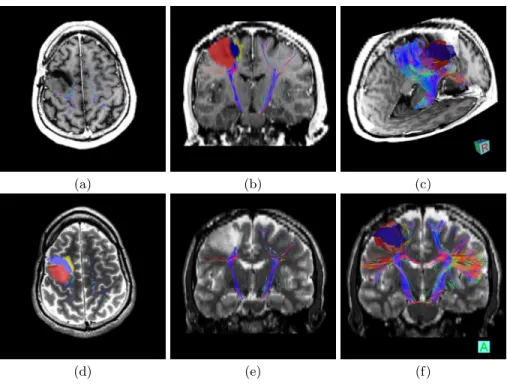
Fig. 1 presents axial and coronal views of the left and right CST extracted on patient 1, superimposed on the T1w image or the T2w image. In addition, we superimposed the manual delineations and provide 3D combined visualizations to evaluate the relative positions of the tumor and motor pathways.
Several things may be noticed for this patient. First, the left CST, which is not affected by the tumor, is able to spread into the different motor cortex regions (see Fig. 1.b,e,f) thanks to our new multi-compartment model. On the contrary, the right CST is not going through the cavity (which was expected), and neither through the tumor. Therefore, the number of fibers found on the right side is lower than on the left side of the brain as shown in Fig. 1.f. Some right CST fibers are also going through the gliosis. Finally, the 3D views clearly highlight a very close proximity between the tumor and the motor pathways, and therefore provide crucial information to the surgeon in case another surgical resection is planned.
3.2 Tractography on Patient 2
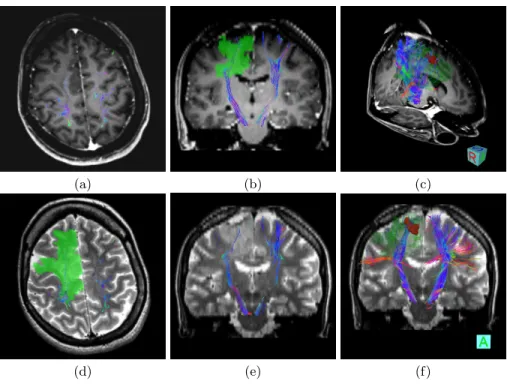
The tumor for the second patient is different as it is an infiltrating tumor. As for patient 1, we present in Fig. 2 axial and coronal views of the left and right CST extracted, superimposed on the T1w image or the T2w image, as well as 3D combined visualizations to evaluate the relative positions of the tumor and motor pathways.
6 Stamm et al.
(a) (b) (c)
(d) (e) (f)
Fig. 1. Illustration of CST on the First Patient. Combined views of the obtained fiber tracts overlayed on T1 (a,b,c) and T2 (d,e,f), illustrating the proximity of the tumor to crucial motor pathways. Regions of interest correspond to the tumor (red), the resection cavity (blue) and gliosis (yellow). (a,d,b,e) are respectively axial and coronal views, while (c,f) are 3D views.
(a) (b) (c)
(d) (e) (f)
Fig. 2. Illustration of CST on the Second Patient. Combined views of the ob-tained fiber tracts overlayed on T1 (a,b,c) and T2 (d,e,f), illustrating the relative positions of the tumor and the motor fiber tracts. Regions of interest correspond to the solid tumor (red) and the infiltrating tumor (green). (a,d,b,e) are respectively axial and coronal views, while (c,f) are 3D views.
8 Stamm et al.
As for patient 1, the left CST is well extracted, showing some bifurcations towards several regions of the motor cortex. The number of fibers in the right CST is lower than in the left CST (see Fig. 2.b,e,f), which is due to the presence of the edema. However, contrary to patient 1, the right CST is not completely blocked by the tumor as it is of different nature. The most central part of the right CST is indeed still visible in our tractography (see axial and coronal views on Fig 2.b,d). However the outer parts (e.g. corresponding to the hand or face areas) are much sparser or even not found by our tractography algorithm. Again, both 3D views provide an important insight on the relative positions of the tumor, the edema and the CST, which can help the neurosurgeon in his decisions.
References
1. Behrens, T.E.J., Berg, H.J., Jbabdi, S., Rushworth, M.F.S., Woolrich, M.W.: Prob-abilistic diffusion tractography with multiple fibre orientations: What can we gain? Neuroimage 34(1) (January 2007) 144–155
2. Stamm, A., P´erez, P., Barillot, C.: Diffusion directions imaging. Research Report RR-7683, INRIA (2011)
3. Stamm, A., P´erez, P., Barillot, C.: A new multi-fiber model for low angular resolu-tion diffusion MRI. In: 9th IEEE Internaresolu-tional Symposium on Biomedical Imaging (ISBI’2012). (2012) 936–939
4. Friman, O., Westin, C.F.: Uncertainty in white matter fiber tractography. In: MICCAI. (2005) 107–14
5. Powell, M.: The BOBYQA algorithm for bound constrained optimization with-out derivatives. Technical report, Centre for Mathematical Sciences, University of Cambridge, UK (August 2009)
6. Mori, S., Crain, B.J., Chacko, V.P., van Zijl, P.C.: Three-dimensional tracking of axonal projections in the brain by magnetic resonance imaging. Ann Neurol 45(2) (February 1999) 265–269
7. Wiest-Daessl´e, N., Prima, S., Coup´e, P., Morrissey, S.P., Barillot, C.: Rician noise removal by non-local means filtering for low signal-to-noise ratio MRI: applications to DT-MRI. In: MICCAI, New York, United States (2008) 171–9
8. Descoteaux, M., Wiest-Daessl´e, N., Prima, S., Barillot, C., Deriche, R.: Impact of Rician Adapted Non-Local Means Filtering on HARDI. In: MICCAI. (2008) 122–30