Hygrothermal properties of unfired earth bricks: effect of barley straw, hemp shiv and corn cob addition
A. Laborel-Prénerona*, C. Magnionta, J-E. Auberta
a LMDC, INSA/UPS Génie Civil, 135 Avenue de Rangueil, 31077 Toulouse cedex 04,
France.
* Corresponding author: aurelie.laborel@gmail.com
Declarations of interest: none
ABSTRACT
Earth is a material presenting good hygric properties, which is an important point as comfort
and indoor air quality have become major issues. Nowadays, the energy efficiency of a
construction is also crucial, but the thermal insulation provided by an earth brick is quite low.
Therefore, some plant aggregates were added to lighten the material, thus decreasing its
thermal conductivity. The hygrothermal properties of seven formulations made of earth with
0, 3 or 6% by weight content of barley straw, hemp shiv or corn cob were assessed. The
properties determined were thermal conductivity, specific heat capacity, water vapour
permeability, and sorption-desorption isotherms measured with the saturated salt solution
and DVS methods. The theoretical MBV was also calculated. The study showed a large
decrease in thermal conductivity when a large volume of plant aggregates was added while
plant aggregates incorporation conversely affected the thermal inertia parameters.
Concerning water vapour permeability, as earth is a very permeable material, the addition of
plant aggregates did not improve this property. The sorption capacity of bio-based earth
materials was slightly increased in comparison with earth alone. Finally, the calculated MBV
showed the excellent buffering capacity of this kind of material, with and without plant
Keywords: earth brick, plant aggregate, thermal conductivity, specific heat capacity,
sorption-desorption isotherm, water vapour permeability, Moisture Buffer Value, hygrothermal
performance
Highlights:
Thermal conductivity decreases with the addition of plant aggregates. Earth material is highly water vapour permeable.
Sorption-desorption isotherms are assessed with DVS and saturated salt solution methods.
MBV of earth-based materials is excellent.
Nomenclature
Latin symbols
A Exposed surface area (m2)
bm Moisture effusivity (kg.m-2.Pa-1.s-1/2)
cp Specific heat capacity (J.kg-1.K-1)
D Diffusivity (m2.s-1) dm Mass variation (g) dt Time variation (min) E Effusivity (J.K-1.m-2.s-1/2)
e Thickness of the specimen (m)
ea Thickness of the air layer between the sample and the salt solution (m)
G Transmission rate of water vapour (kg.s-1)
M Mass proportion (%)
MBVideal Theoretical Moisture Buffer Value (g.m -2
.%RH-1) p Atmospheric pressure (hPa)
p0 Standard atmospheric pressure (hPa)
Q Heat input (W)
R Gas constant for water vapour (N.M.kg-1.K-1) RH1 Relative humidity inside the cup (%)
RH2 Relative humidity outside the cup (%)
S Cross section (m2)
T Temperature (K)
tp Time period (s)
V Volume proportion (%)
u Moisture content (kg.kg-1) wopt Optimum moisture content (%)
x Proportion by mass of the composite components (%) Greek symbols
Δp Vapour pressure difference across the sample (Pa)
ΔT Temperature difference between the plates of the guarded hot plate apparatus (K)
δa Water vapour permeability of the air (kg.m-1.s-1.Pa-1)
θ Temperature (°C)
λ Thermal conductivity (W.m-1.K-1)
μ Water vapour diffusion resistance factor (-) ρd Dry density (kg.m-3)
σc Compressive strength (MPa)
Φ Relative humidity (-) ξ Moisture capacity (kg.kg-1)
1. INTRODUCTION
Research is currently focusing on the reduction of energy consumption and the improvement
of hygrothermal comfort during the construction phase and the service life of buildings. Earth
is a construction material that meets this major challenge. With its numerous assets such as
its availability, recyclability and the low energy required for the transformation process and
transportation, earth is increasingly being studied. One of its main qualities is its ability to regulate indoor moisture and improve the comfort of the building’s users thanks to its
hygroscopic properties [1]–[4]. These properties are also very important for human health.
Poor moisture regulation can engender fungal growth leading to several diseases such as
allergies or rhinitis [5], [6].
Any porous material construction exchanges water vapour with its environment [7]. It has
been shown that earth, specifically, is able to store a considerable amount of moisture
through the phenomena of surface adsorption (monolayer or multilayer) and capillary
condensation [8]. Some authors believe that earth materials can be considered as natural
air-conditioners [9]. The hygric regulation through moisture transport and storage can be
quantified by measuring the water vapour permeability and the sorption-desorption isotherms, for example. These two tests are performed under stationary conditions and are
useful to give data for Heat, Air and Moisture (HAM) models [7], [10]. They also allow a
theoretical Moisture Buffer Value (MBVideal, a dynamic hygric property) to be calculated [4],
[8], [11].
Earth can store heat but is not a good thermal insulator [1]. The addition of plant aggregates
[12]–[16]. Their effect is mainly evaluated by measuring the thermal conductivity. It has been
extensively demonstrated that an increase in plant aggregate content leads to a decrease in
thermal conductivity [12], [14], [15], [17]. For example, the thermal conductivity of an earthen
plaster containing about 16% by weight of barley straw was reduced by about 56% in
comparison with a specimen made only of earth (0.154 and 0.350 W.m-1.K-2 respectively) [18]. It has also been shown that thermal conductivity depends on the moisture content of the material tested [14], [19]–[21] and on its porosity [19], [22]. Concerning thermal inertia, recent
studies pointed out the good performance of earthen materials and the consequent improvement of indoor thermal comfort [23]–[25]. Nevertheless, no reference was found
concerning the effect of plant aggregate content on the thermal inertia parameters of earth
products. Abanto et al. [26] measured specific heat capacity and thermal diffusivity of
different Peruvian adobe but no relation could be established between these properties and
the adobe straw content.
However, hygric properties of earth composite materials including plant aggregates and their
efficiency to regulate the indoor climate remain to be proved and few papers have studied
this aspect.
The sorption-desorption isotherm curves describe the Equilibrium Moisture Content (EMC) of
a material when it is exposed to a given Relative Humidity (RH). Different methods exist to
evaluate the sorption capacity of a material. In the standardized method of Saturated Salt
Solutions (SSS) described in NF EN ISO 12571 [27], the various RHs are regulated by
saturated salt solutions. The main advantage of this technique is that various samples can be
tested at the same time and there is no upper size limit. Another method is Dynamic Vapour
Sorption (DVS), in which RH is regulated by a nitrogen flow. A small sample is weighed
continuously by a microbalance. This technique was first used in the pharmaceutical field
and the agri-food industry but is now being increasingly used to assess the sorption capacity of building materials [7], [28]–[31]. However, it is controversial because the size of the
sample is very small and building materials tend to be heterogeneous [4], [32]. These two methods were quantitatively compared by Bui et al. [7]. Both methods showed comparable
results for the sorption capacity of barley straw but low correspondence between SSS and
DVS techniques was found on corn flakes [31].
The present paper deals with the influence of the nature of plant aggregates and their
content on the hygrothermal properties of earth materials. Three plant aggregates, barley
straw, hemp shiv and corn cob, were added to an earth matrix to obtain weight contents of 0 to 6%. This experimental study presents the results of thermal conductivity and specific heat
capacity measurements together with two hygric properties: water vapour permeability and
EMC, with an assessment of the sorption-desorption isotherms. The sorption-desorption
curves were plotted from measurements made with both methods, SSS and DVS. The two
methods were qualitatively compared in order to determine whether small samples could be
representative of heterogeneous materials. Finally, the MBVideal was calculated from the two
steady-state hygric properties measured (permeability and sorption capacity) in order to
evaluate the impact of plant aggregates on the moisture buffering capacity of the composites.
2. MATERIALS AND METHODS
2.1. Raw materials
The materials used in this study were earth, as the main matrix, and three plant aggregates:
barley straw, hemp shiv and corn cob. The earth was waste generated by the washing of
limestone aggregates produced for the concrete industry, called quarry fines from aggregate
washing processing (FWAS). The sludge created is left to dry in sedimentation basins and is
then reduced to powder and used. These fines were composed of calcite (60%), kaolinite
(11%), illite (11%), quartz (10%), dolomite (6%) and goethite (3%). FWAS were extremely
fine: 99% of the particles by mass were below 80 μm and the average particle size (D50) determined using pipette analysis was 6.5 μm. Some physical properties of plant aggregates,
Table 1. Physical properties of the plant aggregates
Material Barley straw Hemp shiv Corn cob
Designation S H CC Bulk density (kg.m-3) 57 ± 1 153 ± 2 497 ± 14 Water absorption (%) 414 ± 4 380 ± 11 123 ± 2 Diameter* (mm) 2.3 ± 1.5 2.0 ± 1.2 2.6 ± 0.4 Thermal conductivity (W.m-1.K-1) 0.044 ± 0.001 0.051 ± 0.002 0.096 ± 0.001
* Corresponding to average minor axis by image analysis
2.2. Manufacturing process
The hygrothermal properties were assessed on seven different formulations: a reference
material made of FWAS only and composite materials made with 3% or 6% by weight
content of one of the plant aggregates. The manufacturing process and the main mechanical
properties have been described in a previous article [34]. Table 2 recapitulates the different
proportions of the plant aggregates, the optimum moisture content (wopt), determined by the
Proctor test, and the compressive strength (σc) of the blocks studied.
Table 2. Composition and properties of the specimens
Block formulation Proportion of plant aggregate (%) wopt (%) σc (MPa) FWAS 0 14 4.0 ± 0.4 S3 3 19 3.3 ± 0.2 H3 3 17 2.4 ± 0.2 CC3 3 16 3.2 ± 0.2 S6 6 21 3.8 ± 0.3 H6 6 20 1.8 ± 0.2
CC6 6 16 1.8 ± 0.6
2.3. Thermal conductivity
Thermal conductivity properties were assessed on three 150x150x50 mm3 rectangular prisms for each composition. The measurements were carried out with an EP500 guarded
hot plate apparatus according to the standards ISO 8302 [35] and EN 12667 [36]. Before
testing, the specimens were dried at 100°C and placed in a desiccator to cool. They were
wrapped in a thin plastic film to avoid any humidity uptake during the measurement. The test
was performed at 25°C with a difference of temperature (ΔT) of 10°C between the two
plates. Steady state was assumed to have been reached when the change in conductivity
was less than 1% in 60 minutes. To calculate the thermal conductivity (λ), one-dimensional
heat transfer by steady state conduction was assumed (1):
(1)
where Q is the heat input (W), e the thickness of the specimen (m), and S its cross section
(m²).
2.4. Specific heat capacity
Specific heat capacity (cp) characterizes the ability of a material to store thermal energy. This
value was assessed on two samples of each component of the composite materials (FWAS,
Straw, Hemp shiv and Corn Cob) through Differential Scanning Calorimetry (DSC). In this
study, the device used was a NETZSCH STA 449 F3 and the measurement was performed
on the basis of NF EN ISO 11357-4 [37]. Prior to be tested, the samples were dried at 50°C
until stabilization of the mass before being cooled in a desiccator. The measurements were
done with a temperature increasing from 30°C to 70°C applying the method detailed in [38].
Measurements were realized on three cylindrical specimens 5 cm in diameter and 5 cm high (Φ5H5) for each composition. The wet cup method was applied according to standard NF EN
ISO 12572 [39]. The wet cup was chosen to highlight the effects of capillary transfer in an
earth material. Water vapour and liquid transfers occurred simultaneously through the
sample during the wet cup test. The assessed property thus corresponded to an apparent water vapour permeability. Before testing, specimens were kept at 20°C and 50% RH. The
humidity of the wet cup was regulated at 86% by means of a saturated salt solution of
potassium chloride. This cup, with the specimen on its top, was placed in a chamber
regulated at 23°C and 50% RH. The gradient of relative humidity created an outgoing flow of
water vapour. The specimens were surrounded by an adhesive waterproof aluminium tape
on the lateral face. They were then placed on a plastic support to avoid contact with the
saline solution. The whole setup was finally sealed by a mix of 60% beeswax and 40%
paraffin. The arrangements were weighed regularly until a steady-state vapour flux was
established. The transmission rate of water vapour through the sample (G in kg.s-1) was
determined by linear regression excluding the initial, non-linear, phase.
The water vapour permeability (δ) and the water vapour diffusion resistance factor (μ) were
then determined for the seven compositions. The water vapour permeability (kg.m-1.s-1.Pa-1)
was calculated with the following equation (2) which takes the resistance of the air-layer
between the base of the sample and the saturated salt solution into account [38]:
(2)
with e (m) the thickness of the sample, A (m2) the exposed surface area of the sample, Δp
(Pa) the vapour pressure difference across the sample, ea (m) the thickness of the air layer
between the sample and the salt solution and δa the water vapour permeability of the air
(kg.m-1.s-1.Pa-1).
The vapour pressure difference was calculated using equation (3) [39]:
with RH1 and RH2 (%) the relative humidity inside and outside the cup, respectively, and θ
the temperature (°C).
The water vapour permeability of the air was determined using equation (4) [40]:
(4)
with p0=1013.25 (hPa), the standard atmospheric pressure, R=462 (N.M.kg-1.K-1) the gas
constant for water vapour, T (K) the temperature and p (hPa) the atmospheric pressure.
The water vapour diffusion resistance factor was finally calculated with equation (5):
(5)
2.6. Sorption and desorption isotherms
The relation between the water content of a material and the relative humidity of the
environment at constant temperature can be represented by its sorption-desorption isotherm.
The sorption-desorption property is necessary to model the buffering effect of a material and
has great influence on its resistance to the proliferation of micro-organisms [32].
2.6.1. Saturated salt solution method
The saturated salt solution method consists of exposing a material to various defined relative
humidity levels regulated by saturated salt solutions at a constant temperature. The water
content of the material is then determined gravimetrically. The detailed experimental procedure is presented in the standard NF EN ISO 12571 [27]. The samples were exposed
to six conditions controlled by six different salts. Their theoretical values of relative humidity
and the associated uncertainties are presented in Table 3. The choice of the salts was made
according to their availability in the laboratory and the recommendations of the standard,
which requires at least five salt solutions in the range of 9% to 93% of relative humidity. The test was assessed on some pieces of broken monolithic samples (Φ5H5-specimens), of
5 g. The masses differed depending on the bulk density of the material. Approximately the
same volume was tested each time. The test was performed in triplicate. The samples were
first dried at 50°C, as done in [7], [29], until constant mass was reached (weight variation of
less than 0.1% between two weighings 24 h apart). The samples were then put in a sealed
ventilated box to be successively exposed to the different relative humidity steps. The relative humidity was increased in steps from around 8% to 95% to determine the sorption
curve. It was then decreased from 94% to 8% in order to trace the desorption curve. The
moisture content was calculated at equilibrium, when the mass variation was less than 0.1%
between three consecutive weighings.
Table 3. Equilibrium relative humidity of the different saturated salt solutions at 20°C
Relative humidity (%) Salt
7.98 ± 1.9 1 Sodium hydroxide (NaOH)
22.51 ± 0.321 Potassium acetate (CH3COOK)
43.16 ± 0.331 Potassium carbonate (K2CO3)
65.52 Ammonium nitrate (NH4NO3)
75.47 ± 0.141 Sodium chloride (NaCl)
94.62 ± 0.661 Potassium nitrate (KNO3) 1 According to NF EN ISO 12571 [27]
2 According to Winston and Bates [41]
2.6.2. DVS method
The sorption-desorption isotherms of the different materials were also evaluated by the
Dynamic Vapour Sorption (DVS) method. Temperature and relative humidity are the two
parameters regulated by the device (Surface Measurement Systems, London, UK). The RH
inside the hermetic cell is regulated by means of a dry gas (nitrogen). The schematic system
every 60 seconds. The test was assessed on monolithic broken samples (Φ5H5-specimens),
of mass between 0.4 and 1.4 g, and on loose particles (plant and earth), of mass between 30
and 90 mg. The masses were very low because of the small sample holder volume (Figure
2). Two specimens of each formulation were tested and were assumed to be representative
of these hygroscopic materials [4], [42].
Figure 1. Schematic layout of the DVS system [7]
Figure 2.Sample holder in its opened cell (here CC3 sample)
Before testing, the specimen was dried at 50°C in the DVS device for 2h. The test was
carried out at 23°C, which is the same temperature as the one presented in the standard of
the saturated salt solution method, EN NF ISO 12571 [27]. Relative humidity was regulated
For each step, moisture balance was considered to be reached in the specimen if the mass
variation over the time variation (dm/dt) was less than 5.10-4 %.min-1over a ten-minute period
[29] or in a maximum time interval of 360 minutes (twice this time for the last three steps).
The water content was calculated as the ratio of the water contained in the material to the
mass of the sample (weight over weight). Figure 3 is an example of sorption-desorption behaviour with this programme for an S6 specimen.
Figure 3. Typical variation of mass with relative humidity steps for the DVS (here sorption-desorption of an S6 specimen)
2.7. Prediction of the Moisture Buffer Value from the steady state properties
This paper deals with the measurement of the steady-state hygrothermal properties of
earthen materials. However, the moisture buffering capacity of this type of material is often
asserted [43]. Thus, it was chosen to calculate a theoretical Moisture Buffer Value, called
MBVideal, by means of calculations presented in the literature. A good correlation between the
experimental and the theoretical values was found in [4]. The calculations were thus made
with the equations proposed by the Nordtest report [11].
(6)
with δ (kg.m-1.s-1.Pa-1) the water vapour permeability measured with the wet cup, ρ
d (kg.m-3)
the dry density, psat (Pa) the water vapour saturation pressure at θ=23°C, and ξ the moisture
capacity (kg.kg-1). The water vapour saturation pressure was calculated with equation (7):
(7)
The moisture capacity was calculated from the results of the sorption experiment (with SSS
and DVS). It corresponds to the slope of the sorption curve between 33 and 75%, which is
assumed linear, calculated according to equation (8) using a linear correlation:
(8)
with u (kg.kg-1) the moisture content and Φ (without unit) the RH.
The MBVideal was finally calculated from equation (9), relative to 8h/16h cycles:
(9)
where tp (s) is the time period, corresponding to 24h.
3. RESULTS AND DISCUSSION
3.1. Thermal conductivity
As has been widely reported in the literature, the main interest of adding a bio-resource in an earth matrix is to improve the thermal insulation behaviour of the material [8], [13], [44]. The
thermal conductivity of the seven materials was measured on three samples of each
formulation, in a dried state. The effect of the plant aggregate content on thermal conductivity
Figure 4. Thermal conductivity of the different materials
Thermal conductivity of the specimens made without any plant aggregate (FWAS) is 0.57
W.m-1.K-1. For the specimens with plant aggregates, the values of thermal conductivity range
from 0.14 W.m-1.K-1 for S6 specimens to 0.35 W.m-1.K-1 for CC3 specimens. These results
show that an addition of plant aggregates in an earth matrix decreases the thermal conductivity of the material. The most efficient plant aggregate for improving the thermal
insulation of the material seems to be straw. The addition of 6% of straw decreased the
thermal conductivity by 75% in comparison with an FWAS specimen whereas the decrease
was only 55% in the case of an addition of 6% of corn cob. This is in accordance with
previous results on the bulk density of plant aggregates (Table 1) and of the composites
tested here (Table 4).
Although a constant mass proportion of the different plant aggregates was used in the
manufacture of the material, the resulting volume proportion was different for each nature of
plant aggregate. The volume proportion (V) of the plant aggregates contained in the different
composites can be calculated knowing the density of the FWAS specimen and the density
and mass proportion of plant aggregate for each composite. The results are presented in Table 4, together with the dry density (ρd), the thermal conductivity (λ) and the mass
proportion (M) of the different mixes.
S H CC 0.0 0.1 0.2 0.3 0.4 0.5 0.6 0% 3% 6% λ (W .m -1.K -1) S H CC
Table 4. Physical description of the different formulations
Reference ρd (kg.m-3) λ (W.m-1.K-1) M (%mass.) V (%vol.)
FWAS 1891 ± 54 0.57 ± 0.03 0 0 S3 1537 ± 5 0.28 ± 0.02 3 21 H3 1519 ± 38 0.30 ± 0.01 3 22 CC3 1671 ± 21 0.35 ± 0.02 3 14 S6 1100 ± 49 0.14 ± 0.01 6 45 H6 1271 ± 16 0.20 ± 0.01 6 37 CC6 1565 ± 18 0.26 ± 0.01 6 22
The volume proportion difference is clear for the composites containing 6% of plant
aggregates. There is indeed a volume of straw of 45% whereas the volume of hemp shiv is
only 37% and corn cob only 22%.
Concerning thermal properties, the higher the plant aggregate content is, the lower is the
thermal conductivity. This can be explained by the associated decrease of bulk density due
to the intra-granular porosity of the plant particle. Thermal conductivity values of the composites studied are plotted versus their dry density in Figure 5. Other values of earth
materials with bio-aggregates, from the literature, have been added for comparison. All the
values from the literature came from experiments, except for those of Laurent [45] and Al
Figure 5. Comparison of thermal conductivity values found experimentally (in this study and in the literature) and theoretical values (from the literature) as a function of density
All the materials from the literature presented in Figure 5 are earth-based. They can be
stabilized with lime [3], with plant particles such as coconut fibres [46] or straw [45], or with plant particles and cement [17]. Even though the results all came from the same type of
material, the values present a large range of variation. For example, it can be seen on Figure
5 that, for a dry density of around 1500 kg.m-3, the thermal conductivity values range
between 0.3 W.m-1.K-1 (this study) and 0.7 W.m-1.K-1 [44]. In the same way, for a dry density
of around 2000 kg.m-3, the thermal conductivity values range between 0.6 W.m-1.K-1 (this
study) and 1.4 W.m-1.K-1 [14]. The measured values of the present study are thus situated in
the lower part of the measured thermal conductivities. It can be observed that the values of
the present study are of the same order of magnitude as [17], [47] and quite close to the
values of [12], but significantly lower than the other references.
However, a correlation can be made between the thermal conductivity and the density of the
materials. Several relations have already been developed. Laurent [45] has developed a
(10)
A linear relation (11) was determined for clay-cement-wood composites by Al Rim et al. [12]:
(11)
where, in both cases, λ is the thermal conductivity of a material in the dry state and ρ is the dry density.
These two relations, plotted on Figure 5, are quite different but seem to follow the two tendencies of the thermal conductivities. Laurent’s relation gives a higher thermal conductivity than Al Rim’s. The results of the present study are more correlated with Al
Rim’s.
3.2. Specific heat capacity
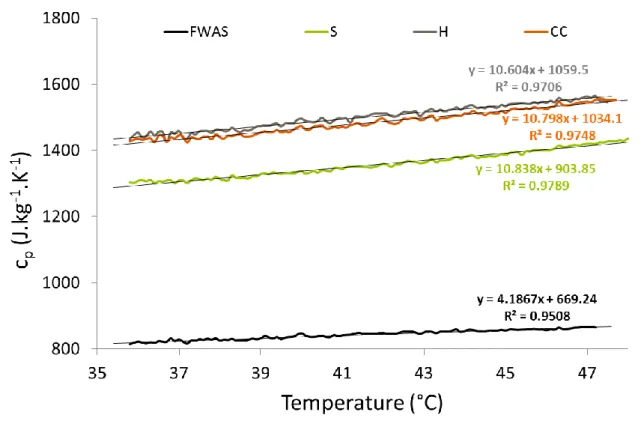
Typical specific heat capacity of the raw materials is presented in Figure 6. It can be
observed that the specific heat capacity is linearly proportional with the temperature. The
values are much higher for the plant particles, between around 1300 and 1600 J.kg-1.K-1,
than for the earth alone (between 800 and 900 J.kg-1.K-1). However, some variations can be
observed for the plant aggregates: straw has a specific heat capacity lower than hemp shiv
Figure 6. Specific heat capacity (cp) of the different raw materials as a function of temperature
Due to the method used, the temperature range of the measurement was above the ambient
temperature. In order to deduce the specific heat capacity of the composite materials, the
specific heat capacity is thus extrapolated at 25°C, which is the same temperature as for the
measurement of thermal conductivity. The obtained values are: 774, 1175, 1325 and 1304
J.kg-1.K-1 for FWAS, straw, hemp shiv and corn cob respectively.
The specific heat capacity of the composite materials is then calculated with equation (12):
(12)
where x is the proportion by mass of the various composite components (earth or plant
aggregates).
In addition to the specific heat capacity cp, various parameters could be calculated in order to
assess the contribution of a material to the building thermal inertia, the most common being thermal effusivity and diffusivity [23], [24], [48]–[50].
These two parameters can be respectively calculated following equation (13) and equation
(14) from thermal conductivity (λ), dry density (ρd) and specific heat capacity (cp) of the
considered material.
(13)
(14)
The resulting values are recapitulated in Table 5 for FWAS and the different composite
formulations.
Table 5. Specific heat capacity (cp), volumetric heat capacity (ρd.cp), calculated effusivity (E) and calculated diffusivity (D) of the earth matrix and of the composite materials
cp (J.kg-1.K-1) ρd.cp (J.m-3.K-1) E (J.K-1.m-2.s-1/2) D x 10-7 (m2.s-1) FWAS 774 1463634 913 3.9 S3 786 1208700 582 2.3 H3 791 1201592 600 2.5 CC3 790 1320745 680 2.7 S6 800 879555 351 1.6 H6 809 1028455 454 1.9 CC6 808 1264254 573 2.1
cp value for FWAS is lower than measurements reported in the literature on compressed
stabilized earth bricks ranging from 939 to 1170 J.kg-1.K-1 [51], but slightly higher than those
measured on unfired earth bricks by El Fgaier et al. (from 545 to 712 J.kg-1.K-1) [25], or on
adobe by Abanto et al. (from 560 to 614 J.kg-1.K-1) [26].
All the specific heat capacity values range between 770 and 810 J.kg-1.K-1. Although the cp
composites are only slightly higher than earth material alone. This can be explained by the
low mass content of the plant aggregates in comparison with the earth. Moreover, when
volumetric heat capacity is considered, the incorporation of plant aggregates to the earth
systematically limits this property due to the large decrease of density.
Despite the slight improvement observed on specific heat capacity, the addition of the plant aggregates engenders a decrease of the thermal effusivity values, from 913 J.K-1.m-2.s-1/2 in
the case of FWAS material, until 351 J.K-1.m-2.s-1/2 in the case S6 specimens. The diffusivity
is also affected by the introduction of plant aggregates, it decreases when the plant content
increases. Once again, the lower value was obtained with the S6 mix.
Nevertheless the consequences of these evolutions on the thermal inertia of the envelope
are contrasting. Indeed, to increase thermal inertia, materials should present low diffusivity
and high effusivity [49]. A low diffusivity would lengthen the thermal delay existing between
outdoor temperature change and indoor resulting temperature variation. A high effusivity
would allow a quick absorption of heat by the material with limited surface temperature rise.
These two distinct aspects of thermal inertia can be respectively qualified as inertia of
transmission and inertia of storage [50].
So, plant aggregates incorporation into the unfired earth bricks would improve the
transmission inertia of the wall but decrease its inertia of storage. These types of lightened
earth based materials would then be more appropriated for the realisation of external walls
delaying the heat transfer from outdoor to indoor.
3.3. Water vapour permeability
The water vapour permeability was measured for each formulation using the wet cup
method. The assemblies were weighed daily. Using the measurements and the calculation presented in standard NF EN ISO 12572, the water vapour permeability (δ) and the water
vapour diffusion resistance factor (μ) were deduced for each composite specimen. The
average values calculated from the different formulations are presented in Table 6. The water vapour diffusion resistance factor is generally used in comparisons. All the average
water vapour diffusion resistance factors are close: between 4.8 and 7.0. The values for
earth alone (FWAS specimens) are similar to those of earth bricks studied by Cagnon et al.
[29], for which µ-values were between 3 and 7. They are slightly lower than other values of
the literature, ranging between 5.5 and 8.2 (also measured with the wet cup) [4] or between 8
and 11 [3].
The values for the bio-composites can be compared with the earth render containing oat
fibres studied by Faria et al.[52], which was around 8. They can also be compared with the
water vapour permeability measured on cob (construction technique using earth with straw)
by [5]. The µ-values were between 6.5 and 9.8. This result is quite close to the permeability
of S6 and H6, which were respectively 7.0 and 6.1.
Table 6. Water vapour permeability of the materials
Reference δ x 10-11 (kg.m-1.s-1.Pa-1) µ FWAS 4.0 ± 0.3 4.9 ± 0.3 S3 3.8 ± 0.3 5.2 ± 0.4 H3 4.1 ± 0.5 4.8 ± 0.6 CC3 3.8 ± 0.5 5.2 ± 0.7 S6 2.8 ± 0.1 7.0 ± 0.3 H6 3.2 ± 0.1 6.1 ± 0.2 CC6 3.9 ± 0.5 5.1 ± 0.7
Figure 7. Water vapour diffusion resistance factor (μ) according to the plant aggregate content
The µ-values are shown in Figure 7. The results presented here do not bring out significant
influence of the addition of 3% of plant aggregates on the permeability of the material. The
same comment can be made about the composite including 6% of corn cob. In contrast,
when the mixes with 6% of straw or hemp shiv are considered, an increase of µ is observed.
Thus, even though the S6 and H6 composites present lower density due to the
macroporosity of the plant aggregates, their apparent water vapour permeability is limited in
comparison with the FWAS specimen. Liquid transfer in smaller pores has a major impact on
the macroscopic water transport in clay material as shown by Fouchal et al. [9]. Their study
on extruded earth bricks underlines the fact that, from 50%RH, capillary condensation occurs in the pores that are smaller than 0.1 µm [9]; another study set a limit at 50 nm [53].
Moreover, it has also been shown that the intra-aggregate pore size in an earth material
compacted to the Proctor density is between 10 and 50 nm [54].
The decrease of water vapour permeability in wet conditions due to the inclusion of straw or
hemp shiv could then be explained by the reduction of capillary diffusion within the earth
matrix. Indeed, the large volume content of these two plant aggregates (see Table 4)
cob samples. This is consistent with the results of Fouchal et al. [9] showing that an earth
material was more permeable than wood. Moreover on clay brick, a µ-value in dry conditions
was found to be 1.5 to 3.8 times greater than in wet conditions [29].
Considering the water vapour permeability, the inclusion of plant particles in an earth matrix
does not seem beneficial. Nonetheless, the present results underline once again the large water vapour permeability of earth brick in comparison with the reference values of other
load bearing building materials according to the 2012 French Thermal Regulations [55]. The
permeability of earth bricks is comparable to that of porous construction materials such as
wood concrete or gypsum (lower than 10) [29].
3.4. Sorption isotherms
3.4.1. Saturated salt solution method
The saturated salt solution (SSS) method is very time consuming. Three to four weighings
per week were performed for around one year for all the sorption-desorption steps.
Equilibrium needs to be reached at the end of a given RH. However, the equilibrium was not
completely reached at 94% of RH because of potential microbial growth [7]. During a
preliminary test, mould growth was observed on the plant aggregates after two weeks at this
step. The exposure to this last stage was thus stopped after two weeks, even if equilibrium
was not reached.
Bulk materials
The sorption-desorption isotherm curves of the bulk materials are presented in Figure 8. The
water content represented in the graph corresponds to a mass percentage (ratio of the mass
of water to the mass of material). As already noted by other authors [5], [32], [56] for
bio-based materials, the curves presented here have a sigmoidal shape. According to the IUPAC
classification [57], which determines six types of curves, these curves belong to Type II.
where capillary condensation occurs [29], [57]. The curve is close to a vertical asymptote and
the representativeness can thus be questionable at these RH.
In Figure 8, similar behaviour can be noted between the three plant aggregates up to 75%,
although the sorption capacity of the straw is slightly higher than the other two in this range.
At 94% RH, the corn cob has a moisture content that is slightly higher than that of the straw and much higher than that of hemp shiv. However, with the high standard deviations at 94%
(particularly for the straw), no significant difference can be highlighted between straw and
corn cob. The water content of the plant aggregates at 94% RH is thus between 21 and 26%,
whereas it is only around 2% for the powdered FWAS. To compare with other natural fibres,
at 60% RH for example, the three plant aggregates have a water content of approximately
8.5%. At the same RH, the natural fibres tested by Hill et al. [28] presented quite a similar
sorption capacity, between 7.5 and 10% for flax, coir, jute, Sitka spruce or hemp fibres, the
exception being cotton fibres, which showed a lower sorption of 5.5%. According to their
conclusions, the sorption capacity increases with the OH accessibility and the lignin content
of the fibres.
The hysteresis is calculated by subtracting the water content of the sample during the drying
isotherm from the water content during the wetting isotherm. This is a typical phenomenon
for cellulosic and lignocellulosic materials and is explained by the ink-bottle effect
(interconnected pore spaces) [5], [56]. The hysteresis values of the different raw materials
are presented in Figure 9. For the three plant aggregates, it can be observed that the hysteresis value increases with the RH. This is also the case for FWAS between 22 and
65%. The values are much higher for the plant aggregates (between 1 and 3.5%) than for the
earth (lower than 0.2%). According to Hill et al. [28], this result was to be expected because
the hysteresis is greater for materials with high lignin content than for materials with low or no
lignin content.
Figure 9. Isotherm hysteresis of the raw materials (SSS)
Monolithic materials
Composite and monolithic materials were also tested with the SSS method. Their
sorption-desorption isotherm curves are shown in Figure 10. In the same way as in the raw materials,
the moisture content increases with relative humidity following the usual Type II curve [56].
The sorption capacity is higher in the case of an addition of 6% of plant aggregates than 3%
or no addition (FWAS specimens). This is consistent with the moisture sorption capacity of
bulk materials presented in Figure 8. Plant particles present higher porosity and their
composites. There is no significant difference of sorption capacity for the same addition of
content. As was seen with the sorption capacity of bulk plant aggregates, the type of plant
does not have any real influence (Figure 8). At high RH, the sorption capacity of FWAS
specimens is 2.2%. It is 2.7% and 3.2% on average for additions of 3% and 6% of plant
aggregate, respectively. Consequently, an addition of 3% of plant aggregates increases the sorption capacity of the earth by about 21% and an addition of 6% increases it by about 46%.
The good sorption capacity of the plant particles improves the lower capacity of the earth,
because of the increase in porosity [3]. However, it must be stressed that EMC was
expressed in kg.kg-1 (Fig. 9). For a typical wall, made of the same volume of bricks, the
difference of adsorption between the various mixes would be less marked since the density
of the mixes including the plant aggregates would be reduced in comparison with the FWAS
alone.
When compared with the literature results, the sorption capacity of FWAS is similar to the
one found by Ashour et al. [58] for an earth plaster (EMC of 1.8% at 95% RH), but differs
from other literature values. Cagnon et al. [29] assessed the sorption capacity of five unfired
bricks, whose water content was between 4 and 5.5% at high RH. McGregor et al. [4] also
studied a clay material and found an EMC of 4% at around 95% RH. The water sorption of
cob was assessed in [5]. The water content was around 5.5% at high RH, but the straw
content is unknown. In the case of a straw-clay mixture [59], where the straw content was
very high in comparison to the clay content, the water content was around 12% at 93% RH.
Thus, the sorption capacity of the FWAS seems to be lower than that of the earth reviewed.
A link has been made between the sorption capacity and the nature of the clay mineral to
explain that difference. Kaolinite seems less reactive than montmorillonite or illite [3], [29],
Figure 10. Sorption-desorption isotherms of all the formulations (SSS left, DVS right)
The isotherm hysteresis of each material is shown in Figure 11. For all the materials, the
hysteresis value increases with the RH (except for the last point at around 75%). The
hysteresis of earth is the lowest while the hysteresis of composite materials with straw is one
of the highest. The values are lower than in Cagnon et al. [29] where the hysteresis values
can reach 0.7%. In comparison, the hysteresis values of concrete are much greater [61],
around 7%. In the case of hemp concrete, hysteresis values ranged between 1 and 5% [10],
which is an expected result because hemp concrete contains more lignocellulosic materials than the composites of the present study.
Figure 11. Isotherm hysteresis of the monolithic materials (SSS)
The sorption-desorption curves of powdered samples and monolithic samples of FWAS are
compared in Figure 12. At low RH, the bulk sample presents a higher sorption capacity than
the monolithic sample. However from 50% RH, the two curves are very similar, with the
same water content at 94% RH. This difference at low RH might be due to the difference of
specific surface area. For powdered samples, the surface area available for monomolecular
layer sorption is larger than for monolithic samples.
It should be noted that the SSS method can present some uncertainties in the regulation of
RH. The saturated salt solutions are highly sensitive to small variations of temperature. For
example, a rapid increase from 20°C to 21°C can cause a drop of an NaCl solution from 75%
to 71% [62]. The test was carried out in an air-conditioned room, but small variations of
temperature could occur depending on the outside climate or the presence of people in the room.
3.4.2. DVS method
The test lasted about 7 days for each sample. Two samples per formulation were tested and
the total duration was thus about 100 days. The results of the DVS sorption-desorption
isotherm curves for monolithic samples are shown in Figure 10. The results, quite similar to
those obtained with the SSS method, are not commented in detail.
For the sake of clarity, the standard deviations of the tests are not represented. However, the
standard deviation of S6 specimens was very large. With the small volume of the sample
tested and the heterogeneity of the composite material, there is obviously a problem of
representativeness. In the case of CC3 and CC6 formulations, the samples were weighed to
obtain a corn cob content of 3% or 6%. Even if the samples were monolithic, the corn cob
particles presented poor adhesion with the earth matrix, allowing separate weighing of the
corn cob and the earth. The standard deviations of the composites with corn cob were thus
lower than for the straw composites.
3.4.3. Comparison between DVS and SSS methods
The two methods to plot sorption-desorption isotherm curves can be compared. The curves
were similar for the different materials, so only one is presented here for the bulk materials (S
sample) and two materials for the monolithic samples (FWAS and a bio-composite, CC6) in
Figure 13.
For each material, the curves obtained with the two techniques show a similar shape. It can, however, be observed that the sorption capacity is always higher when measured with the
DVS technique. This observation was already made in [29], where it was compared for clay
bricks and in [32] for the case of bio-based insulating materials. This difference was just
slightly higher in [7] for barley straw. The difference between the two techniques was only of
the same order of magnitude as the uncertainties. This can be explained by the definition of
the dry state according to the method used. When dried in an oven, the sample can contain residual humidity [63] and its dry mass might be overestimated [7]. Thus the sorption
capacity would seem lower with the SSS technique. Even if the initial samples did not have
exactly the same moisture content, the loss of water during the drying was quite different
according to the method used. For example, the loss of water was approximately 0.2% for a
monolithic FWAS sample dried in the oven whereas it was around 0.8% in the case of drying
with the DVS device.
A "correction" of the initial dry mass M0 was applied in Figure 13 (d) in order to evaluate the
impact of a supposed overestimation of the dry mass with the SSS technique. With a
decrease of 0.45% of the dry mass of the monolithic CC6 samples, the curves obtained with
SSS and DVS methods are quite closely superposed. A significant difference remains for the
point at 8% RH, which could be due to the duration of the test as the stabilization time with
the SSS technique was much longer than with the DVS technique, especially for low RH.
Further tests will be performed in order to evaluate the impact of the stabilization criteria for
the DVS technique on the EMC.
A difference of hysteresis can also be seen between the two methods. The hysteresis
obtained with the DVS method is higher than that obtained with the SSS method. This might
still be due to a kinetics issue: although the sample was bigger in the case of the SSS
method, it was exposed to a certain RH for at least two weeks, against 6 hours (for RH lower
Figure 13. Comparison of the isotherm curves obtained with SSS and DVS methods: (a) bulk straw, (b) monolithic FWAS sample, (c) monolithic CC6 sample and (d) monolithic CC6 sample with a modified "dried" M0 of 0.45% more
3.5. Prediction of the Moisture Buffer Value from the steady state properties
Although it is only a theoretical value, the MBV calculated is useful to compare the various
formulations of the present study. The MBVideal of each material is presented in
Table 7 and Figure 14.
Table 7. Calculated dynamic properties
Reference ξ1 from SSS ξ2 from DVS bm (kg.m- bm (kg.m- MBVideal (g.m- MBVideal (g.m
-(a) (b)
(kg.kg-1) (kg.kg-1) 2.Pa-1.s-1/2) with ξ1 2 .Pa-1.s-1/2) with ξ2 2 .%RH-1) with ξ1 2.%RH-1) with ξ2
FWAS 0.0157 0.0154 6.49E-07 6.42E-07 3.0 3.0
S3 0.0182 0.0188 6.12E-07 6.22E-07 2.9 2.9 H3 0.0196 0.0174 6.62E-07 6.24E-07 3.1 2.9 CC3 0.0176 0.0195 6.32E-07 6.66E-07 3.0 3.1 S6 0.0219 0.0211 4.89E-07 4.81E-07 2.3 2.3 H6 0.0238 0.0216 5.86E-07 5.57E-07 2.7 2.6 CC6 0.0232 0.0235 7.09E-07 7.14E-07 3.3 3.3
Figure 14. MBVideal according to the material
The moisture buffering capacity of the materials studied here are between 2.3 and 3.3. A
very small difference of value (maximum 0.2) can be observed between the calculations
based on the SSS or the DVS experiment. For all the formulations, the MBVideal is above 2.
This means, according to the Nordtest classification [11], that the materials present an
excellent moisture buffering capacity.
No significant effect can be observed for an addition of 3% of plant aggregates in comparison
to FWAS specimens. However, the addition of 6% engenders a decrease of the MBVideal for
water permeability, which appears to be the major factor. The increase of the value of MBV
in the case of corn cob is the result of the higher density of this composite, even if the
sorption (in mass) of corn cob is close to that of the other two bio-resources.
These theoretical results seem to be in accordance with some experimental values found in
the literature. The MBV of unfired clay masonry measured by McGregor et al. [43] varied from 1.13 to 3.73 g.m-2.%RH-1 for similar cycles (8h/16h cycles at 75% and 33% RH). In
addition, Palumbo et al. [64] found very similar results on Compressed Earth Blocks (CEB)
containing 1% and 2% of barley straw by weight content: 2.6 and 2.7 g.m-2.%RH-1
respectively. Whereas a small increase of the MBV can be observed with the increase of
straw in the case of CEB, a small decrease has been noticed in the case of clay plaster.
Indeed, the addition of 1% of barley straw in the plaster led to a slight decrease of the MBV
(2.6 g.m-2.%RH-1) in comparison to the clay alone (2.9 g.m-2.%RH-1). This last observation
supports the theoretical values calculated in the present study.
4. CONCLUSION
This paper has focused on the hygrothermal characterization of earthen materials containing
several types of plant aggregates, namely barley straw, hemp shiv and corn cob. The
experimental tests have shown that the addition of plant aggregates in an earth matrix
improves the thermal behaviour of the material by decreasing the thermal conductivity. For
example, the addition of 6% by weight of straw, corresponding to a volume of around 45%,
decreased the thermal conductivity by 75% with respect to the earth material without any
plant aggregate. In the case of an outer wall, this decrease would allow the thickness of the
additional insulating material to be reduced. However, it would not be enough to avoid using
an insulating material while maintaining the thermal performance levels required by the
current thermal regulations [33]. Moreover, the measurements of specific heat capacity,
thermal conductivity and dry density allowed calculating thermal effusivity and diffusivity of
the various mixes. The plant matter incorporation conversely affects these two properties. Despite the slight increase of specific heat capacity, the addition of plant aggregates induces
a significant decrease of effusivity, lowering its contribution to the storage inertia. In the same
time, mainly thanks to the large reduction of thermal conductivity, the addition of plant
aggregates would present a positive effect on transmission inertia.
Concerning water vapour permeability, the addition of a large volume of plant aggregates,
such as 6% by weight of straw or hemp shiv (corresponding to volumes of 45 and 37% respectively), limits the moisture transport slightly. However, for the other formulations, no
effect on that property was observed.
The moisture storage capacity of the bulk plant aggregates is quite high in comparison to that
of earth. However, the water content is expressed as the amount of water per unit mass of
material. Thus, the final product presents only a slight improvement of the sorption capacity,
due to the low plant matter mass. Two methods were used to assess the sorption-desorption
isotherms: the saturated salt solution method and the Dynamic Vapour Sorption method. The
DVS method gave higher values of sorption capacity, which might have been partly due to
the definition of the dry state.
Finally, the theoretical Moisture Buffering Value was calculated. This hygric property is
interesting by its dynamic nature, which gives information about the indoor moisture buffering
when there are RH fluctuations. Although there are some differences in the isotherms
between the SSS and DVS methods, no difference is observed for the MBVideal calculated
with the two methods as the slope of the curve is taken into account, not the sorption
capacity. So, in terms of moisture buffering, an addition of 3 or 6% of plant aggregates did
not significantly improve the hygric behaviour of the earth alone, which already showed an
excellent buffering capacity. Further studies could be carried out to measure the
experimental MBV and compare the values obtained with the calculated ones.
These results have to be related with those of a complementary study focusing on
mechanical properties [34]. The incorporation of low plant content has been shown to induce
a significant drop in mechanical strength which would require an increase in the wall
thickness to maintain a sufficient load bearing capacity. Given the global results achieved, it appears that, for a thermal resistance optimization, the incorporation of plant matter in an
earth matrix should involve large mass proportions (dry density of the composite lower than
500 kg.m-3 [59], [65]). The consequence would be that the material would be neither
extrudable nor load bearing. Conversely, thanks to their moisture buffering capacity and
thermal inertia, the use of extruded earth bricks without plant matter would be interesting in
buildings for load bearing interior walls, or outer walls if they were externally insulated. These results highlight the need for a complementary study at building scale, in order to
propose an optimized architectural design combining various earthen materials for external
and indoor walls to achieve good comfort in summer together with good energy efficiency in
winter. The major impact of ventilation strategies and passive solar gains should also be
evaluated.
ACKNOWLEDGEMENTS
The authors wish to thank the French National Research Agency (ANR) for funding the
project BIOTERRA - ANR - 13 - VBDU - 0005 Villes et Bâtiments Durables.
REFERENCES
[1] G. Minke, Building with Earth: Design and Technology of a Sustainable Architecture, Birkhäuser. Basel, Switzerland, 2006.
[2] P. Taylor, R. J. Fuller, and M. B. Luther, “Energy use and thermal comfort in a rammed earth office building,” Energy and Buildings, vol. 40, no. 5, pp. 793–800, 2008.
[3] S. Liuzzi, M. R. Hall, P. Stefanizzi, and S. P. Casey, “Hygrothermal behaviour and relative humidity buffering of unfired and hydrated lime-stabilised clay composites in a Mediterranean climate,” Building and Environment, vol. 61, pp. 82–92, 2013.
[4] F. McGregor, A. Heath, E. Fodde, and A. Shea, “Conditions affecting the moisture buffering measurement performed on compressed earth blocks,” Building and
Environment, vol. 75, pp. 11–18, 2014.
[5] F. Collet, M. Bart, L. Serres, and J. Miriel, “Porous structure and hydric properties of cob,” Journal of Porous Media, vol. 13, no. 2, pp. 111–124, 2010.
[6] A. Simons et al., “Development of bio-based earth products for healthy and sustainable buildings: characterization of microbiological, mechanical and hygrothermal properties,”
Matériaux & Techniques, vol. 103, no. 2, 2015.
[7] R. Bui, M. Labat, and J.-E. Aubert, “Comparison of the Saturated Salt Solution and the Dynamic Vapor Sorption techniques based on the measured sorption isotherm of barley straw,” Construction and Building Materials, vol. 141, pp. 140-151, 2017.
[8] S. Dubois, F. McGregor, A. Evrard, A. Heath, and F. Lebeau, “An inverse modelling approach to estimate the hygric parameters of clay-based masonry during a Moisture Buffer Value test,” Building and Environment, vol. 81, pp. 192–203, 2014.
[9] F. Fouchal, F. Gouny, P. Maillard, L. Ulmet, and S. Rossignol, “Experimental evaluation of hydric performances of masonry walls made of earth bricks, geopolymer and wooden frame,” Building and Environment, vol. 87, pp. 234-243, 2015.
[10] F. Collet, J. Chamoin, S. Pretot, and C. Lanos, “Comparison of the hygric behaviour of three hemp concretes,” Energy and Buildings, vol. 62, pp. 294–303, 2013.
[11] C. Rode, R. . Peukhuri, L. . Mortensen, K. . Hansen, and A. Gustavsen, “Moisture buffering of building materials.” Department of Civil Engineering, Technical University of Denmark, 2005.
[12] K. Al Rim, A. Ledhem, O. Douzane, R. M. Dheilly, and M. Queneudec, “Influence of the proportion of wood on the thermal and mechanical performances of clay-cement-wood composites,” Cement and Concrete Composites, vol. 21, no. 4, pp. 269–276, 1999. [13] S. Goodhew and R. Griffiths, “Sustainable earth walls to meet the building regulations,”
Energy and Buildings, vol. 37, no. 5, pp. 451–459, 2005.
[14] H. Bal, Y. Jannot, S. Gaye, and F. Demeurie, “Measurement and modelisation of the thermal conductivity of a wet composite porous medium: Laterite based bricks with millet waste additive,” Construction and Building Materials, vol. 41, pp. 586–593, 2013. [15] B. Mazhoud, F. Collet, S. Pretot, and C. Lanos, “Development and hygric and thermal
characterization of hemp-clay composite,” European Journal of Environmental and Civil
Engineering, pp. 1–11, 2017.
[16] A. Laborel-Préneron, J. E. Aubert, C. Magniont, C. Tribout, and A. Bertron, “Plant aggregates and fibers in earth construction materials: A review,” Construction and
Building Materials, vol. 111, pp. 719–734, 2016.
[17] H. Binici, O. Aksogan, M. N. Bodur, E. Akca, and S. Kapur, “Thermal isolation and mechanical properties of fibre reinforced mud bricks as wall materials,” Construction
and Building Materials, vol. 21, no. 4, pp. 901–906, 2007.
[18] T. Ashour, H. Wieland, H. Georg, F.-J. Bockisch, and W. Wu, “The influence of natural reinforcement fibres on insulation values of earth plaster for straw bale buildings,”
Materials & Design, vol. 31, no. 10, pp. 4676–4685, 2010.
[19] H. Bal, Y. Jannot, N. Quenette, A. Chenu, and S. Gaye, “Water content dependence of the porosity, density and thermal capacity of laterite based bricks with millet waste additive,” Construction and Building Materials, vol. 31, pp. 144–150, 2012.
[20] P. Meukam, A. Noumowe, Y. Jannot, and R. Duval, “Caractérisation thermophysique et mécanique de briques de terre stabilisées en vue de l’isolation thermique de bâtiment,”
Mat. Struct., vol. 36, no. 7, pp. 453–460, 2003.
[21] H.-R. Kymäläinen and A.-M. Sjöberg, “Flax and hemp fibres as raw materials for thermal insulations,” Building and Environment, vol. 43, no. 7, pp. 1261–1269, 2008. [22] A. Bouguerra, A. Ledhem, F. de Barquin, R. M. Dheilly, and M. Quéneudec, “Effect of
microstructure on the mechanical and thermal properties of lightweight concrete prepared from clay, cement, and wood aggregates,” Cement and Concrete Research, vol. 28, no. 8, pp. 1179–1190, 1998.
[23] A. Brambilla and T. Jusselme, “Preventing overheating in offices through thermal inertial properties of compressed earth bricks: A study on a real scale prototype,” Energy and
Buildings, vol. 156, pp. 281–292, 2017.
[24] L. Soudani, M. Woloszyn, A. Fabbri, J.-C. Morel, and A.-C. Grillet, “Energy evaluation of rammed earth walls using long term in-situ measurements,” Solar Energy, vol. 141, pp. 70–80, 2017.
[25] F. El Fgaier, Z. Lafhaj, E. Antczak, and C. Chapiseau, “Dynamic thermal performance of three types of unfired earth bricks,” Applied Thermal Engineering, vol. 93, pp. 377–383, 2016.
[26] G. A. Abanto, M. Karkri, G. Lefebvre, M. Horn, J. L. Solis, and M. M. Gómez, “Thermal properties of adobe employed in Peruvian rural areas: Experimental results and numerical simulation of a traditional bio-composite material,” Case Studies in
[27] AFNOR, “NF EN ISO 12571 - Performance hygrothermique des matériaux et produits pour le bâtiment - Détermination des propriétés de sorption hygroscopique.” NF EN ISO 12571, 2013.
[28] C. A. S. Hill, A. Norton, and G. Newman, “The water vapor sorption behavior of natural fibers,” Journal of Applied Polymer Science, vol. 112, no. 3, pp. 1524–1537, 2009. [29] H. Cagnon, J. E. Aubert, M. Coutand, and C. Magniont, “Hygrothermal properties of
earth bricks,” Energy and Buildings, vol. 80, pp. 208–217, 2014.
[30] Z. Pavlík, J. Žumár, I. Medved, and R. Černý, “Water Vapor Adsorption in Porous Building Materials: Experimental Measurement and Theoretical Analysis,” Transport in
Porous Media, vol. 91, no. 3, pp. 939–954, 2012.
[31] S. J. Schmidt and J. W. Lee, “Comparison Between Water Vapor Sorption Isotherms Obtained Using The New Dynamic Dewpoint Isotherm Method and those Obtained Using The Standard Saturated Salt Slurry Method,” International Journal of Food
Properties, vol. 15, no. 2, pp. 236–248, 2012.
[32] M. Palumbo, “Contribution to the development of new bio-based thermal insulation materials made from vegetal pith and natural binders,” PhD Thesis, Universitat Politècnica de Catalunya, Barcelona, 2015.
[33] A. Laborel-Préneron, C. Magniont, and J.-E. Aubert, “Characterization of barley straw, hemp shiv and corn cob as resources for bioaggregate based building materials,”
Waste and Biomass Valorization, 2017. 10.1007/s12649-017-9895-z
[34] A. Laborel-Préneron, J.-E. Aubert, C. Magniont, P. Maillard, and C. Poirier, “Effect of plant aggregates on mechanical properties of earth bricks,” Journal of Materials in Civil
Engineering, vol. 29, no. 12, 2017.
[35] International Organisation for Standardization, “ISO 8302 - Thermal insulation - Determination of steady-state thermal resistance and related properties - Guarded hot plate apparatus.” 1991.
[36] European Standards, “EN 12667 - Thermal performance of building materials and products - Determination of thermal resistance by means of guarded hot plate and heat flow meter methods - Products of high and medium thermal resistance.” 2001.
[37] AFNOR, “Plastics - Differential scanning calorimetry (DSC) - Part 4: Determination of specific heat capacity.” NF EN 11357-4, 2014.
[38] B. Seng, C. Magniont, S. Spagnol, and S. Lorente, “Assessment of a precast hemp concrete hygrothermal properties,” in Proceedings of the 2nd International Conference
on Bio-Based Building Materials, Clermont-Ferrand, France, 2017, pp. 386–393.
[39] AFNOR, “NF EN ISO 12572 - Performance hygrothermique des matériaux et produits pour le bâtiment - Détermination des propriétés de transmission de la vapeur d’eau.” NF EN ISO 12572, 2001.
[40] ASTM, “E96/E96M-10 - Standard test methods for water vapor transmission of materials.” American Society for Testing and Materials, 2010.
[41] P. W. Winston and D. H. Bates, “Saturated Solutions For the Control of Humidity in Biological Research,” Ecology, vol. 41, no. 1, pp. 232–237, 1960.
[42] C. Feng, H. Janssen, Y. Feng, and Q. Meng, “Hygric properties of porous building materials: Analysis of measurement repeatability and reproducibility,” Building and
Environment, vol. 85, pp. 160–172, 2015.
[43] F. McGregor, A. Heath, A. Shea, and M. Lawrence, “The moisture buffering capacity of unfired clay masonry,” Building and Environment, vol. 82, pp. 599–607, 2014.
[44] M. Bachar, L. Azzouz, M. Rabehi, and B. Mezghiche, “Characterization of a stabilized earth concrete and the effect of incorporation of aggregates of cork on its thermo-mechanical properties: Experimental study and modeling,” Construction and Building
Materials, vol. 74, pp. 259–267, 2015.
[45] J.-P. Laurent, “études et recherches, Propriétés thermiques du matériau terre”, CSTB 1987.
[46] J. Khedari, P. Watsanasathaporn, and J. Hirunlabh, “Development of fibre-based soil– cement block with low thermal conductivity,” Cement and Concrete Composites, vol. 27, no. 1, pp. 111–116, 2005.

![Figure 1. Schematic layout of the DVS system [7]](https://thumb-eu.123doks.com/thumbv2/123doknet/14354464.501512/11.892.115.594.310.597/figure-schematic-layout-dvs.webp)